Grundlæggende statistik
| Institutionelle aktier (lange) | 123.560.685 - 105,00% (ex 13D/G) - change of -23,02MM shares -15,71% MRQ |
| Institutionel værdi (lang) | $ 1.979.194 USD ($1000) |
Institutionelt ejerskab og aktionærer
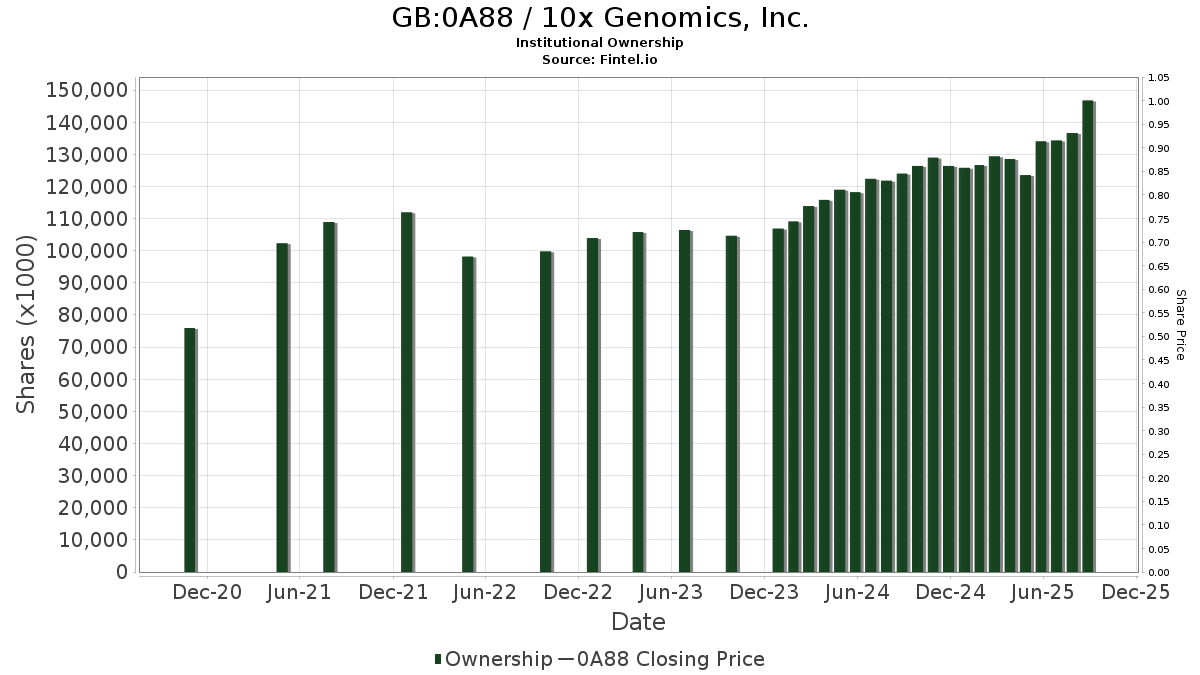
10x Genomics, Inc. (GB:0A88) har 329 institutionelle ejere og aktionærer, der har indsendt 13D/G- eller 13F-formularer til Securities Exchange Commission (SEC). Disse institutioner har i alt 123,560,685 aktier. Største aktionærer omfatter Vanguard Group Inc, ARK Investment Management LLC, Fmr Llc, BlackRock, Inc., Sumitomo Mitsui Trust Holdings, Inc., Nikko Asset Management Americas, Inc., Quantinno Capital Management LP, Morgan Stanley, Goldman Sachs Group Inc, and Geode Capital Management, Llc .
10x Genomics, Inc. (LSE:0A88) institutionel ejerskabsstruktur viser aktuelle positioner i virksomheden efter institutioner og fonde, samt seneste ændringer i positionsstørrelse. Større aktionærer kan omfatte individuelle investorer, investeringsforeninger, hedgefonde eller institutioner. Skema 13D angiver, at investoren besidder (eller besidder) mere end 5 % af virksomheden og har til hensigt (eller har til hensigt at) aktivt at forfølge en ændring i forretningsstrategi. Skema 13G indikerer en passiv investering på over 5%.
The share price as of April 24, 2026 is 21,96 / share. Previously, on December 2, 2025, the share price was 17,88 / share. This represents an increase of 22,81% over that period.
Fondens stemningsscore
Fund Sentiment Score (fka Ownership Accumulation Score) finder de aktier, der bliver mest købt af fonde. Det er resultatet af en sofistikeret, multi-faktor kvantitativ model, der identificerer virksomheder med de højeste niveauer af institutionel akkumulering. Scoringsmodellen bruger en kombination af den samlede stigning i oplyste ejere, ændringerne i porteføljeallokeringer i disse ejere og andre målinger. Tallet går fra 0 til 100, hvor højere tal indikerer et højere niveau af akkumulering for sine jævnaldrende, og 50 er gennemsnittet.
Opdateringsfrekvens: Dagligt
Se Ownership Explorer, som giver en liste over højest rangerende virksomheder.
AI+ Ask Fintel’s AI assistant about 10x Genomics, Inc..
Select a question to share a public post with an AI-crafted answer.
Thinking of good questions…
13F og NPORT arkivering
Detaljer om 13F-arkivering er gratis. Detaljer om NP-ansøgninger kræver et premium-medlemskab. Grønne rækker angiver nye positioner. Røde rækker angiver lukkede positioner. Klik på linket ikon for at se den fulde transaktionshistorik.
Opgrader
for at låse premium-data op og eksportere til Excel ![]() .
.
| Fil dato | Kilde | Investor | Type | Gennemsnitlig pris (Øst) |
Aktier | Δ Aktier (%) |
Rapporteret Værdi ($1000) |
Δ Værdi (%) |
Port Alloc (%) |
|
|---|---|---|---|---|---|---|---|---|---|---|
| 2026-02-10 | 13F | Daiwa Securities Group Inc. | 370 | 0,00 | 0 | |||||
| 2026-02-10 | 13F | Savant Capital, LLC | 0 | -100,00 | 0 | |||||
| 2026-01-16 | 13F | Ronald Blue Trust, Inc. | 0 | -100,00 | 0 | |||||
| 2026-02-11 | 13F | Bradley & Co. Private Wealth Management, LLC | 0 | -100,00 | 0 | |||||
| 2026-04-21 | 13F | Pallas Capital Advisors LLC | 48.917 | -5,38 | 1.039 | 23,13 | ||||
| 2026-01-15 | 13F | Nisa Investment Advisors, Llc | 2.414 | 0,00 | 39 | 39,29 | ||||
| 2026-02-11 | 13F | ARK Investment Management LLC | 12.667.369 | 6,56 | 206.605 | 48,68 | ||||
| 2026-02-17 | 13F | Capstone Investment Advisors, Llc | 0 | -100,00 | 0 | -100,00 | ||||
| 2026-02-05 | 13F | Cambridge Investment Research Advisors, Inc. | 80.003 | 37,89 | 1 | |||||
| 2026-02-17 | 13F | Clear Street Markets Llc | 0 | -100,00 | 0 | |||||
| 2026-02-13 | 13F | Barclays Plc | 317.982 | -37,08 | 5.186 | -12,22 | ||||
| 2026-01-28 | 13F | Arizona State Retirement System | 28.414 | -3,96 | 463 | 34,20 | ||||
| 2026-02-12 | 13F | Renaissance Technologies Llc | 1.550.539 | 48,39 | 25.289 | 107,03 | ||||
| 2026-02-18 | 13F | EP Wealth Advisors, Inc. | 11.506 | 188 | ||||||
| 2026-02-10 | 13F/A | Northwestern Mutual Wealth Management Co | 615 | 11,01 | 10 | 66,67 | ||||
| 2026-02-05 | 13F | Bank Julius Baer & Co. Ltd, Zurich | 0 | -100,00 | 0 | |||||
| 2026-02-17 | 13F | Scientech Research LLC | 10.213 | -79,67 | 167 | -71,72 | ||||
| 2026-02-17 | 13F | Moore Capital Management, Lp | 0 | -100,00 | 0 | |||||
| 2026-02-12 | 13F | BlackRock, Inc. | 10.014.462 | 5,86 | 163.336 | 47,70 | ||||
| 2026-02-09 | 13F | Hantz Financial Services, Inc. | 23 | 0,00 | 0 | |||||
| 2026-02-13 | 13F | Headlands Technologies LLC | 22.931 | 89,29 | 374 | 165,25 | ||||
| 2026-02-17 | 13F | Tudor Investment Corp Et Al | 0 | -100,00 | 0 | -100,00 | ||||
| 2026-04-15 | 13F | Merit Financial Group, LLC | 35.171 | 4,88 | 747 | 36,63 | ||||
| 2026-02-06 | 13F | Fortis Group Advisors, LLC | 82.918 | 311,46 | 1.675 | 510,95 | ||||
| 2026-02-17 | 13F | ExodusPoint Capital Management, LP | 0 | -100,00 | 0 | -100,00 | ||||
| 2026-02-17 | 13F | Dark Forest Capital Management Lp | 0 | -100,00 | 0 | -100,00 | ||||
| 2026-02-17 | 13F | Oxford Asset Management Llp | 0 | -100,00 | 0 | -100,00 | ||||
| 2026-02-02 | 13F | Principal Financial Group Inc | 249.007 | 53,52 | 4.061 | 114,19 | ||||
| 2026-01-29 | 13F | Dunhill Financial, LLC | 2 | 0 | ||||||
| 2026-02-13 | 13F | Colony Group, LLC | 189.059 | 334,39 | 3.084 | 424,32 | ||||
| 2026-02-03 | 13F | Ethic Inc. | 15.306 | -13,79 | 250 | 20,29 | ||||
| 2026-04-24 | 13F | Root Financial Partners, LLC | 99 | 10,00 | 2 | 100,00 | ||||
| 2025-11-12 | 13F | Group One Trading, L.p. | 0 | -100,00 | 0 | -100,00 | ||||
| 2026-01-30 | 13F | Jennison Associates Llc | 66.969 | 46,20 | 1.092 | 104,11 | ||||
| 2026-02-17 | 13F | Brevan Howard Capital Management LP | 0 | -100,00 | 0 | |||||
| 2026-02-13 | 13F | Edgestream Partners, L.P. | 0 | -100,00 | 0 | |||||
| 2026-02-06 | 13F | Copia Wealth Management | 0 | -100,00 | 0 | |||||
| 2026-04-21 | 13F | Red Tortoise LLC | 217 | 0,00 | 5 | 33,33 | ||||
| 2026-01-16 | 13F | Empirical Financial Services, LLC d.b.a. Empirical Wealth Management | 19.004 | 310 | ||||||
| 2026-02-17 | 13F | Quantedge Capital Pte Ltd | 203.953 | 3.326 | ||||||
| 2026-02-17 | 13F | Tower Research Capital LLC (TRC) | 6.563 | -88,14 | 107 | -83,44 | ||||
| 2026-01-20 | 13F | AdvisorNet Financial, Inc | 0 | -100,00 | 0 | |||||
| 2026-02-17 | 13F | Fred Alger Management, Llc | 101.683 | 55,52 | 1.658 | 117,02 | ||||
| 2025-11-14 | 13F | State Of Wisconsin Investment Board | 0 | -100,00 | 0 | |||||
| 2026-02-23 | 13F | Mv Capital Management, Inc. | 349 | 0,00 | 6 | 25,00 | ||||
| 2026-01-30 | 13F | Catalytic Wealth RIA, LLC | 0 | -100,00 | 0 | |||||
| 2026-02-09 | 13F | Key FInancial Inc | 0 | -100,00 | 0 | |||||
| 2026-02-13 | 13F | Harvard Management Co Inc | 170.000 | 0,00 | 2.773 | 39,51 | ||||
| 2026-02-13 | 13F | Prudential Financial Inc | 0 | -100,00 | 0 | |||||
| 2026-04-13 | 13F | IFP Advisors, Inc | 1.250 | 0,08 | 27 | 30,00 | ||||
| 2026-02-12 | 13F | Counterpoint Mutual Funds LLC | 0 | -100,00 | 0 | -100,00 | ||||
| 2026-02-11 | 13F | Cookson Peirce & Co Inc | 35.000 | 571 | ||||||
| 2026-02-17 | 13F | Summit Trail Advisors, Llc | 220.386 | -1,90 | 3.594 | 36,86 | ||||
| 2026-01-27 | 13F | TriaGen Wealth Management LLC | 23.204 | 378 | ||||||
| 2026-01-29 | 13F | UBS Group AG | 861.000 | 13,44 | 14.043 | 58,27 | ||||
| 2026-04-22 | 13F | Stone House Investment Management, LLC | 19 | 0,00 | 0 | |||||
| 2026-02-13 | 13F | Landscape Capital Management, L.l.c. | 51.499 | -27,54 | 840 | 1,08 | ||||
| 2026-02-13 | 13F | Van Eck Associates Corp | 3.668 | 85,91 | 0 | |||||
| 2026-02-06 | 13F | Gsa Capital Partners Llp | 18.931 | -84,37 | 0 | -100,00 | ||||
| 2026-02-11 | 13F | Fox Run Management, L.l.c. | 47.643 | 81,61 | 777 | 153,92 | ||||
| 2026-02-11 | 13F | Buckingham Strategic Partners | 19.882 | -9,54 | 324 | -1,52 | ||||
| 2026-02-17 | 13F | Mercer Global Advisors Inc /adv | 83.266 | 79,73 | 1.358 | 151,02 | ||||
| 2026-02-13 | 13F | Walleye Capital LLC | Put | 5.600 | 91 | |||||
| 2026-02-09 | 13F | Hartland & Co., LLC | 187 | -90,21 | 3 | -86,36 | ||||
| 2026-02-13 | 13F | Walleye Capital LLC | 1.577 | 26 | ||||||
| 2026-02-13 | 13F | Walleye Capital LLC | Call | 5.800 | 95 | |||||
| 2026-02-06 | 13F | Vestmark Advisory Solutions, Inc. | 270.668 | -1,37 | 4.415 | 37,59 | ||||
| 2026-01-28 | 13F | CAPROCK Group, Inc. | 190.913 | 59,36 | 3.114 | 85,52 | ||||
| 2026-02-12 | 13F | Federated Hermes, Inc. | 644.908 | -0,99 | 10.518 | 38,14 | ||||
| 2026-02-17 | 13F | Nomura Holdings Inc | 325.783 | 5.314 | ||||||
| 2026-02-13 | 13F | Birchview Capital, LP | 59.000 | 962 | ||||||
| 2026-04-22 | 13F | Quintet Private Bank (Europe) S.A. | 0 | -100,00 | 0 | |||||
| 2026-02-13 | 13F | Cynosure Management, Llc | 25.730 | 0,00 | 420 | 39,67 | ||||
| 2026-01-23 | 13F | Sumitomo Mitsui Trust Holdings, Inc. | 5.492.189 | 2,06 | 89.578 | 42,40 | ||||
| 2026-02-13 | 13F | Rhumbline Advisers | 143.440 | -11,88 | 2.339 | 22,98 | ||||
| 2026-02-19 | 13F/A | Axxcess Wealth Management, Llc | 15.457 | 2,74 | 252 | 44,00 | ||||
| 2026-02-13 | 13F | Healthcare Of Ontario Pension Plan Trust Fund | 169.075 | 2.758 | ||||||
| 2026-02-13 | 13F | Charles Schwab Investment Management Inc | 1.106.322 | -3,39 | 18.044 | 34,79 | ||||
| 2026-02-17 | 13F | Ancora Advisors, LLC | 1.081 | 18 | ||||||
| 2026-04-23 | 13F | TFC Financial Management | 57 | 0,00 | 1 | |||||
| 2026-02-13 | 13F | SRS Capital Advisors, Inc. | 6.618 | -92,73 | 108 | -89,94 | ||||
| 2026-02-17 | 13F | Fmr Llc | 11.917.482 | 40,90 | 194.374 | 96,59 | ||||
| 2026-04-21 | 13F | Pinnacle Associates Ltd | 11.226 | 238 | ||||||
| 2026-02-12 | 13F | New York State Common Retirement Fund | 36.017 | 4,45 | 587 | 45,66 | ||||
| 2026-04-21 | 13F | Venturi Wealth Management, LLC | 26.023 | 0,32 | 552 | 30,50 | ||||
| 2026-02-03 | 13F | Mitsubishi UFJ Kokusai Asset Management Co., Ltd. | 124 | 0,00 | 2 | 100,00 | ||||
| 2026-02-17 | 13F | Cresset Asset Management, LLC | 19.369 | -18,03 | 316 | 14,13 | ||||
| 2026-02-06 | 13F | Bare Financial Services, Inc | 163 | 75,27 | 3 | 100,00 | ||||
| 2026-02-19 | 13F | CI Private Wealth, LLC | 247.406 | 281,62 | 2.246 | 196,57 | ||||
| 2026-02-17 | 13F | Aqr Capital Management Llc | 2.579.051 | -5,43 | 41.858 | 33,01 | ||||
| 2025-11-14 | 13F | Ra Capital Management, L.p. | 0 | -100,00 | 0 | |||||
| 2026-01-28 | 13F | Klp Kapitalforvaltning As | 22.000 | 13,99 | 359 | 59,11 | ||||
| 2026-02-17 | 13F | Russell Investments Group, Ltd. | 533.947 | -5,94 | 8.709 | 31,22 | ||||
| 2025-11-14 | 13F | Worldquant Millennium Advisors Llc | 0 | -100,00 | 0 | -100,00 | ||||
| 2026-02-11 | 13F | Cerity Partners LLC | 129.251 | -3,08 | 2.108 | 35,30 | ||||
| 2026-02-12 | 13F | Voya Investment Management Llc | 35.242 | -6,45 | 575 | 30,45 | ||||
| 2026-02-17 | 13F | XTX Topco Ltd | 0 | -100,00 | 0 | |||||
| 2026-02-17 | 13F | Price T Rowe Associates Inc /md/ | 118.371 | -22,55 | 2 | 0,00 | ||||
| 2026-01-27 | 13F | Friedenthal Financial | 0 | -100,00 | 0 | |||||
| 2026-02-17 | 13F | Polymer Capital Management (US) LLC | 0 | -100,00 | 0 | |||||
| 2026-04-08 | 13F | Mirador Capital Partners LP | 77.293 | 1,26 | 1.641 | 31,83 | ||||
| 2026-02-09 | 13F | Atlantic Trust, LLC | 46 | 1 | ||||||
| 2026-02-13 | 13F | Ieq Capital, Llc | 760.096 | -6,80 | 12.397 | 30,04 | ||||
| 2026-02-13 | 13F | Pathstone Holdings, LLC | 25.436 | -37,44 | 415 | -12,84 | ||||
| 2026-02-10 | 13F | Quantbot Technologies LP | 64.065 | 1.045 | ||||||
| 2026-02-11 | 13F | Nikko Asset Management Americas, Inc. | 5.486.153 | 89.424 | ||||||
| 2026-02-17 | 13F | Canada Pension Plan Investment Board | 229.300 | 18,93 | 3.740 | 65,96 | ||||
| 2025-11-14 | 13F | Jain Global LLC | 0 | -100,00 | 0 | -100,00 | ||||
| 2025-11-14 | 13F | Natixis | 0 | -100,00 | 0 | -100,00 | ||||
| 2026-02-05 | 13F | Amalgamated Bank | 3.471 | -5,63 | 0 | |||||
| 2025-11-07 | 13F | Readystate Asset Management Lp | 0 | -100,00 | 0 | -100,00 | ||||
| 2026-03-31 | 13F/A | Barclays Plc | Call | 0 | -100,00 | 0 | -100,00 | |||
| 2026-02-10 | 13F | State of Wyoming | 13.796 | 225 | ||||||
| 2026-02-06 | 13F | EverSource Wealth Advisors, LLC | 6.174 | -0,21 | 101 | 38,89 | ||||
| 2026-02-09 | 13F | Legal & General Group Plc | 101.896 | -12,44 | 1.662 | 22,13 | ||||
| 2026-02-11 | 13F | Ameritas Investment Partners, Inc. | 8.961 | 146 | ||||||
| 2026-02-12 | 13F | Bank Of Montreal /can/ | 30.717 | -94,78 | 501 | -92,73 | ||||
| 2026-01-27 | 13F | Brighton Jones Llc | 0 | -100,00 | 0 | |||||
| 2026-02-17 | 13F | Odyssean, LLC | 30.490 | 497 | ||||||
| 2026-02-11 | 13F | Parallel Advisors, LLC | 2.561 | 2,19 | 42 | 41,38 | ||||
| 2026-02-13 | 13F | C M Bidwell & Associates Ltd | 12 | 0,00 | 0 | |||||
| 2026-02-02 | 13F | Oppenheimer & Co Inc | 0 | -100,00 | 0 | |||||
| 2026-02-11 | 13F | Group One Trading, L.p. | Call | 66.700 | 0,91 | 1.088 | 40,80 | |||
| 2026-02-13 | 13F | Smartleaf Asset Management LLC | 535 | 457,29 | 9 | 700,00 | ||||
| 2026-02-10 | 13F | Dynasty Wealth Management, Llc | 25.255 | 5,46 | 412 | 47,31 | ||||
| 2026-04-07 | 13F | Estate Planners Group, LLC | 40 | 1 | ||||||
| 2026-02-17 | 13F | Jones Financial Companies Lllp | 1.272 | -23,00 | 21 | 5,26 | ||||
| 2026-02-11 | 13F | Syon Capital Llc | 50.392 | 20,64 | 822 | 68,24 | ||||
| 2026-02-17 | 13F | Man Group plc | 393.064 | -33,89 | 6.411 | -7,77 | ||||
| 2026-04-23 | 13F | SJS Investment Consulting Inc. | 2.231 | -25,51 | 47 | -2,08 | ||||
| 2026-02-06 | 13F | Nano Cap New Millennium Growth Fund L P | 30.000 | 489 | ||||||
| 2026-02-06 | 13F | Covestor Ltd | 1.595 | -10,14 | 0 | |||||
| 2026-01-12 | 13F | Lancaster Investment Management | 0 | -100,00 | 0 | |||||
| 2026-02-06 | 13F | ProShare Advisors LLC | 25.325 | 12,97 | 413 | 57,63 | ||||
| 2026-04-06 | 13F | GAMMA Investing LLC | 4.193 | 6,42 | 89 | 39,06 | ||||
| 2026-02-12 | 13F | Dimensional Fund Advisors Lp | 1.517.581 | 100,90 | 24.752 | 180,34 | ||||
| 2026-02-03 | 13F | Crestwood Advisors Group LLC | 14.692 | 240 | ||||||
| 2026-02-12 | 13F | Davy Global Fund Management Ltd | 632.079 | 31,87 | 10.309 | 83,99 | ||||
| 2025-11-12 | 13F | Brinker Capital Investments, LLC | 0 | -100,00 | 0 | -100,00 | ||||
| 2026-02-13 | 13F | Great West Life Assurance Co /can/ | 25.848 | 1,90 | 0 | |||||
| 2026-02-13 | 13F | Brandywine Managers, Llc | 18.938 | 0,00 | 309 | 39,37 | ||||
| 2026-01-30 | 13F | Us Bancorp \de\ | 6.350 | 6,51 | 104 | 49,28 | ||||
| 2026-02-13 | 13F | Y-Intercept (Hong Kong) Ltd | 20.922 | 341 | ||||||
| 2026-02-17 | 13F | Lazard Asset Management Llc | 228.745 | 80,67 | 3.731 | 152,03 | ||||
| 2026-02-13 | 13F | Victory Capital Management Inc | 12.902 | 1,46 | 210 | 41,89 | ||||
| 2026-01-29 | 13F | IMC-Chicago, LLC | 16.134 | 263 | ||||||
| 2026-02-17 | 13F | Arch Venture Corp | 737.539 | 12.029 | ||||||
| 2026-01-29 | 13F | IMC-Chicago, LLC | Put | 16.300 | 266 | |||||
| 2026-01-29 | 13F | IMC-Chicago, LLC | Call | 19.500 | 318 | |||||
| 2026-01-28 | 13F | Universal- Beteiligungs- und Servicegesellschaft mbH | 108.215 | 7,27 | 1.763 | 49,53 | ||||
| 2026-02-12 | 13F | Jane Street Group, Llc | Put | 0 | -100,00 | 0 | -100,00 | |||
| 2026-02-17 | 13F | Voloridge Investment Management, Llc | 1.228.703 | -7,00 | 20.040 | 29,75 | ||||
| 2026-02-17 | 13F | Two Sigma Securities, Llc | 0 | -100,00 | 0 | |||||
| 2026-02-11 | 13F | Deutsche Bank Ag\ | 101.629 | -38,10 | 1.658 | -13,65 | ||||
| 2026-02-13 | 13F | Ossiam | 229.300 | 0,00 | 3.740 | 39,51 | ||||
| 2026-02-23 | 13F | Virtu Financial LLC | 0 | -100,00 | 0 | |||||
| 2026-02-11 | 13F | CenterBook Partners LP | 230.772 | 3.764 | ||||||
| 2026-04-07 | 13F | U.S. Capital Wealth Advisors, LLC | 10.898 | 231 | ||||||
| 2025-11-04 | 13F | Mutual Advisors, LLC | 0 | -100,00 | 0 | |||||
| 2026-02-12 | 13F | Quadrant Capital Group Llc | 982 | 0,00 | 16 | 45,45 | ||||
| 2026-02-12 | 13F | Wealthspire Advisors, LLC | 0 | -100,00 | 0 | |||||
| 2026-02-19 | 13F/A | T. Rowe Price Investment Management, Inc. | 1.279.503 | -4,69 | 21 | 33,33 | ||||
| 2025-11-14 | 13F | Vident Advisory, LLC | 0 | -100,00 | 0 | |||||
| 2026-02-17 | 13F | Northern Trust Corp | 993.380 | -4,41 | 16.202 | 33,37 | ||||
| 2026-04-07 | 13F | Green Alpha Advisors, LLC | 0 | -100,00 | 0 | |||||
| 2026-02-12 | 13F | Jane Street Group, Llc | 24.155 | -83,94 | 394 | -77,63 | ||||
| 2026-02-17 | 13F | Magnetar Financial LLC | 0 | -100,00 | 0 | |||||
| 2026-02-13 | 13F | Hudson Bay Capital Management LP | 50.000 | 816 | ||||||
| 2026-02-12 | 13F | Jane Street Group, Llc | Call | 10.500 | -79,41 | 171 | -71,31 | |||
| 2026-02-10 | 13F | Foundations Investment Advisors, LLC | 45.185 | -20,60 | 737 | 10,68 | ||||
| 2026-01-28 | 13F | Chicago Partners Investment Group LLC | 42.791 | 14,87 | 958 | 92,94 | ||||
| 2026-02-10 | 13F | Connor, Clark & Lunn Investment Management Ltd. | 709.579 | 123,51 | 11.573 | 211,86 | ||||
| 2026-02-09 | 13F | Geode Capital Management, Llc | 2.789.784 | 2,90 | 45.509 | 43,57 | ||||
| 2025-11-14 | 13F | Bank Of Nova Scotia | 0 | -100,00 | 0 | -100,00 | ||||
| 2026-01-13 | 13F | Stephens Consulting, LLC | 21 | 0,00 | 0 | |||||
| 2026-01-29 | 13F | Vanguard Group Inc | 13.017.914 | -1,93 | 212.322 | 36,83 | ||||
| 2026-04-08 | 13F | Wealth Enhancement Advisory Services, Llc | 152.187 | 28,20 | 3.398 | 48,25 | ||||
| 2026-04-10 | 13F | GEM Asset Management, LLC | 9.902 | 210 | ||||||
| 2026-02-13 | 13F | Bridgefront Capital, LLC | 0 | -100,00 | 0 | |||||
| 2026-02-17 | 13F | Alliancebernstein L.p. | 126.200 | 0,00 | 2.058 | 39,53 | ||||
| 2026-02-17 | 13F | Deerfield Management Company, L.p. (series C) | 126.574 | -51,54 | 2.064 | -32,39 | ||||
| 2026-02-12 | 13F | DRW Securities, LLC | 0 | -100,00 | 0 | |||||
| 2026-04-22 | 13F | Sterling Capital Management LLC | 2.973 | -39,19 | 63 | -20,25 | ||||
| 2026-02-05 | 13F | Td Private Client Wealth Llc | 76 | -48,65 | 1 | 0,00 | ||||
| 2026-02-17 | 13F | Public Employees Retirement System Of Ohio | 127.250 | 7,33 | 2.075 | 49,71 | ||||
| 2026-02-20 | 13F | Kovitz Investment Group Partners, LLC | 0 | -100,00 | 0 | -100,00 | ||||
| 2026-02-11 | 13F | Simplex Trading, Llc | Put | 31.900 | -52,03 | 520 | ||||
| 2026-02-12 | 13F | Jasper Ridge Partners, L.P. | 39.457 | 0,00 | 644 | 39,48 | ||||
| 2025-11-13 | 13F | Entropy Technologies, LP | 0 | -100,00 | 0 | |||||
| 2026-02-11 | 13F | Simplex Trading, Llc | 15.986 | 261 | ||||||
| 2026-02-11 | 13F | Simplex Trading, Llc | Call | 10.100 | -94,21 | 165 | 8.100,00 | |||
| 2026-04-21 | 13F | Aaron Wealth Advisors LLC | 46.381 | -30,16 | 985 | -9,14 | ||||
| 2026-02-17 | 13F | Engineers Gate Manager LP | 93.378 | -54,97 | 1.523 | -37,21 | ||||
| 2026-02-13 | 13F | Neuberger Berman Group LLC | 11.473 | -0,92 | 187 | 38,52 | ||||
| 2026-02-13 | 13F | JustInvest LLC | 23.266 | 1,96 | 379 | 42,48 | ||||
| 2026-02-17 | 13F | Gotham Asset Management, LLC | 94.717 | 400,30 | 1.545 | 598,64 | ||||
| 2026-02-11 | 13F | Capital World Investors | 1.452.300 | 0,00 | 23.687 | 39,52 | ||||
| 2026-02-17 | 13F | Atom Investors LP | 0 | -100,00 | 0 | |||||
| 2026-01-29 | 13F | Comerica Bank | 2.650 | -1,34 | 43 | 38,71 | ||||
| 2026-02-17 | 13F | Raymond James Financial Inc | 0 | -100,00 | 0 | |||||
| 2026-02-06 | 13F | Global Retirement Partners, LLC | 337 | 648,89 | 5 | |||||
| 2026-04-16 | 13F | SG Americas Securities, LLC | 38.134 | -40,20 | 1 | -100,00 | ||||
| 2026-02-17 | 13F | Cinctive Capital Management LP | 34.019 | -22,86 | 555 | 7,57 | ||||
| 2026-02-11 | 13F | Strategic Advocates LLC | 0 | -100,00 | 0 | |||||
| 2026-02-13 | 13F | Manufacturers Life Insurance Company, The | 0 | -100,00 | 0 | |||||
| 2026-01-28 | 13F | WPG Advisers, LLC | 6 | 0,00 | 0 | |||||
| 2026-02-13 | 13F | Caxton Associates Llp | 12.044 | -34,32 | 196 | -8,41 | ||||
| 2026-02-18 | 13F | Zazove Associates Llc | 60.000 | 140 | ||||||
| 2026-02-17 | 13F | Susquehanna International Group, Llp | 53.528 | -50,61 | 873 | -31,04 | ||||
| 2026-02-17 | 13F | Creative Planning | 58.719 | 3,24 | 958 | 44,13 | ||||
| 2026-02-17 | 13F | Susquehanna International Group, Llp | Put | 77.600 | -4,43 | 1.266 | 33,30 | |||
| 2026-01-28 | 13F | DekaBank Deutsche Girozentrale | 2.027 | 0,00 | 0 | |||||
| 2026-02-17 | 13F | Susquehanna International Group, Llp | Call | 101.800 | -22,17 | 1.660 | 8,57 | |||
| 2026-04-16 | 13F | Capital Advisors, Ltd. LLC | 136 | 0,00 | 0 | |||||
| 2026-04-15 | 13F | Bayforest Capital Ltd | 542 | -96,91 | 12 | -96,14 | ||||
| 2025-11-06 | 13F | Versor Investments LP | 0 | -100,00 | 0 | -100,00 | ||||
| 2026-02-17 | 13F | Algert Global Llc | 390.280 | -32,06 | 6 | 0,00 | ||||
| 2026-02-13 | 13F | Martingale Asset Management L P | 89.006 | 3,49 | 1.452 | 44,38 | ||||
| 2026-01-23 | 13F | Rsm Us Wealth Management Llc | 27.055 | 17,40 | 440 | 63,20 | ||||
| 2026-02-17 | 13F | Schonfeld Strategic Advisors LLC | 0 | -100,00 | 0 | |||||
| 2026-02-13 | 13F | MAI Capital Management | 24 | -72,41 | 0 | -100,00 | ||||
| 2026-02-10 | 13F | Bnp Paribas Arbitrage, Sa | 52.115 | -33,06 | 850 | -6,70 | ||||
| 2026-01-12 | 13F | CVA Family Office, LLC | 5 | 0,00 | 0 | |||||
| 2026-02-20 | 13F | Sunbelt Securities, Inc. | 152 | 0,00 | 2 | 100,00 | ||||
| 2026-02-17 | 13F | Clough Capital Partners L P | 610.374 | 9.955 | ||||||
| 2026-02-09 | 13F | Keating Financial Advisory Services, Inc. | 19 | 0 | ||||||
| 2026-02-09 | 13F | North Star Asset Management Inc | 29.140 | -27,12 | 475 | 1,71 | ||||
| 2026-02-13 | 13F | National Bank Of Canada /fi/ | 38 | -97,28 | 1 | -100,00 | ||||
| 2026-02-13 | 13F | Dynamic Technology Lab Private Ltd | 51.203 | -46,82 | 835 | -25,84 | ||||
| 2026-02-17 | 13F | TCG Advisory Services, LLC | 25.491 | 17,12 | 416 | 63,39 | ||||
| 2026-02-17 | 13F | Jump Financial, LLC | 171.192 | 100,71 | 2.792 | 180,04 | ||||
| 2026-02-03 | 13F | SBI Securities Co., Ltd. | 14.647 | 18,37 | 239 | 65,28 | ||||
| 2026-04-13 | 13F | Massmutual Trust Co Fsb/adv | 410 | 0,00 | 9 | 33,33 | ||||
| 2026-02-06 | 13F | Pnc Financial Services Group, Inc. | 8.687 | -3,25 | 142 | 35,58 | ||||
| 2026-02-12 | 13F | Principal Securities, Inc. | 0 | -100,00 | 0 | |||||
| 2026-04-20 | 13F | Inscription Capital, LLC | 69.505 | -13,48 | 1.476 | 12,60 | ||||
| 2026-02-17 | 13F | Captrust Financial Advisors | 41.272 | 13,89 | 673 | 59,10 | ||||
| 2026-04-13 | 13F | True Wealth Design, LLC | 4.812 | 4,40 | 102 | 36,00 | ||||
| 2026-02-12 | 13F | Marex Group plc | 29.401 | 480 | ||||||
| 2026-04-23 | 13F | Impact Partnership Wealth, LLC | 10.403 | 221 | ||||||
| 2026-02-06 | 13F | Larson Financial Group LLC | 2.364 | 164,43 | 39 | 280,00 | ||||
| 2026-01-26 | 13F | Whittier Trust Co | 0 | -100,00 | 0 | |||||
| 2026-04-22 | 13F | Pictet Asset Management Holding SA | 219.049 | -4,44 | 4.361 | 17,71 | ||||
| 2026-02-17 | 13F | Citadel Advisors Llc | Put | 10.500 | -76,14 | 171 | -66,73 | |||
| 2026-02-06 | 13F | HighTower Advisors, LLC | Put | 0 | -100,00 | 0 | -100,00 | |||
| 2026-02-12 | 13F | Callan Family Office, LLC | 14.297 | 233 | ||||||
| 2026-02-17 | 13F | Citadel Advisors Llc | Call | 107.100 | 62,77 | 1.747 | 127,05 | |||
| 2026-02-06 | 13F | HighTower Advisors, LLC | 0 | -100,00 | 0 | -100,00 | ||||
| 2026-02-17 | 13F | Citadel Advisors Llc | 130.820 | 2.134 | ||||||
| 2026-02-11 | 13F | IMA Wealth, Inc. | 18 | 0,00 | 0 | |||||
| 2026-02-17 | 13F | Quantinno Capital Management LP | 4.667.203 | 33,64 | 76.122 | 86,45 | ||||
| 2026-02-10 | 13F | Baker Avenue Asset Management, LP | 35.627 | 28,61 | 581 | 79,88 | ||||
| 2026-02-12 | 13F | Advisors Asset Management, Inc. | 0 | -100,00 | 0 | |||||
| 2026-01-27 | 13F | Optas, LLC | 22.383 | 66,08 | 365 | 132,48 | ||||
| 2026-02-17 | 13F | Two Sigma Investments, Lp | 1.155.691 | 95,42 | 18.849 | 172,66 | ||||
| 2026-02-10 | 13F | Goldman Sachs Group Inc | 3.087.267 | 15,40 | 50.353 | 61,01 | ||||
| 2026-02-11 | 13F | Jpmorgan Chase & Co | 928.426 | -13,54 | 15.143 | 20,62 | ||||
| 2026-02-04 | 13F | Virginia Retirement Systems Et Al | 63.103 | 4,64 | 1.029 | 46,16 | ||||
| 2026-04-24 | 13F | Capricorn Fund Managers Ltd | 101.800 | 2.161 | ||||||
| 2026-02-06 | 13F | Transce3nd, LLC | 0 | -100,00 | 0 | |||||
| 2026-02-13 | 13F | Jacobs Levy Equity Management, Inc | 2.639.999 | -10,45 | 43.058 | 24,95 | ||||
| 2026-02-13 | 13F | Arrowstreet Capital, Limited Partnership | 15.680 | 256 | ||||||
| 2026-02-12 | 13F | Steward Partners Investment Advisory, Llc | 17.012 | 12.138,85 | 277 | 27.600,00 | ||||
| 2026-02-10 | 13F | CIBC World Markets Inc. | 63.849 | 2,22 | 1.041 | 42,60 | ||||
| 2026-02-11 | 13F | Los Angeles Capital Management Llc | 34.346 | 427 | ||||||
| 2026-04-23 | 13F | Private Wealth Management Group, LLC | 395 | 0,00 | 8 | 33,33 | ||||
| 2026-04-22 | 13F | Cornerstone Wealth Group, LLC | 16.177 | 18,11 | 372 | 66,37 | ||||
| 2026-02-17 | 13F | Freshford Capital Management, LLC | 833.302 | 13.591 | ||||||
| 2026-02-09 | 13F | Quest Partners LLC | 41.159 | -69,15 | 671 | -56,96 | ||||
| 2026-02-17 | 13F | MIRAE ASSET GLOBAL ETFS HOLDINGS Ltd. | 121.427 | 3,39 | 1.980 | 44,31 | ||||
| 2026-02-17 | 13F | Optiver Holding B.V. | 70 | -91,27 | 1 | -88,89 | ||||
| 2025-11-06 | 13F | Ing Groep Nv | 0 | -100,00 | 0 | -100,00 | ||||
| 2026-02-13 | 13F | Morgan Stanley | 3.196.893 | 13,48 | 52.141 | 58,32 | ||||
| 2026-02-17 | 13F | Prelude Capital Management, Llc | 91.983 | 23,90 | 1.500 | 73,01 | ||||
| 2026-02-12 | 13F | CIBC Private Wealth Group, LLC | 22 | 0,00 | 0 | |||||
| 2026-04-15 | 13F | Fortitude Family Office, LLC | 180 | -41,94 | 4 | -40,00 | ||||
| 2026-02-03 | 13F | Ballentine Partners, LLC | 15.411 | -1,77 | 251 | 37,16 | ||||
| 2026-02-17 | 13F | Qube Research & Technologies Ltd | 245.636 | 123,01 | 4.006 | 211,27 | ||||
| 2026-02-13 | 13F | Caitong International Asset Management Co., Ltd | 0 | -100,00 | 0 | |||||
| 2026-02-17 | 13F | Wellington Management Group Llp | 1.448.765 | -66,19 | 23.629 | -52,83 | ||||
| 2026-04-14 | 13F | Zrc Wealth Management, Llc | 344 | 29,81 | 7 | 75,00 | ||||
| 2026-04-07 | 13F | Signaturefd, Llc | 2.781 | 5,62 | 59 | 40,48 | ||||
| 2026-04-15 | 13F | Gf Fund Management Co. Ltd. | 2.616 | 14,34 | 56 | 48,65 | ||||
| 2026-04-23 | 13F | Interchange Capital Partners, LLC | 14.575 | -51,17 | 178 | -63,58 | ||||
| 2026-02-17 | 13F | Advisor Group Holdings, Inc. | 183.363 | 16,13 | 2.991 | 63,57 | ||||
| 2025-11-14 | 13F/A | Skopos Labs, Inc. | 0 | -100,00 | 0 | -100,00 | ||||
| 2025-11-14 | 13F | Petrus Trust Company, LTA | 0 | -100,00 | 0 | -100,00 | ||||
| 2026-04-13 | 13F | St Germain D J Co Inc | 52 | 0,00 | 1 | |||||
| 2026-02-10 | 13F | Bruce G. Allen Investments, LLC | 113 | 0,00 | 2 | 0,00 | ||||
| 2026-03-12 | 13F/A | Peak6 Llc | Call | 20.500 | 9,04 | 334 | 52,51 | |||
| 2026-01-20 | 13F | C2P Capital Advisory Group, LLC d.b.a. Prosperity Capital Advisors | 0 | -100,00 | 0 | |||||
| 2026-01-27 | 13F | Zurcher Kantonalbank (Zurich Cantonalbank) | 26.671 | 1,06 | 435 | 41,23 | ||||
| 2025-11-13 | 13F | Panagora Asset Management Inc | 0 | -100,00 | 0 | |||||
| 2026-02-13 | 13F | Ubs Asset Management Americas Inc | 169.589 | 14,29 | 2.766 | 59,46 | ||||
| 2026-02-17 | 13F | Royal Bank Of Canada | 108.112 | -92,44 | 1.764 | -89,45 | ||||
| 2026-02-17 | 13F | Millennium Management Llc | 1.242.366 | -77,15 | 20.263 | -68,13 | ||||
| 2026-01-21 | 13F | Sound Income Strategies, LLC | 489 | 10 | ||||||
| 2026-02-05 | 13F | Allworth Financial LP | 2.074 | -9,19 | 34 | 26,92 | ||||
| 2026-02-10 | 13F | Norges Bank | 72.674 | 1.185 | ||||||
| 2026-02-09 | 13F | Jefferies Financial Group Inc. | 14.299 | 233 | ||||||
| 2026-01-27 | 13F | Evergreen Capital Management Llc | 14.757 | 241 | ||||||
| 2026-02-17 | 13F | ArrowMark Colorado Holdings LLC | 16.143 | 0,00 | 263 | 39,89 | ||||
| 2026-04-17 | 13F | Krilogy Financial LLC | 16.366 | 0,19 | 413 | 12,53 | ||||
| 2026-04-24 | 13F | Strs Ohio | 48.100 | -8,56 | 1.021 | 19,14 | ||||
| 2026-02-12 | 13F | Nuveen, LLC | 236.403 | 3,45 | 3.856 | 44,33 | ||||
| 2026-04-21 | 13F | Financial Consulate, Inc | 156.457 | 0,00 | 3.322 | 30,18 | ||||
| 2026-02-12 | 13F | Ensign Peak Advisors, Inc | 8.990 | -69,15 | 147 | -57,06 | ||||
| 2025-11-14 | 13F | Amundi | 0 | -100,00 | 0 | -100,00 | ||||
| 2026-02-11 | 13F | 111 Capital | 0 | -100,00 | 0 | -100,00 | ||||
| 2026-04-14 | 13F | Grant Private Wealth Management Inc | 0 | -100,00 | 0 | |||||
| 2026-02-02 | 13F | Benjamin Edwards Inc | 66.064 | 0,60 | 1.077 | 40,42 | ||||
| 2025-11-14 | 13F | WealthTrak Capital Management LLC | 0 | -100,00 | 0 | |||||
| 2026-02-02 | 13F | Sachetta, LLC | 488 | 0,00 | 8 | 40,00 | ||||
| 2026-02-13 | 13F | Kilter Group LLC | 244 | -3,94 | 4 | 50,00 | ||||
| 2026-02-06 | 13F | Leonteq Securities AG | 9 | 0,00 | 0 | |||||
| 2026-02-13 | 13F | Pinnacle Wealth Planning Services, Inc. | 3.942 | 64 | ||||||
| 2026-02-10 | 13F | Bank of New York Mellon Corp | 350.964 | -7,37 | 5.724 | 29,24 | ||||
| 2026-02-11 | 13F | Franklin Resources Inc | 250.016 | -28,53 | 4.078 | -0,29 | ||||
| 2026-02-12 | 13F | Cibc World Markets Corp | 0 | -100,00 | 0 | |||||
| 2025-11-07 | 13F | HighTower Advisors, LLC | Call | 0 | -100,00 | 0 | -100,00 | |||
| 2026-02-11 | 13F | Group One Trading, L.p. | Put | 300 | -75,00 | 5 | -71,43 | |||
| 2026-02-12 | 13F | MetLife Investment Management, LLC | 63.171 | 0,00 | 1.030 | 39,57 | ||||
| 2026-02-09 | 13F | Harbour Investments, Inc. | 227 | 0,00 | 4 | 50,00 | ||||
| 2026-01-28 | 13F | N.E.W. Advisory Services LLC | 0 | -100,00 | 0 | |||||
| 2026-02-17 | 13F | Aquatic Capital Management LLC | 0 | -100,00 | 0 | |||||
| 2025-11-14 | 13F | Integrated Wealth Concepts LLC | 0 | -100,00 | 0 | -100,00 | ||||
| 2026-04-10 | 13F | Intellectus Partners, LLC | 13.500 | -5,26 | 287 | 23,28 | ||||
| 2026-02-05 | 13F | Elyxium Wealth, LLC | 1.129 | 18 | ||||||
| 2025-11-14 | 13F | Millennium Management Llc | Call | 0 | -100,00 | 0 | -100,00 | |||
| 2026-02-11 | 13F | MCF Advisors LLC | 6.431 | 0,00 | 105 | 38,67 | ||||
| 2026-02-17 | 13F | Old Mission Capital Llc | 0 | -100,00 | 0 | |||||
| 2025-10-31 | 13F | Pier 88 Investment Partners Llc | 0 | -100,00 | 0 | |||||
| 2026-02-13 | 13F | Public Employees Retirement Association Of Colorado | 9.253 | 0,00 | 0 | |||||
| 2026-02-09 | 13F | Simplify Asset Management Inc. | 485.977 | 7.926 | ||||||
| 2026-02-12 | 13F | EntryPoint Capital, LLC | 0 | -100,00 | 0 | |||||
| 2026-01-28 | 13F | Teacher Retirement System Of Texas | 0 | -100,00 | 0 | |||||
| 2026-02-11 | 13F | Manchester Capital Management LLC | 61 | 1 | ||||||
| 2026-04-06 | 13F | Versant Capital Management, Inc | 44.471 | 29,74 | 944 | 68,87 | ||||
| 2026-02-17 | 13F | Twinbeech Capital Lp | 0 | -100,00 | 0 | |||||
| 2026-01-30 | 13F/A | M&t Bank Corp | 21.699 | 6,28 | 354 | 48,74 | ||||
| 2026-02-13 | 13F | Citigroup Inc | 135.955 | -47,97 | 2.217 | -27,41 | ||||
| 2026-04-22 | 13F | Abundance Wealth Counselors | 9.476 | 201 | ||||||
| 2026-02-14 | 13F | Rockefeller Capital Management L.P. | 17.186 | 170,39 | 280 | 278,38 | ||||
| 2026-02-17 | 13F | Two Sigma Advisers, Lp | 1.264.900 | 5,42 | 20.631 | 47,08 | ||||
| 2026-02-11 | 13F | Rise Advisors, LLC | 0 | -100,00 | 0 | |||||
| 2026-04-07 | 13F | Farther Finance Advisors, LLC | 1.482 | 120,86 | 33 | 220,00 | ||||
| 2026-01-27 | 13F/A | Capital Performance Advisors Llp | 10.267 | 1,36 | 167 | 41,53 | ||||
| 2026-02-10 | 13F | Rothschild Investment Llc | 296 | 11,70 | 5 | 33,33 | ||||
| 2026-02-12 | 13F | State Board Of Administration Of Florida Retirement System | 26.432 | 0,00 | 431 | 39,94 | ||||
| 2026-03-06 | 13F | Hsbc Holdings Plc | 0 | -100,00 | 0 | |||||
| 2026-04-15 | 13F | Sarver Vrooman Wealth Advisors | 0 | -100,00 | 0 | |||||
| 2026-02-17 | 13F | Bellevue Group AG | 322.060 | 2,62 | 5.253 | 43,18 | ||||
| 2026-02-13 | 13F | Mariner, LLC | 10.157 | -58,31 | 166 | -41,90 | ||||
| 2026-02-13 | 13F | Level Four Advisory Services, Llc | 47.650 | -12,97 | 777 | 21,41 | ||||
| 2026-02-13 | 13F | American Century Companies Inc | 271.654 | 14,41 | 4.431 | 59,64 | ||||
| 2026-02-11 | 13F | J.Safra Asset Management Corp | 204 | 3 | ||||||
| 2026-02-17 | 13F | Ameriprise Financial Inc | 383.169 | 11,99 | 6.249 | 56,26 | ||||
| 2026-01-29 | 13F | Sanctuary Advisors, LLC | 0 | -100,00 | 0 | -100,00 | ||||
| 2026-02-12 | 13F | Hrt Financial Lp | 181.152 | 3 | ||||||
| 2026-04-07 | 13F | CoreCap Advisors, LLC | 52 | 0,00 | 1 | |||||
| 2025-11-14 | 13F | Sherbrooke Park Advisers Llc | 0 | -100,00 | 0 | -100,00 | ||||
| 2026-02-13 | 13F | Exome Asset Management LLC | 163.658 | 0,00 | 2.669 | 39,52 | ||||
| 2026-04-09 | 13F | Wedmont Private Capital | 11.046 | 254 | ||||||
| 2026-02-13 | 13F | Marshall Wace, Llp | 91.700 | 1.496 | ||||||
| 2026-01-14 | 13F | ORG Partners LLC | 392 | 6 | ||||||
| 2026-02-13 | 13F | Atlas Capital Advisors Llc | 1.234 | 0,00 | 20 | 42,86 | ||||
| 2026-02-10 | 13F | Intech Investment Management Llc | 40.047 | 1,44 | 653 | 41,65 | ||||
| 2026-02-06 | 13F | Handelsbanken Fonder AB | 46.800 | 32,95 | 1 | |||||
| 2026-02-02 | 13F | Danske Bank A/s | 400 | 0,00 | 7 | 50,00 | ||||
| 2026-02-17 | 13F | Janus Henderson Group Plc | 545.826 | -41,49 | 8.902 | -18,38 | ||||
| 2026-02-17 | 13F | Numerai GP LLC | 92.360 | -40,35 | 1.506 | -16,75 | ||||
| 2026-02-12 | 13F | Johnson Financial Group, Inc. | 119 | 0,00 | 2 | 0,00 | ||||
| 2026-02-17 | 13F | Casdin Capital, LLC | 1.400.000 | 22.834 | ||||||
| 2026-02-17 | 13F | Private Advisor Group, LLC | 66.993 | 1.093 | ||||||
| 2026-02-17 | 13F | PDT Partners, LLC | 80.219 | -26,35 | 1.308 | 2,75 | ||||
| 2026-02-18 | 13F | Zazove Associates Llc | Call | 0 | -100,00 | 0 | ||||
| 2025-12-08 | 13F | NWF Advisory Services Inc. | 4.216 | 236 | ||||||
| 2026-02-13 | 13F | State Street Corp | 2.512.519 | -0,30 | 40.979 | 39,10 | ||||
| 2026-02-09 | 13F | Huntington National Bank | 396 | 0,00 | 6 | 50,00 | ||||
| 2026-02-06 | 13F | GPS Wealth Strategies Group, LLC | 0 | -100,00 | 0 | |||||
| 2026-02-17 | 13F | Susquehanna Portfolio Strategies, LLC | 298.230 | 0,00 | 4.864 | 39,53 | ||||
| 2026-01-29 | 13F | Ashton Thomas Private Wealth, LLC | 15.152 | -29,57 | 247 | -1,59 | ||||
| 2025-11-14 | 13F | Verition Fund Management LLC | 0 | -100,00 | 0 | -100,00 | ||||
| 2026-04-24 | 13F | UMA Financial Services, Inc. | 260 | 0,00 | 6 | 25,00 | ||||
| 2026-02-13 | 13F | Gts Securities Llc | 0 | -100,00 | 0 | |||||
| 2026-02-17 | 13F | Advisory Services Network, LLC | 0 | -100,00 | 0 | |||||
| 2026-02-13 | 13F | Police & Firemen's Retirement System of New Jersey | 28.045 | -8,66 | 457 | 27,65 | ||||
| 2026-02-13 | 13F | Sands Capital Ventures, LLC | 481.770 | 0,00 | 7.858 | 39,53 | ||||
| 2026-02-13 | 13F | Sei Investments Co | 20.931 | 341 | ||||||
| 2026-01-20 | 13F | Stratos Wealth Partners, LTD. | 14.052 | 7,25 | 229 | 49,67 | ||||
| 2026-01-12 | 13F | Rialto Wealth Management, LLC | 60 | 0,00 | 1 | |||||
| 2026-02-13 | 13F | Squarepoint Ops LLC | 27.850 | 454 | ||||||
| 2026-02-13 | 13F | Bridgewater Associates, LP | 177.734 | 2.899 | ||||||
| 2026-02-17 | 13F | D. E. Shaw & Co., Inc. | 174.468 | 7,10 | 2.846 | 49,42 | ||||
| 2026-02-17 | 13F | Wiley Bros.-aintree Capital, Llc | 13.339 | 218 | ||||||
| 2026-02-13 | 13F | Cornerstone Financial Management LLC | 37 | 1 | ||||||
| 2026-01-30 | 13F | Activest Wealth Management | 0 | -100,00 | 0 | |||||
| 2026-01-30 | 13F | Trifecta Capital Advisors, LLC | 210 | -98,79 | 3 | -98,51 | ||||
| 2026-04-20 | 13F | Assenagon Asset Management S.A. | 14.577 | -16,40 | 309 | 8,80 | ||||
| 2026-02-03 | 13F | Buck Wealth Strategies, LLC | 12.599 | 205 | ||||||
| 2026-02-10 | 13F | Acadian Asset Management Llc | 98.271 | 12,69 | 2 | 0,00 | ||||
| 2026-01-29 | 13F | China Universal Asset Management Co., Ltd. | 18.979 | -5,37 | 310 | 32,05 | ||||
| 2026-02-17 | 13F | Bank Of America Corp /de/ | 1.837.520 | -46,17 | 29.970 | -24,89 | ||||
| 2026-02-23 | 13F | Kera Capital Partners, Inc. | 47.829 | 48,22 | 966 | 156,23 | ||||
| 2026-01-28 | 13F | Geneos Wealth Management Inc. | 2.351 | 38 | ||||||
| 2026-02-17 | 13F | Voleon Capital Management Lp | 86.442 | -71,76 | 1.410 | -60,62 | ||||
| 2026-02-13 | 13F | Stifel Financial Corp | 182.624 | -5,05 | 2.979 | 32,47 | ||||
| 2026-01-26 | 13F | Cwm, Llc | 124.970 | -0,66 | 2 | 100,00 | ||||
| 2025-11-13 | 13F | GeoWealth Management, LLC | 0 | -100,00 | 0 | -100,00 | ||||
| 2026-01-26 | 13F | Asset Dedication, LLC | 51 | 0,00 | 1 | |||||
| 2026-02-11 | 13F | LPL Financial LLC | 62.035 | -49,24 | 1.012 | -29,20 | ||||
| 2026-02-19 | 13F | Invesco Ltd. | 334.300 | 21,23 | 5.452 | 69,16 | ||||
| 2026-01-30 | 13F | Camden Capital, LLC | 20.204 | 4,68 | 330 | 46,22 | ||||
| 2026-01-29 | 13F | Quent Capital, LLC | 9.137 | 2.976,43 | 149 | 4.866,67 | ||||
| 2025-11-21 | 13F/A | CIBC Bancorp USA Inc. | 11.434 | 134 | ||||||
| 2026-02-17 | 13F | Crawford Fund Management, LLC | Put | 17.600 | 10,00 | 287 | 53,48 | |||
| 2025-11-05 | 13F | SOUTH STATE Corp | 0 | -100,00 | 0 | -100,00 | ||||
| 2026-01-26 | 13F | Mirae Asset Global Investments Co., Ltd. | 5.660 | 27,97 | 92 | 80,39 | ||||
| 2026-02-10 | 13F | Envestnet Asset Management Inc | 61.813 | -34,24 | 1.008 | -8,20 | ||||
| 2026-02-13 | 13F | Wells Fargo & Company/mn | 344.950 | 42,45 | 5.626 | 98,80 | ||||
| 2026-02-17 | 13F | Trexquant Investment LP | 752.634 | -27,23 | 12.275 | 1,53 | ||||
| 2026-01-15 | 13F | Lodestone Wealth Management LLC | 38 | 1 | ||||||
| 2026-02-17 | 13F | Cetera Investment Advisers | 27.832 | 1,37 | 454 | 41,56 | ||||
| 2026-04-14 | 13F | Thurston, Springer, Miller, Herd & Titak, Inc. | 10 | 0,00 | 0 | |||||
| 2026-02-10 | 13F | Axq Capital, Lp | 0 | -100,00 | 0 | |||||
| 2026-02-14 | 13F | Tao Capital Management LP | 210.862 | 0,00 | 3.439 | 39,57 | ||||
| 2026-02-17 | 13F | Blackstone Group Inc | 0 | -100,00 | 0 | |||||
| 2025-11-14 | 13F | Blue Water Life Science Advisors, LLC | 0 | -100,00 | 0 | -100,00 | ||||
| 2026-01-23 | 13F | Avion Wealth | 62 | 0,00 | 0 | |||||
| 2025-11-06 | 13F | Abich Financial Wealth Management LLC | 4.758 | 1.858,02 | 56 | 1.000,00 | ||||
| 2025-11-14 | 13F | Federation des caisses Desjardins du Quebec | 0 | -100,00 | 0 | |||||
| 2026-02-17 | 13F | Perbak Capital Partners LLP | 11.167 | 182 | ||||||
| 2026-01-26 | 13F | KBC Group NV | 5.072 | 0,00 | 0 | |||||
| 2026-02-17 | 13F | Capital Fund Management S.a. | 0 | -100,00 | 0 | |||||
| 2026-04-17 | 13F | Bell Investment Advisors, Inc | 61 | 0,00 | 1 | |||||
| 2026-02-17 | 13F | California State Teachers Retirement System | 126.293 | 41,64 | 2.060 | 97,60 | ||||
| 2026-01-30 | 13F | Torren Management, LLC | 599 | 10 | ||||||
| 2026-02-12 | 13F | Swiss National Bank | 203.000 | 4,75 | 3.311 | 46,14 | ||||
| 2025-11-14 | 13F | Invenomic Capital Management LP | 0 | -100,00 | 0 | -100,00 | ||||
| 2026-04-16 | 13F | Evolve Private Wealth, Llc | 15.428 | -26,36 | 328 | -4,11 | ||||
| 2026-02-13 | 13F | Parkside Financial Bank & Trust | 748 | 0,00 | 12 | 50,00 |