Grundlæggende statistik
| Institutionelle aktier (lange) | 49.770.213 - 86,49% (ex 13D/G) - change of -26,12MM shares -34,41% MRQ |
| Institutionel værdi (lang) | $ 2.894.028 USD ($1000) |
Institutionelt ejerskab og aktionærer
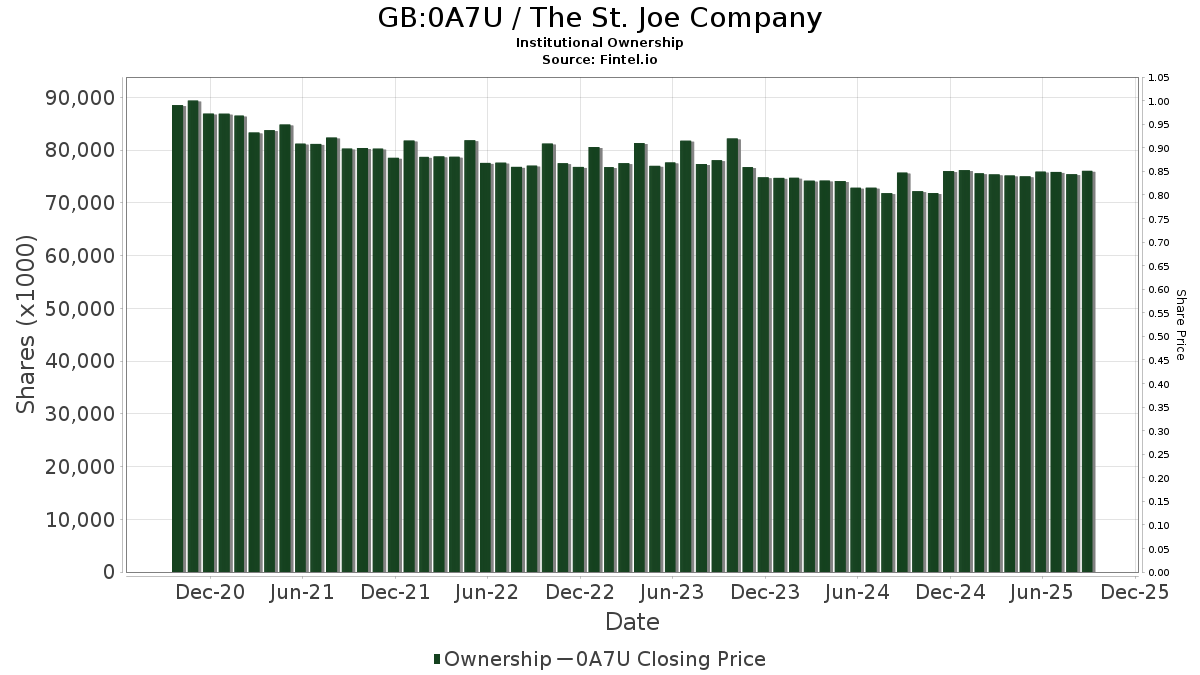
The St. Joe Company (GB:0A7U) har 303 institutionelle ejere og aktionærer, der har indsendt 13D/G- eller 13F-formularer til Securities Exchange Commission (SEC). Disse institutioner har i alt 49,770,213 aktier. Største aktionærer omfatter Fairholme Capital Management Llc, BlackRock, Inc., Vanguard Group Inc, State Street Corp, Dimensional Fund Advisors Lp, Select Equity Group, L.P., Geode Capital Management, Llc, Capital Research Global Investors, Fmr Llc, and Praetorian PR LLC .
The St. Joe Company (LSE:0A7U) institutionel ejerskabsstruktur viser aktuelle positioner i virksomheden efter institutioner og fonde, samt seneste ændringer i positionsstørrelse. Større aktionærer kan omfatte individuelle investorer, investeringsforeninger, hedgefonde eller institutioner. Skema 13D angiver, at investoren besidder (eller besidder) mere end 5 % af virksomheden og har til hensigt (eller har til hensigt at) aktivt at forfølge en ændring i forretningsstrategi. Skema 13G indikerer en passiv investering på over 5%.
Fondens stemningsscore
Fund Sentiment Score (fka Ownership Accumulation Score) finder de aktier, der bliver mest købt af fonde. Det er resultatet af en sofistikeret, multi-faktor kvantitativ model, der identificerer virksomheder med de højeste niveauer af institutionel akkumulering. Scoringsmodellen bruger en kombination af den samlede stigning i oplyste ejere, ændringerne i porteføljeallokeringer i disse ejere og andre målinger. Tallet går fra 0 til 100, hvor højere tal indikerer et højere niveau af akkumulering for sine jævnaldrende, og 50 er gennemsnittet.
Opdateringsfrekvens: Dagligt
Se Ownership Explorer, som giver en liste over højest rangerende virksomheder.
AI+ Ask Fintel’s AI assistant about The St. Joe Company.
Select a question to share a public post with an AI-crafted answer.
Thinking of good questions…
13F og NPORT arkivering
Detaljer om 13F-arkivering er gratis. Detaljer om NP-ansøgninger kræver et premium-medlemskab. Grønne rækker angiver nye positioner. Røde rækker angiver lukkede positioner. Klik på linket ikon for at se den fulde transaktionshistorik.
Opgrader
for at låse premium-data op og eksportere til Excel ![]() .
.
| Fil dato | Kilde | Investor | Type | Gennemsnitlig pris (Øst) |
Aktier | Δ Aktier (%) |
Rapporteret Værdi ($1000) |
Δ Værdi (%) |
Port Alloc (%) |
|
|---|---|---|---|---|---|---|---|---|---|---|
| 2026-02-13 | 13F | Rhumbline Advisers | 100.578 | -6,29 | 5.971 | 12,45 | ||||
| 2026-02-18 | 13F | Front Street Capital Management, Inc. | 330.349 | -1,61 | 20 | 18,75 | ||||
| 2026-03-26 | 13F/A | Peak6 Llc | 0 | -100,00 | 0 | -100,00 | ||||
| 2026-02-12 | 13F | Jane Street Group, Llc | Call | 8.300 | -67,95 | 493 | -61,59 | |||
| 2026-02-09 | 13F | Legal & General Group Plc | 122.684 | 15,91 | 7.284 | 39,07 | ||||
| 2026-02-12 | 13F | Jane Street Group, Llc | 89.068 | 163,57 | 5.288 | 216,21 | ||||
| 2026-02-17 | 13F | Susquehanna Fundamental Investments, Llc | 20.698 | 0,00 | 1.229 | 19,92 | ||||
| 2025-11-14 | 13F | Mountain Lake Investment Management LLC | 0 | -100,00 | 0 | -100,00 | ||||
| 2026-02-13 | 13F | Stifel Financial Corp | 38.221 | 0,03 | 2.269 | 20,05 | ||||
| 2025-11-14 | 13F | Petrus Trust Company, LTA | 0 | -100,00 | 0 | |||||
| 2025-11-14 | 13F | Warren Averett Asset Management, LLC | 0 | -100,00 | 0 | |||||
| 2026-01-27 | 13F | Zurcher Kantonalbank (Zurich Cantonalbank) | 8.485 | 16,12 | 504 | 39,34 | ||||
| 2026-02-12 | 13F | Rossby Financial, LCC | 14.025 | -16,14 | 833 | 0,36 | ||||
| 2026-02-13 | 13F | Ubs Asset Management Americas Inc | 66.419 | -38,66 | 3.943 | -26,40 | ||||
| 2026-01-29 | 13F | Vanguard Group Inc | 5.717.399 | -4,06 | 339.442 | 15,12 | ||||
| 2026-02-13 | 13F | Sterling Capital Management LLC | 249 | 170,65 | 15 | 250,00 | ||||
| 2026-02-19 | 13F | CI Private Wealth, LLC | 7.154 | -10,10 | 425 | 7,89 | ||||
| 2026-02-10 | 13F | Bnp Paribas Arbitrage, Sa | 9.108 | -68,66 | 541 | -62,42 | ||||
| 2026-02-04 | 13F | Independent Advisor Alliance | 8.531 | -3,74 | 506 | 15,53 | ||||
| 2026-01-30 | 13F | NJ State Employees Deferred Compensation Plan | 0 | -100,00 | 0 | |||||
| 2026-02-03 | 13F | Sterling Investment Management, Inc. | 20.819 | -1,16 | 1.236 | 18,62 | ||||
| 2026-01-26 | 13F | Cwm, Llc | 12.738 | -5,65 | 1 | |||||
| 2026-02-02 | 13F | Montag A & Associates Inc | 200 | 0,00 | 12 | 22,22 | ||||
| 2026-04-06 | 13F | Versant Capital Management, Inc | 77 | 0,00 | 5 | 0,00 | ||||
| 2026-01-23 | 13F | State of Alaska, Department of Revenue | 23.642 | 1,40 | 1 | 0,00 | ||||
| 2026-02-17 | 13F | Susquehanna Portfolio Strategies, LLC | 5.463 | -69,56 | 324 | -63,47 | ||||
| 2026-02-17 | 13F | Susquehanna International Group, Llp | Put | 14.300 | 849 | |||||
| 2026-02-17 | 13F | Susquehanna International Group, Llp | Call | 62.000 | 46,57 | 3.681 | 75,82 | |||
| 2026-02-17 | 13F | D. E. Shaw & Co., Inc. | 10.608 | -14,52 | 630 | 2,44 | ||||
| 2026-02-24 | 13F | Bell Investment Advisors, Inc | 55 | 0,00 | 3 | 50,00 | ||||
| 2026-02-10 | 13F | Rothschild Investment Llc | 69 | 15,00 | 4 | 100,00 | ||||
| 2026-02-11 | 13F | Ameritas Investment Partners, Inc. | 3.183 | 189 | ||||||
| 2026-02-13 | 13F | Arete Wealth Advisors, LLC | 6.059 | 5,26 | 0 | |||||
| 2026-02-13 | 13F | Smartleaf Asset Management LLC | 1.083 | 9,06 | 65 | 30,61 | ||||
| 2026-02-18 | 13F | GWM Advisors LLC | 24.290 | 233,79 | 1.442 | 300,56 | ||||
| 2026-02-17 | 13F | Laird Norton Trust Company, Llc | 5.992 | 356 | ||||||
| 2026-01-29 | 13F | UBS Group AG | 39.990 | -59,44 | 2.374 | -51,33 | ||||
| 2026-02-11 | 13F | Gilpin Wealth Management, Llc | 3 | 0 | ||||||
| 2026-04-13 | 13F | Massmutual Trust Co Fsb/adv | 67 | 0,00 | 4 | 33,33 | ||||
| 2026-02-11 | 13F | Jpmorgan Chase & Co | 92.799 | -32,81 | 5.509 | -19,39 | ||||
| 2026-02-17 | 13F | Point72 Asset Management, L.P. | 87.083 | 920,78 | 5.170 | 1.125,12 | ||||
| 2026-02-03 | 13F | Farmers & Merchants Investments Inc | 23 | 0,00 | 1 | 0,00 | ||||
| 2026-02-17 | 13F | Gotham Asset Management, LLC | 5.375 | 20,25 | 319 | 44,34 | ||||
| 2026-02-17 | 13F | Aquatic Capital Management LLC | 5.591 | -62,22 | 332 | -54,78 | ||||
| 2026-02-17 | 13F | Cetera Investment Advisers | 5.519 | 328 | ||||||
| 2026-02-17 | 13F | Wiley Bros.-aintree Capital, Llc | 12.642 | -0,37 | 751 | 19,62 | ||||
| 2026-02-17 | 13F | State Of Wisconsin Investment Board | 16.800 | 53,72 | 997 | 84,63 | ||||
| 2026-02-11 | 13F | LPL Financial LLC | 17.354 | 2,62 | 1.030 | 23,21 | ||||
| 2026-01-27 | 13F | Mills Wealth Advisors LLC | 89.823 | -0,31 | 5.333 | 19,61 | ||||
| 2026-02-12 | 13F | New York State Common Retirement Fund | 13.291 | 0,00 | 789 | 20,09 | ||||
| 2026-01-29 | 13F | Camelot Portfolios, LLC | 500 | 30 | ||||||
| 2025-11-14 | 13F | Point72 Europe (London) LLP | 8 | 0 | ||||||
| 2026-02-03 | 13F | Lumbard & Kellner, LLC | 18.091 | 6,51 | 1.074 | 27,86 | ||||
| 2026-02-17 | 13F | Kerrisdale Advisers, LLC | 23.990 | 0,00 | 1.424 | 19,97 | ||||
| 2026-02-13 | 13F | Neuberger Berman Group LLC | 4.207 | 250 | ||||||
| 2026-02-17 | 13F | Advisor Group Holdings, Inc. | 7.926 | -11,39 | 471 | 5,38 | ||||
| 2026-02-13 | 13F | Police & Firemen's Retirement System of New Jersey | 10.107 | -10,22 | 600 | 7,72 | ||||
| 2026-02-17 | 13F | Nitor Capital Management LLC | 535.431 | 31.789 | ||||||
| 2026-04-10 | 13F | Granite FO LLC | 2.000 | 0,00 | 126 | 5,93 | ||||
| 2026-02-13 | 13F | Arrowstreet Capital, Limited Partnership | 11.000 | -74,36 | 653 | -69,24 | ||||
| 2026-01-29 | 13F | Nbc Securities, Inc. | 0 | -100,00 | 0 | |||||
| 2026-02-17 | 13F | Creative Planning | 28.634 | 61,36 | 1.700 | 93,62 | ||||
| 2026-02-14 | 13F | Silver Grove Financial Group, Inc. | 7.933 | 0,04 | 471 | 19,90 | ||||
| 2026-01-27 | 13F | Journey Advisory Group, LLC | 75.881 | 0,93 | 4.505 | 21,13 | ||||
| 2026-02-11 | 13F | Rise Advisors, LLC | 0 | -100,00 | 0 | |||||
| 2026-02-17 | 13F | Ameriprise Financial Inc | 73.603 | -2,34 | 4.370 | 17,19 | ||||
| 2026-01-21 | 13F | Intrinsic Value Partners, LLC | 96.343 | -6,52 | 5.720 | 12,16 | ||||
| 2026-02-11 | 13F | Group One Trading, L.p. | 0 | -100,00 | 0 | -100,00 | ||||
| 2026-02-17 | 13F | MIRAE ASSET GLOBAL ETFS HOLDINGS Ltd. | 17.673 | -0,16 | 1.049 | 19,89 | ||||
| 2026-01-09 | 13F | 180 Wealth Advisors, Llc | 11.681 | 9,83 | 693 | 31,75 | ||||
| 2026-02-12 | 13F | Summit Financial, LLC | 0 | -100,00 | 0 | |||||
| 2026-02-17 | 13F | Algert Global Llc | 103.679 | -6,46 | 6 | 20,00 | ||||
| 2026-02-02 | 13F | Cornerstone Planning Group LLC | 47 | -62,10 | 3 | -89,66 | ||||
| 2025-10-30 | 13F | Twin Peaks Wealth Advisors, LLC | 0 | -100,00 | 0 | -100,00 | ||||
| 2026-02-13 | 13F | Victory Capital Management Inc | 429.376 | 5,38 | 25.492 | 26,45 | ||||
| 2026-02-12 | 13F | Elo Mutual Pension Insurance Co | 0 | -100,00 | 0 | |||||
| 2025-11-14 | 13F | Texas Permanent School Fund | 0 | -100,00 | 0 | |||||
| 2026-02-17 | 13F | Canada Pension Plan Investment Board | 7.300 | 433 | ||||||
| 2026-02-17 | 13F | Weiss Asset Management LP | 30.060 | 1.785 | ||||||
| 2026-01-26 | 13F | KBC Group NV | 1.346 | 0,00 | 0 | |||||
| 2026-02-13 | 13F | Manufacturers Life Insurance Company, The | 0 | -100,00 | 0 | |||||
| 2026-01-15 | 13F | Founders Capital Management | 200 | 0,00 | 12 | 22,22 | ||||
| 2026-01-16 | 13F | Marquette Asset Management, LLC | 33 | 2 | ||||||
| 2026-02-12 | 13F | Swiss National Bank | 74.300 | 1,23 | 4.411 | 21,48 | ||||
| 2026-02-12 | 13F | Dimensional Fund Advisors Lp | 1.358.337 | -0,34 | 80.646 | 19,58 | ||||
| 2025-11-14 | 13F | Cubist Systematic Strategies, LLC | 9.072 | -67,06 | 449 | -65,88 | ||||
| 2026-02-10 | 13F | Root Financial Partners, LLC | 129 | 24,04 | 8 | 40,00 | ||||
| 2026-02-13 | 13F | Prospector Partners Llc | 0 | -100,00 | 0 | |||||
| 2026-02-10 | 13F | Quantbot Technologies LP | 12.450 | -6,59 | 739 | 12,14 | ||||
| 2026-02-17 | 13F | Two Sigma Investments, Lp | 128.352 | 68,28 | 7.620 | 101,96 | ||||
| 2026-02-05 | 13F | Allworth Financial LP | 145 | 18,85 | 9 | 33,33 | ||||
| 2026-02-13 | 13F | Wells Fargo & Company/mn | 68.862 | 28,27 | 4.088 | 53,92 | ||||
| 2026-02-03 | 13F | Gallacher Capital Management LLC | 4.760 | -1,00 | 283 | 18,99 | ||||
| 2026-02-17 | 13F | Schonfeld Strategic Advisors LLC | 12.746 | -30,93 | 757 | -17,20 | ||||
| 2026-01-20 | 13F | Pflug Koory, LLC | 20.694 | 0,00 | 1.229 | 20,04 | ||||
| 2026-04-10 | 13F | Abound Wealth Management | 4 | 0,00 | 0 | |||||
| 2026-02-09 | 13F | Atlantic Trust, LLC | 0 | -100,00 | 0 | |||||
| 2026-02-11 | 13F | Illinois Municipal Retirement Fund | 21.696 | 9,30 | 1.288 | 31,16 | ||||
| 2025-11-14 | 13F | Oxford Asset Management Llp | 0 | -100,00 | 0 | -100,00 | ||||
| 2026-01-30 | 13F | Caldwell Securities, Inc | 6.294 | 18,89 | 374 | 42,91 | ||||
| 2026-02-13 | 13F | Resources Investment Advisors, LLC. | 3.471 | -22,16 | 206 | -6,36 | ||||
| 2026-01-28 | 13F | Universal- Beteiligungs- und Servicegesellschaft mbH | 5.390 | -29,83 | 320 | -15,79 | ||||
| 2026-02-17 | 13F | Leonteq Securities AG | 0 | -100,00 | 0 | |||||
| 2026-02-12 | 13F | Callan Family Office, LLC | 7.905 | 2,07 | 469 | 22,45 | ||||
| 2026-02-13 | 13F | Morgan Stanley | 396.097 | 8,27 | 23.516 | 29,91 | ||||
| 2026-02-20 | 13F | Sunbelt Securities, Inc. | 19 | 0,00 | 1 | |||||
| 2026-01-15 | 13F | Fortitude Family Office, LLC | 7 | -41,67 | 0 | |||||
| 2025-10-24 | 13F | Hemington Wealth Management | 81 | 35,00 | 0 | |||||
| 2026-04-07 | 13F | Farther Finance Advisors, LLC | 1.193 | 6,52 | 77 | 15,15 | ||||
| 2026-02-03 | 13F | SBI Securities Co., Ltd. | 48 | 0,00 | 3 | 0,00 | ||||
| 2026-01-16 | 13F | Louisiana State Employees Retirement System | 18.300 | -0,54 | 1.086 | 19,34 | ||||
| 2026-01-22 | 13F | Accordant Advisory Group Inc | 97.051 | 19,79 | 5.762 | 43,74 | ||||
| 2026-01-30 | 13F | Us Bancorp \de\ | 1.177 | 3,79 | 70 | 23,21 | ||||
| 2026-02-17 | 13F | Kemnay Advisory Services Inc. | 89 | 5 | ||||||
| 2026-02-13 | 13F | Sei Investments Co | 5.491 | 0,00 | 326 | 19,93 | ||||
| 2026-02-17 | 13F | Qube Research & Technologies Ltd | 83.185 | -41,15 | 4.939 | -29,39 | ||||
| 2026-04-08 | 13F | Fermata Advisors, LLC | 3.394 | 213 | ||||||
| 2026-02-12 | 13F | Wealthspire Advisors, LLC | 0 | -100,00 | 0 | |||||
| 2026-02-17 | 13F | Alliancebernstein L.p. | 51.134 | 12,05 | 3.036 | 34,47 | ||||
| 2026-02-05 | 13F | HFM Investment Advisors, LLC | 3 | 50,00 | 0 | |||||
| 2026-02-17 | 13F | Holt Capital Advisors, L.L.C. dba Holt Capital Partners, L.P. | 24.065 | 50,74 | 1.429 | 80,99 | ||||
| 2026-02-17 | 13F | T. Rowe Price Investment Management, Inc. | 97.895 | -70,03 | 6 | -68,75 | ||||
| 2026-02-09 | 13F | Royce & Associates Lp | 78.800 | 0,00 | 4.678 | 19,98 | ||||
| 2026-02-12 | 13F | Voya Investment Management Llc | 7.019 | 0,00 | 417 | 19,88 | ||||
| 2026-02-17 | 13F | Jones Financial Companies Lllp | 815 | 74,89 | 48 | 118,18 | ||||
| 2025-11-14 | 13F | Aigen Investment Management, Lp | 0 | -100,00 | 0 | |||||
| 2026-02-05 | 13F | Cornerstone Wealth Management, LLC | 0 | -100,00 | 0 | |||||
| 2026-02-11 | 13F | Franklin Resources Inc | 15.691 | 51,87 | 932 | 82,19 | ||||
| 2026-01-29 | 13F | IMC-Chicago, LLC | Put | 13.600 | 807 | |||||
| 2026-02-09 | 13F | Huntington National Bank | 0 | -100,00 | 0 | |||||
| 2026-02-11 | 13F | O'shaughnessy Asset Management, Llc | 5.628 | 334 | ||||||
| 2026-01-29 | 13F | IMC-Chicago, LLC | Call | 24.800 | 13,76 | 1.472 | 36,55 | |||
| 2026-01-29 | 13F | Teachers Retirement System Of The State Of Kentucky | 9.822 | -7,70 | 1 | |||||
| 2026-01-27 | 13F | Institute for Wealth Management, LLC. | 29.450 | -3,46 | 1.748 | 15,84 | ||||
| 2026-02-12 | 13F | RMR Capital Management, LLC | 43.464 | 0,00 | 2.580 | 20,00 | ||||
| 2025-11-05 | 13F | Old West Investment Management, LLC | 0 | -100,00 | 0 | |||||
| 2025-11-14 | 13F | Wolverine Trading, Llc | 10.233 | 58,33 | 506 | 59,62 | ||||
| 2026-02-19 | 13F | Invesco Ltd. | 169.191 | 47,65 | 10.045 | 77,17 | ||||
| 2025-11-14 | 13F | Wolverine Trading, Llc | Call | 15.200 | 752 | |||||
| 2026-01-15 | 13F | J. Safra Sarasin Holding AG | 7.562 | 0,00 | 449 | 19,79 | ||||
| 2026-02-17 | 13F | Polymer Capital Management (US) LLC | 0 | -100,00 | 0 | |||||
| 2025-11-14 | 13F | StoneX Group Inc. | 0 | -100,00 | 0 | -100,00 | ||||
| 2026-02-13 | 13F | Prudential Financial Inc | 75.255 | 84,45 | 4.468 | 121,36 | ||||
| 2026-02-13 | 13F | SRS Capital Advisors, Inc. | 26 | -99,62 | 2 | -99,70 | ||||
| 2026-02-10 | 13F | Mutual Of America Capital Management Llc | 4.554 | 1,74 | 270 | 22,17 | ||||
| 2026-02-12 | 13F | Quadrant Capital Group Llc | 4.040 | 0,00 | 240 | 20,10 | ||||
| 2026-02-13 | 13F | Marshall Wace, Llp | 0 | -100,00 | 0 | |||||
| 2026-02-10 | 13F | Argent Trust Co | 10.705 | 0,00 | 636 | 20,04 | ||||
| 2026-02-17 | 13F | Private Advisor Group, LLC | 4.002 | -13,41 | 238 | 3,95 | ||||
| 2025-11-12 | 13F | Legacy Capital Group California, Inc. | 0 | -100,00 | 0 | |||||
| 2026-02-24 | 13F | River Road Asset Management, LLC | 137.874 | -24,91 | 8.186 | -9,90 | ||||
| 2026-02-17 | 13F/A | RBF Capital, LLC | 25.000 | 0,00 | 1.484 | 19,97 | ||||
| 2026-02-17 | 13F | Northern Trust Corp | 412.446 | -9,50 | 24.487 | 8,59 | ||||
| 2025-11-14 | 13F | Point72 Asia (Singapore) Pte. Ltd. | 0 | -100,00 | 0 | |||||
| 2026-02-09 | 13F | Quest Partners LLC | 5.778 | -68,78 | 343 | -62,51 | ||||
| 2026-02-13 | 13F | Caitong International Asset Management Co., Ltd | 80 | 2.566,67 | 5 | |||||
| 2026-02-17 | 13F | Occudo Quantitative Strategies Lp | 14.357 | 852 | ||||||
| 2026-02-11 | 13F | Simplex Trading, Llc | Put | 1.100 | 22,22 | 65 | ||||
| 2026-02-10 | 13F | AdvisorShares Investments LLC | 0 | -100,00 | 0 | |||||
| 2026-02-10 | 13F | Intech Investment Management Llc | 14.949 | -35,15 | 888 | -22,19 | ||||
| 2026-02-13 | 13F | Public Employees Retirement Association Of Colorado | 5.084 | 0,00 | 0 | |||||
| 2026-04-14 | 13F | Wealthcare Advisory Partners LLC | 3.450 | 0,00 | 217 | 5,88 | ||||
| 2026-02-11 | 13F | Simplex Trading, Llc | 1.002 | -86,97 | 59 | |||||
| 2026-02-13 | 13F | Gator Capital Management, LLC | 32.583 | 1.934 | ||||||
| 2025-11-13 | 13F | Quadrature Capital Ltd | 0 | -100,00 | 0 | |||||
| 2026-02-09 | 13F | Geode Capital Management, Llc | 994.963 | 1,18 | 59.081 | 21,41 | ||||
| 2026-02-11 | 13F | Simplex Trading, Llc | Call | 1.100 | -38,89 | 65 | ||||
| 2026-02-12 | 13F | Cibc World Markets Corp | 0 | -100,00 | 0 | |||||
| 2026-01-26 | 13F | Annex Advisory Services, LLC | 32.176 | -2,23 | 1.910 | 17,32 | ||||
| 2026-02-14 | 13F | Rockefeller Capital Management L.P. | 20 | -97,04 | 1 | -96,97 | ||||
| 2026-02-17 | 13F | Trexquant Investment LP | 19.079 | 1.133 | ||||||
| 2026-02-04 | 13F | Blackhawk Capital Partners LLC. | 30.534 | -1,55 | 1.813 | 18,12 | ||||
| 2026-02-17 | 13F | Aqr Capital Management Llc | 187.100 | -10,56 | 11.108 | 7,32 | ||||
| 2026-02-11 | 13F | Winton Capital Group Ltd | 22.478 | 5,15 | 1.335 | 26,21 | ||||
| 2026-02-17 | 13F | Fairholme Capital Management Llc | 19.422.467 | -0,80 | 1.153.112 | 19,03 | ||||
| 2026-02-17 | 13F | Dauntless Investment Group, LLC | 42.714 | 46,21 | 2.536 | 75,43 | ||||
| 2026-02-13 | 13F | Ieq Capital, Llc | 31.209 | -14,04 | 1.853 | 3,12 | ||||
| 2026-02-17 | 13F | Optiver Holding B.V. | 4 | -97,53 | 0 | -100,00 | ||||
| 2026-04-08 | 13F | Thompson Investment Management, Inc. | 12 | 0,00 | 1 | |||||
| 2026-02-05 | 13F | AlphaCore Capital LLC | 4.042 | 240 | ||||||
| 2026-02-17 | 13F | Guggenheim Capital Llc | 16.849 | 1.000 | ||||||
| 2026-02-06 | 13F | EverSource Wealth Advisors, LLC | 679 | 39,71 | 40 | 66,67 | ||||
| 2026-02-06 | 13F | ProShare Advisors LLC | 7.428 | 3,02 | 441 | 23,88 | ||||
| 2026-02-17 | 13F | Russell Investments Group, Ltd. | 38.230 | -0,27 | 2.270 | 19,67 | ||||
| 2026-02-11 | 13F | Empowered Funds, LLC | 1.391 | 83 | ||||||
| 2026-01-23 | 13F | Assetmark, Inc | 352 | 1.035,48 | 21 | 1.900,00 | ||||
| 2026-02-12 | 13F | Cloud Capital Management, LLC | 0 | -100,00 | 0 | |||||
| 2026-04-13 | 13F | Trust Co | 1.200 | 0,00 | 75 | 5,63 | ||||
| 2026-02-13 | 13F | First Trust Advisors Lp | 33.821 | 24,53 | 2.008 | 49,44 | ||||
| 2026-02-17 | 13F | Raymond James Financial Inc | 162.417 | 30,00 | 9.643 | 55,99 | ||||
| 2026-02-11 | 13F | Los Angeles Capital Management Llc | 268 | 15 | ||||||
| 2026-01-28 | 13F | N.E.W. Advisory Services LLC | 0 | -100,00 | 0 | |||||
| 2026-02-17 | 13F | Forest Hill Capital, LLC | 74.000 | 0,00 | 4.393 | 19,99 | ||||
| 2026-01-23 | 13F | Sage Investment Counsel LLC | 5.200 | 0,00 | 309 | 19,84 | ||||
| 2026-02-13 | 13F | Meixler Investment Management, Ltd. | 16.296 | -20,60 | 967 | -4,73 | ||||
| 2026-02-17 | 13F | Susquehanna International Group, Llp | 0 | -100,00 | 0 | |||||
| 2026-02-13 | 13F | Citigroup Inc | 10.726 | -28,52 | 637 | -14,29 | ||||
| 2026-02-13 | 13F | Financial Freedom, LLC | 268 | 0,00 | 16 | 15,38 | ||||
| 2026-02-02 | 13F | Strs Ohio | 6.700 | -2,90 | 398 | 16,42 | ||||
| 2025-10-23 | 13F | Spire Wealth Management | 0 | -100,00 | 0 | |||||
| 2025-11-05 | 13F | Envestnet Asset Management Inc | 0 | -100,00 | 0 | |||||
| 2026-02-13 | 13F | Barclays Plc | 59.388 | 8,92 | 3.526 | 30,70 | ||||
| 2026-02-13 | 13F | Umb Bank N A/mo | 245 | 63,33 | 15 | 100,00 | ||||
| 2026-02-13 | 13F | BNP Paribas Asset Management Holding S.A. | 515 | 38,07 | 0 | |||||
| 2026-02-17 | 13F | DV Trading LLC | 300 | 18 | ||||||
| 2026-01-20 | 13F | Harbor Capital Advisors, Inc. | 129 | -1,53 | 0 | |||||
| 2026-02-02 | 13F | Fifth Third Bancorp | 196 | 14,62 | 12 | 37,50 | ||||
| 2026-02-12 | 13F | DRW Securities, LLC | 0 | -100,00 | 0 | |||||
| 2026-02-13 | 13F | Bridgewater Associates, LP | 3.548 | 211 | ||||||
| 2026-02-05 | 13F | Amalgamated Bank | 11.551 | 0,87 | 1 | |||||
| 2026-02-13 | 13F | Oakum Bay Capital LLC | 3.100 | 184 | ||||||
| 2026-02-17 | 13F | Engineers Gate Manager LP | 15.541 | 183,23 | 923 | 240,22 | ||||
| 2026-02-06 | 13F | Gsa Capital Partners Llp | 0 | -100,00 | 0 | |||||
| 2026-02-12 | 13F | Ensign Peak Advisors, Inc | 2.974 | -51,83 | 177 | -42,30 | ||||
| 2026-02-17 | 13F | Fmr Llc | 668.473 | -6,87 | 39.687 | 11,74 | ||||
| 2026-02-13 | 13F | Brown Advisory Inc | 6.182 | -0,37 | 367 | 19,54 | ||||
| 2026-02-13 | 13F | Charles Schwab Investment Management Inc | 364.009 | 0,83 | 21.611 | 20,99 | ||||
| 2026-01-14 | 13F | Jfs Wealth Advisors, Llc | 36 | 44,00 | 2 | 100,00 | ||||
| 2026-02-06 | 13F | Bare Financial Services, Inc | 108 | 27,06 | 6 | 50,00 | ||||
| 2026-04-08 | 13F | DiNuzzo Private Wealth, Inc. | 9 | 0,00 | 1 | |||||
| 2026-01-15 | 13F | Nisa Investment Advisors, Llc | 709 | 11,30 | 42 | 35,48 | ||||
| 2026-02-17 | 13F | XTX Topco Ltd | 12.465 | 740 | ||||||
| 2026-02-06 | 13F | Larson Financial Group LLC | 9 | 1 | ||||||
| 2026-02-11 | 13F | Deutsche Bank Ag\ | 50.373 | 70,69 | 2.991 | 104,79 | ||||
| 2026-02-11 | 13F | Viewpoint Capital Management LLC | 8.384 | 0,00 | 498 | 20,05 | ||||
| 2026-02-13 | 13F | Walleye Trading LLC | 0 | -100,00 | 0 | |||||
| 2026-02-17 | 13F | Aster Capital Management (DIFC) Ltd | 110 | 7 | ||||||
| 2026-02-13 | 13F | Walleye Trading LLC | Put | 0 | -100,00 | 0 | ||||
| 2026-02-12 | 13F | CIBC Private Wealth Group, LLC | 9 | 1 | ||||||
| 2025-11-14 | 13F | Wetherby Asset Management Inc | 5.701 | 0,00 | 282 | 4,06 | ||||
| 2026-02-12 | 13F | Ankerstar Wealth, LLC | 4 | 0 | ||||||
| 2026-02-13 | 13F | Centiva Capital, LP | 0 | -100,00 | 0 | |||||
| 2026-02-17 | 13F | Royal Bank Of Canada | 50.146 | 94,46 | 2.976 | 133,23 | ||||
| 2026-02-09 | 13F | Keating Financial Advisory Services, Inc. | 28 | 2 | ||||||
| 2026-02-13 | 13F | Mariner, LLC | 4.360 | -27,42 | 259 | -12,79 | ||||
| 2026-02-17 | 13F | Millennium Management Llc | 15.360 | 31,19 | 912 | 57,34 | ||||
| 2026-02-02 | 13F | Principal Financial Group Inc | 190.434 | -1,36 | 11.306 | 18,36 | ||||
| 2026-02-06 | 13F | HighTower Advisors, LLC | 3.476 | 206 | ||||||
| 2026-02-17 | 13F | CWM Advisors, LLC | 8.754 | -4,92 | 520 | 14,07 | ||||
| 2026-02-17 | 13F | Bank Of America Corp /de/ | 238.929 | 11,64 | 14.185 | 33,96 | ||||
| 2026-02-04 | 13F | Schwartz Investment Counsel Inc | 310.400 | -7,45 | 18.428 | 11,05 | ||||
| 2026-02-17 | 13F | California State Teachers Retirement System | 35.544 | -5,49 | 2.110 | 13,44 | ||||
| 2026-01-09 | 13F | SG Americas Securities, LLC | 38.860 | 138,21 | 2 | |||||
| 2026-02-17 | 13F | Citadel Advisors Llc | Call | 61.600 | 61,68 | 3.657 | 94,01 | |||
| 2026-03-12 | 13F/A | Peak6 Llc | Call | 0 | -100,00 | 0 | -100,00 | |||
| 2026-02-06 | 13F | Mraz, Amerine & Associates, Inc. | 50.127 | -0,83 | 2.976 | 18,99 | ||||
| 2026-02-17 | 13F | Citadel Advisors Llc | 45.461 | 28,45 | 2.699 | 54,14 | ||||
| 2026-02-17 | 13F | Lazard Asset Management Llc | 28.092 | 3,76 | 1.668 | 24,50 | ||||
| 2026-02-17 | 13F | Citadel Advisors Llc | Put | 10.100 | -63,41 | 600 | -56,12 | |||
| 2026-03-12 | 13F/A | Peak6 Llc | Put | 0 | -100,00 | 0 | -100,00 | |||
| 2026-01-22 | 13F | Financial Consulate, Inc | 625 | 0,00 | 37 | 23,33 | ||||
| 2026-02-17 | 13F | ExodusPoint Capital Management, LP | 0 | -100,00 | 0 | -100,00 | ||||
| 2026-02-11 | 13F | Manchester Capital Management LLC | 0 | -100,00 | 0 | -100,00 | ||||
| 2026-02-17 | 13F | Select Equity Group, L.P. | 1.181.452 | 15,42 | 70.143 | 38,49 | ||||
| 2026-02-13 | 13F | Cordoba Advisory Partners LLC | 4.472 | 266 | ||||||
| 2026-02-04 | 13F | Oregon Public Employees Retirement Fund | 9.150 | 1,10 | 543 | 21,48 | ||||
| 2026-02-11 | 13F | Cerity Partners LLC | 4.466 | 265 | ||||||
| 2026-02-13 | 13F | Colony Group, LLC | 5.299 | 14,30 | 315 | 37,12 | ||||
| 2026-02-10 | 13F | Goldman Sachs Group Inc | 189.208 | -32,05 | 11.233 | -18,47 | ||||
| 2026-02-12 | 13F | Skopos Labs, Inc. | 5.672 | 337 | ||||||
| 2026-02-05 | 13F | High Note Wealth, LLC | 69 | -18,82 | 4 | 0,00 | ||||
| 2025-11-14 | 13F | Wolverine Trading, Llc | Put | 0 | -100,00 | 0 | -100,00 | |||
| 2026-02-13 | 13F | Transamerica Financial Advisors, Inc. | 3 | 0 | ||||||
| 2026-01-28 | 13F | Arizona State Retirement System | 10.506 | -6,18 | 624 | 12,45 | ||||
| 2026-01-28 | 13F | Salomon & Ludwin, LLC | 318 | 22,78 | 20 | 58,33 | ||||
| 2026-01-28 | 13F | Chicago Partners Investment Group LLC | 5.390 | 0,13 | 344 | 26,47 | ||||
| 2026-02-17 | 13F | Advisory Services Network, LLC | 7.584 | 0,66 | 450 | 20,97 | ||||
| 2026-02-17 | 13F | Mercer Global Advisors Inc /adv | 3.736 | 222 | ||||||
| 2026-02-18 | 13F | State of Tennessee, Treasury Department | 15.148 | 23,57 | 1.003 | 65,35 | ||||
| 2026-02-06 | 13F | Pnc Financial Services Group, Inc. | 2.675 | -5,61 | 159 | 12,86 | ||||
| 2026-02-13 | 13F | Great West Life Assurance Co /can/ | 52.374 | -12,27 | 3 | 50,00 | ||||
| 2026-04-14 | 13F | Prospera Financial Services Inc | 10.400 | -51,56 | 653 | -48,74 | ||||
| 2026-04-07 | 13F | Signaturefd, Llc | 775 | 0,00 | 49 | 4,35 | ||||
| 2026-02-13 | 13F | Edgestream Partners, L.P. | 20.968 | 1.245 | ||||||
| 2025-11-14 | 13F | Brevan Howard Capital Management LP | 0 | -100,00 | 0 | |||||
| 2026-04-13 | 13F | True Wealth Design, LLC | 119 | 0,00 | 7 | 0,00 | ||||
| 2026-02-17 | 13F | Cresset Asset Management, LLC | 4.504 | -0,73 | 267 | 19,20 | ||||
| 2026-02-13 | 13F | Wilkerson Advisory Group LLC | 85 | 5 | ||||||
| 2026-01-26 | 13F | Nations Financial Group Inc, /ia/ /adv | 6.700 | 398 | ||||||
| 2026-02-10 | 13F | Bank of New York Mellon Corp | 310.120 | -7,73 | 18.412 | 10,71 | ||||
| 2026-02-12 | 13F | Renaissance Technologies Llc | 8.900 | 528 | ||||||
| 2026-04-14 | 13F | Bay Harbor Wealth Management, LLC | 8 | 60,00 | 1 | |||||
| 2026-01-29 | 13F | Comerica Bank | 9.387 | -19,69 | 557 | -3,63 | ||||
| 2026-02-17 | 13F | SageView Advisory Group, LLC | 110 | 7 | ||||||
| 2026-04-09 | 13F | Cullen Investment Group, Ltd. | 5.044 | 0,16 | 317 | -1,56 | ||||
| 2026-02-05 | 13F | Thrivent Financial For Lutherans | 27.379 | -5,02 | 2 | 0,00 | ||||
| 2026-01-21 | 13F | SJS Investment Consulting Inc. | 4 | 0,00 | 0 | |||||
| 2026-02-09 | 13F | Hartland & Co., LLC | 0 | -100,00 | 0 | -100,00 | ||||
| 2026-02-12 | 13F | Loomis Sayles & Co L P | 261 | 15 | ||||||
| 2026-02-09 | 13F | Diversified Investment Strategies, LLC | 273.950 | -2,11 | 16.264 | 17,46 | ||||
| 2026-02-17 | 13F | Janus Henderson Group Plc | 139.947 | 668,35 | 8.310 | 822,20 | ||||
| 2026-02-17 | 13F | Two Sigma Advisers, Lp | 31.700 | 18,73 | 1.882 | 42,47 | ||||
| 2025-11-04 | 13F | Winnow Wealth Llc | 0 | -100,00 | 0 | -100,00 | ||||
| 2026-02-13 | 13F | Public Sector Pension Investment Board | 0 | -100,00 | 0 | |||||
| 2026-02-10 | 13F | Commonwealth Of Pennsylvania Public School Empls Retrmt Sys | 9.864 | -3,07 | 586 | 16,30 | ||||
| 2026-04-02 | 13F | Byrne Asset Management LLC | 10.257 | -0,18 | 644 | 5,57 | ||||
| 2026-01-21 | 13F | Yousif Capital Management, Llc | 10.718 | -12,92 | 687 | 12,81 | ||||
| 2026-02-17 | 13F | Dark Forest Capital Management Lp | 42.145 | -19,99 | 2.502 | -3,99 | ||||
| 2026-02-17 | 13F | Price T Rowe Associates Inc /md/ | 45.596 | 5,75 | 3 | 0,00 | ||||
| 2026-02-17 | 13F | Praetorian PR LLC | 660.000 | 0,00 | 39.184 | 19,99 | ||||
| 2026-01-30 | 13F/A | M&t Bank Corp | 3.877 | 230 | ||||||
| 2026-01-14 | 13F | Exchange Traded Concepts, Llc | 1.545 | 92 | ||||||
| 2026-02-03 | 13F | Mitsubishi UFJ Kokusai Asset Management Co., Ltd. | 125 | 0,00 | 7 | 16,67 | ||||
| 2026-02-09 | 13F | Harbour Investments, Inc. | 391 | 0,00 | 23 | 21,05 | ||||
| 2026-02-12 | 13F | Principal Securities, Inc. | 0 | -100,00 | 0 | -100,00 | ||||
| 2026-01-27 | 13F | TD Waterhouse Canada Inc. | 0 | -100,00 | 0 | |||||
| 2026-02-02 | 13F | Horizon Investments, LLC | 27.845 | 1.653 | ||||||
| 2026-02-13 | 13F | MAI Capital Management | 800 | 0,00 | 47 | 20,51 | ||||
| 2026-02-17 | 13F | Corsair Capital Management, L.p. | 20.004 | 33,36 | 1.188 | 59,97 | ||||
| 2026-02-18 | 13F | Beacon Pointe Advisors, LLC | Call | 1.100 | 65 | |||||
| 2026-02-18 | 13F | Beacon Pointe Advisors, LLC | 8.752 | 520 | ||||||
| 2026-02-12 | 13F | MetLife Investment Management, LLC | 21.256 | -6,63 | 1.262 | 11,99 | ||||
| 2026-02-09 | 13F | New Age Alpha Advisors, LLC | 1.839 | 109 | ||||||
| 2026-01-28 | 13F | Teacher Retirement System Of Texas | 0 | -100,00 | 0 | |||||
| 2026-02-10 | 13F | Savant Capital, LLC | 0 | -100,00 | 0 | |||||
| 2026-02-13 | 13F | State Street Corp | 1.430.583 | 1,51 | 84.934 | 21,80 | ||||
| 2026-02-05 | 13F | Bessemer Group Inc | 62.564 | 625,80 | 4 | |||||
| 2026-02-05 | 13F | Gabelli Funds Llc | 600.500 | -2,04 | 35.652 | 17,54 | ||||
| 2026-02-10 | 13F | State of Wyoming | 4.937 | 293 | ||||||
| 2026-02-11 | 13F | Group One Trading, L.p. | Put | 2.100 | 40,00 | 125 | 67,57 | |||
| 2026-02-17 | 13F | PharVision Advisers, LLC | 0 | -100,00 | 0 | |||||
| 2026-02-17 | 13F | Graham Capital Management, L.P. | 3.426 | 203 | ||||||
| 2026-01-30 | 13F | New York State Teachers Retirement System | 9.102 | 0,00 | 1 | |||||
| 2026-02-12 | 13F | Bank Of Montreal /can/ | 16.311 | 13,80 | 968 | 36,53 | ||||
| 2026-02-11 | 13F | Group One Trading, L.p. | Call | 8.800 | 700,00 | 522 | 866,67 | |||
| 2026-02-13 | 13F | Parkside Financial Bank & Trust | 686 | 0,00 | 41 | 21,21 | ||||
| 2026-02-13 | 13F | Berkley W R Corp | 209.542 | 0,00 | 12.441 | 19,98 | ||||
| 2026-02-17 | 13F | Maryland State Retirement & Pension System | 5.852 | 1,88 | 347 | 22,18 | ||||
| 2026-02-13 | 13F | Quarry LP | 75 | -90,45 | 4 | -89,47 | ||||
| 2025-11-13 | 13F | Entropy Technologies, LP | 0 | -100,00 | 0 | |||||
| 2026-02-12 | 13F | Steward Partners Investment Advisory, Llc | 1.870 | -54,02 | 111 | -44,78 | ||||
| 2026-04-08 | 13F | Wealth Enhancement Advisory Services, Llc | 28.644 | 170,61 | 1.866 | 185,76 | ||||
| 2026-02-17 | 13F | Tower Research Capital LLC (TRC) | 6.907 | 335,77 | 410 | 425,64 | ||||
| 2026-01-21 | 13F | Sound Income Strategies, LLC | 141 | 9 | ||||||
| 2026-02-12 | 13F | State Board Of Administration Of Florida Retirement System | 28.880 | 194,75 | 1.715 | 254,13 | ||||
| 2026-02-17 | 13F | Jump Financial, LLC | 20.697 | 1.229 | ||||||
| 2026-02-17 | 13F | Quantinno Capital Management LP | 11.469 | 6,55 | 681 | 27,82 | ||||
| 2026-01-12 | 13F | Rialto Wealth Management, LLC | 4 | 0,00 | 0 | |||||
| 2026-02-12 | 13F | Nuveen, LLC | 131.938 | -0,87 | 7.833 | 18,95 | ||||
| 2026-02-06 | 13F | Handelsbanken Fonder AB | 18.374 | 0,00 | 1 | |||||
| 2026-02-17 | 13F | Voloridge Investment Management, Llc | 37.740 | -35,00 | 2.241 | -22,01 | ||||
| 2026-02-13 | 13F | American Century Companies Inc | 74.414 | 22,39 | 4.418 | 46,84 | ||||
| 2026-02-27 | 13F | Cross Staff Investments Inc | 3.900 | 232 | ||||||
| 2026-04-13 | 13F | IFP Advisors, Inc | 185 | 0,00 | 12 | 10,00 | ||||
| 2026-01-30 | 13F | Oakworth Capital, Inc. | 10.296 | 0,00 | 611 | 20,04 | ||||
| 2026-02-06 | 13F | Covestor Ltd | 25.437 | 7,20 | 2 | 0,00 | ||||
| 2026-01-27 | 13F | Rye Brook Capital LLC | 63.400 | 0,00 | 4 | 0,00 | ||||
| 2026-02-02 | 13F | Nkcfo Llc | 0 | -100,00 | 0 | |||||
| 2026-02-12 | 13F | Hrt Financial Lp | 75.211 | 890,92 | 4 | |||||
| 2026-02-13 | 13F | Pinnacle Wealth Planning Services, Inc. | 1.605 | 95 | ||||||
| 2026-01-29 | 13F | Pictet Asset Management Holding SA | 4.658 | 277 | ||||||
| 2026-02-09 | 13F | Hantz Financial Services, Inc. | 83 | 33,87 | 0 | |||||
| 2026-01-14 | 13F | Pallas Capital Advisors LLC | 3.372 | 200 | ||||||
| 2026-02-09 | 13F | Annis Gardner Whiting Capital Advisors, LLC | 16 | 0,00 | 1 | |||||
| 2026-02-13 | 13F | Healthcare Of Ontario Pension Plan Trust Fund | 48.780 | 2.896 | ||||||
| 2026-01-26 | 13F | Fruth Investment Management | 3.450 | 0 | ||||||
| 2026-02-11 | 13F | Capital Research Global Investors | 823.697 | -11,45 | 48.903 | 6,25 | ||||
| 2025-12-18 | 13F | Danske Bank A/s | 0 | -100,00 | 0 | |||||
| 2026-02-26 | 13F | TD Capital Management LLC | 153 | 0,00 | 9 | 28,57 | ||||
| 2025-11-03 | 13F | Stonegate Investment Group, LLC | 12.122 | -1,31 | 600 | 2,39 | ||||
| 2026-02-11 | 13F | Horizon Kinetics Asset Management Llc | 554.837 | -0,16 | 32.941 | 19,79 | ||||
| 2025-11-13 | 13F | Norges Bank | 0 | -100,00 | 0 | -100,00 | ||||
| 2026-01-28 | 13F | Klp Kapitalforvaltning As | 8.000 | -4,76 | 475 | 14,22 | ||||
| 2026-04-06 | 13F | GAMMA Investing LLC | 2.188 | 26,69 | 137 | 34,31 | ||||
| 2026-02-13 | 13F | Kestra Advisory Services, LLC | 547 | 32 | ||||||
| 2026-02-05 | 13F | Gamco Investors, Inc. Et Al | 629.510 | -0,77 | 37.374 | 19,06 | ||||
| 2026-02-11 | 13F | Parallel Advisors, LLC | 8 | 0 | ||||||
| 2026-02-12 | 13F | BlackRock, Inc. | 6.000.969 | 0,36 | 356.278 | 20,42 | ||||
| 2026-01-29 | 13F | Dunhill Financial, LLC | 2 | 0 | ||||||
| 2025-11-14 | 13F | Squarepoint Ops LLC | 0 | -100,00 | 0 | -100,00 | ||||
| 2025-10-15 | 13F | Stephens Consulting, LLC | 0 | -100,00 | 0 | |||||
| 2025-11-13 | 13F | VSM Wealth Advisory, LLC | 0 | -100,00 | 0 | |||||
| 2025-11-21 | 13F/A | CIBC Bancorp USA Inc. | 4.062 | 201 | ||||||
| 2026-02-03 | 13F | Sequoia Financial Advisors, LLC | 5.534 | 9,48 | 329 | 31,20 | ||||
| 2026-02-17 | 13F | Fund 1 Investments, LLC | 0 | -100,00 | 0 | |||||
| 2025-11-14 | 13F | Verition Fund Management LLC | 0 | -100,00 | 0 | |||||
| 2025-10-30 | 13F | Carmel Capital Partners, LLC | 0 | -100,00 | 0 | -100,00 |