Grundlæggende statistik
| Institutionelle ejere | 159 total, 158 long only, 0 short only, 1 long/short - change of 8,00% MRQ |
| Del pris | 4,18 |
| Gennemsnitlig porteføljeallokering | 0.0913 % - change of -16,61% MRQ |
| Institutionelle aktier (lange) | 67.637.853 (ex 13D/G) - change of 5,52MM shares 8,87% MRQ |
| Institutionel værdi (lang) | $ 253.369 USD ($1000) |
Institutionelt ejerskab og aktionærer
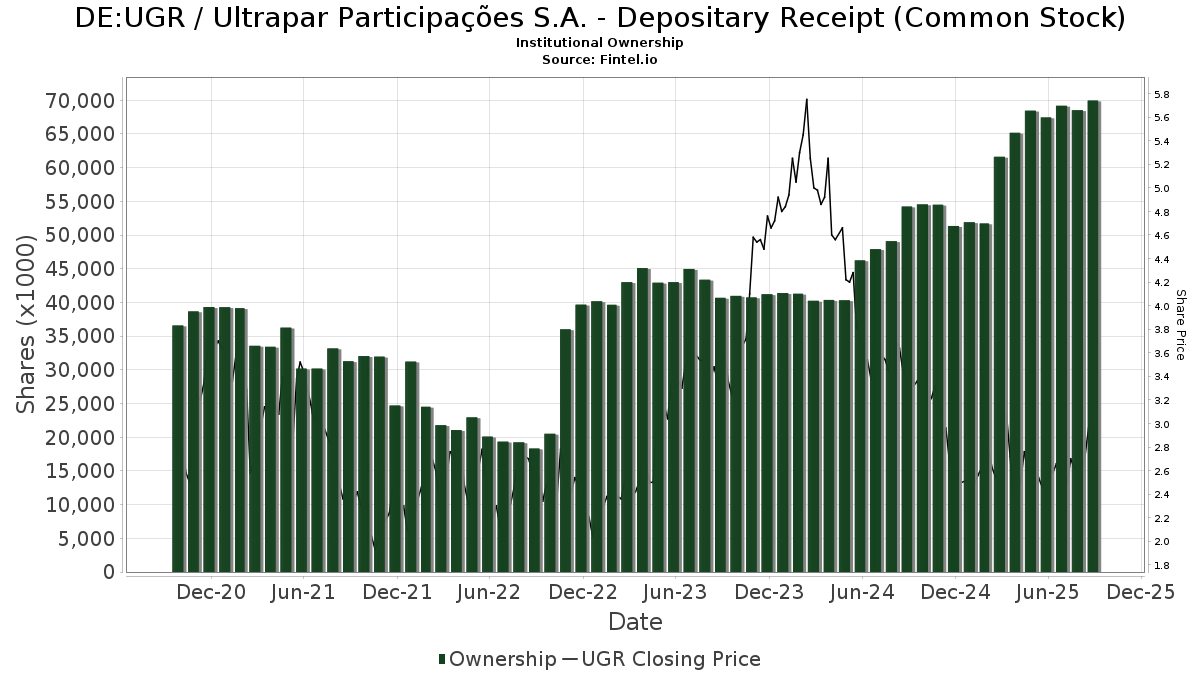
Ultrapar Participações S.A. - Depositary Receipt (Common Stock) (DE:UGR) har 159 institutionelle ejere og aktionærer, der har indsendt 13D/G- eller 13F-formularer til Securities Exchange Commission (SEC). Disse institutioner har i alt 67,637,853 aktier. Største aktionærer omfatter Bizma Investimentos Ltda, Morgan Stanley, Goldman Sachs Group Inc, CIBC Bancorp USA Inc., BlackRock, Inc., Renaissance Technologies Llc, American Century Companies Inc, Jpmorgan Chase & Co, OWSMX - Old Westbury Small & Mid Cap Strategies Fund, and Deutsche Bank Ag\ .
Ultrapar Participações S.A. - Depositary Receipt (Common Stock) (DB:UGR) institutionel ejerskabsstruktur viser aktuelle positioner i virksomheden efter institutioner og fonde, samt seneste ændringer i positionsstørrelse. Større aktionærer kan omfatte individuelle investorer, investeringsforeninger, hedgefonde eller institutioner. Skema 13D angiver, at investoren besidder (eller besidder) mere end 5 % af virksomheden og har til hensigt (eller har til hensigt at) aktivt at forfølge en ændring i forretningsstrategi. Skema 13G indikerer en passiv investering på over 5%.
The share price as of February 27, 2026 is 4,18 / share. Previously, on March 3, 2025, the share price was 2,62 / share. This represents an increase of 59,54% over that period.
Fondens stemningsscore
Fund Sentiment Score (fka Ownership Accumulation Score) finder de aktier, der bliver mest købt af fonde. Det er resultatet af en sofistikeret, multi-faktor kvantitativ model, der identificerer virksomheder med de højeste niveauer af institutionel akkumulering. Scoringsmodellen bruger en kombination af den samlede stigning i oplyste ejere, ændringerne i porteføljeallokeringer i disse ejere og andre målinger. Tallet går fra 0 til 100, hvor højere tal indikerer et højere niveau af akkumulering for sine jævnaldrende, og 50 er gennemsnittet.
Opdateringsfrekvens: Dagligt
Se Ownership Explorer, som giver en liste over højest rangerende virksomheder.
AI+ Ask Fintel’s AI assistant about Ultrapar Participações S.A. - Depositary Receipt (Common Stock).
Select a question to share a public post with an AI-crafted answer.
Thinking of good questions…
13F og NPORT arkivering
Detaljer om 13F-arkivering er gratis. Detaljer om NP-ansøgninger kræver et premium-medlemskab. Grønne rækker angiver nye positioner. Røde rækker angiver lukkede positioner. Klik på linket ikon for at se den fulde transaktionshistorik.
Opgrader
for at låse premium-data op og eksportere til Excel ![]() .
.
| Fil dato | Kilde | Investor | Type | Gennemsnitlig pris (Øst) |
Aktier | Δ Aktier (%) |
Rapporteret Værdi ($1000) |
Δ Værdi (%) |
Port Alloc (%) |
|
|---|---|---|---|---|---|---|---|---|---|---|
| 2026-02-10 | 13F | Sivia Capital Partners, LLC | 22.136 | 1,88 | 83 | -6,74 | ||||
| 2026-02-17 | 13F | Optiver Holding B.V. | 440.252 | 16,28 | 1.660 | 6,89 | ||||
| 2026-02-10 | 13F | Envestnet Asset Management Inc | 32.679 | -3,89 | 123 | -11,51 | ||||
| 2026-02-13 | 13F | Manufacturers Life Insurance Company, The | 0 | -100,00 | 0 | |||||
| 2026-01-05 | 13F | GAMMA Investing LLC | 16.377 | 2,33 | 62 | -6,15 | ||||
| 2025-11-14 | 13F | Point72 (DIFC) Ltd | 12.224 | 50 | ||||||
| 2026-02-10 | 13F | Connor, Clark & Lunn Investment Management Ltd. | 196.895 | 1.667,30 | 742 | 1.548,89 | ||||
| 2026-01-28 | 13F | Kapitalo Investimentos Ltda | 874.882 | 350,74 | 3.298 | 314,84 | ||||
| 2026-02-06 | 13F | IFP Advisors, Inc | 330 | 0,00 | 1 | 0,00 | ||||
| 2026-02-17 | 13F | Clear Street Markets Llc | 0 | -100,00 | 0 | |||||
| 2026-02-13 | 13F | State Street Corp | 249.883 | 18,97 | 942 | 9,41 | ||||
| 2025-09-26 | NP | UBPIX - Ultralatin America Profund Investor Class | 16.418 | 14,08 | 50 | 11,11 | ||||
| 2025-11-14 | 13F | Sofos Investments, Inc. | 0 | -100,00 | 0 | |||||
| 2026-01-30 | 13F | Ares Financial Consulting, LLC | 224 | 1 | ||||||
| 2025-11-13 | 13F | Mackenzie Financial Corp | 0 | -100,00 | 0 | |||||
| 2026-02-11 | 13F | Jpmorgan Chase & Co | 2.744.442 | -32,80 | 10.347 | -38,21 | ||||
| 2026-02-17 | 13F | Wellington Management Group Llp | 563.060 | -3,69 | 2.123 | -11,47 | ||||
| 2026-02-17 | 13F | Point72 Asset Management, L.P. | 596.782 | 106,21 | 2.250 | 89,63 | ||||
| 2026-02-17 | 13F | CWM Advisors, LLC | 20.725 | -1,93 | 78 | -9,30 | ||||
| 2026-02-11 | 13F | Deutsche Bank Ag\ | 2.147.914 | 42.357,28 | 8.098 | 40.385,00 | ||||
| 2026-01-23 | 13F | Assetmark, Inc | 639 | -31,88 | 2 | -33,33 | ||||
| 2026-01-26 | 13F | PDS Planning, Inc | 28.286 | 0,27 | 107 | -7,83 | ||||
| 2026-02-06 | 13F | Banque Cantonale Vaudoise | 300.000 | 1.131 | ||||||
| 2026-02-17 | 13F | Magnetar Financial LLC | 22.783 | 86 | ||||||
| 2026-02-17 | 13F | Engineers Gate Manager LP | 12.699 | -72,18 | 48 | -74,87 | ||||
| 2026-02-17 | 13F | Scientech Research LLC | 15.312 | 58 | ||||||
| 2026-02-13 | 13F | Citigroup Inc | 49.019 | -5,72 | 185 | -13,62 | ||||
| 2026-02-10 | 13F | Greenspring Advisors, LLC | 15.548 | 59 | ||||||
| 2026-02-13 | 13F | Y-Intercept (Hong Kong) Ltd | 0 | -100,00 | 0 | |||||
| 2026-02-13 | 13F | Barclays Plc | 0 | -100,00 | 0 | |||||
| 2026-01-20 | 13F | Signaturefd, Llc | 33.774 | 17,71 | 127 | 8,55 | ||||
| 2025-11-12 | 13F | CIBC Bancorp USA Inc. | 3.570.400 | 14.639 | ||||||
| 2026-02-17 | 13F | Guggenheim Capital Llc | 94.021 | 33,27 | 354 | 22,49 | ||||
| 2026-01-12 | 13F | Abound Wealth Management | 0 | -100,00 | 0 | |||||
| 2026-02-13 | 13F | Inspire Advisors, LLC | 35.163 | -14,09 | 133 | -20,96 | ||||
| 2026-02-13 | 13F | JustInvest LLC | 106.530 | 12,31 | 402 | 3,35 | ||||
| 2025-09-25 | NP | DFA INVESTMENT DIMENSIONS GROUP INC - Emerging Markets Sustainability Core 1 Portfolio Institutional Class This fund is a listed as child fund of Dimensional Fund Advisors Lp and if that institution has disclosed ownership in this security, then these positions will not be double counted when calculating total shares and total value | 55.886 | 0,00 | 171 | -2,84 | ||||
| 2025-10-07 | 13F | Polunin Capital Partners Ltd | 0 | -100,00 | 0 | |||||
| 2026-02-10 | 13F | Bnp Paribas Arbitrage, Sa | 120.087 | 1,63 | 453 | -6,61 | ||||
| 2025-10-17 | 13F | Regatta Capital Group, Llc | 0 | -100,00 | 0 | -100,00 | ||||
| 2026-02-12 | 13F | BlackRock, Inc. | 3.569.144 | -8,54 | 13.456 | -15,91 | ||||
| 2026-02-12 | 13F | Jane Street Group, Llc | 1.150.919 | 167,20 | 4.339 | 145,64 | ||||
| 2026-02-13 | 13F | Squarepoint Ops LLC | 15.696 | -62,65 | 59 | -65,70 | ||||
| 2026-02-12 | 13F | Bank Of Montreal /can/ | 1.824.000 | 6.876 | ||||||
| 2025-09-25 | NP | DFEV - Dimensional Emerging Markets Value ETF | 59.695 | 0,00 | 183 | -3,19 | ||||
| 2026-02-13 | 13F | Wells Fargo & Company/mn | 291.168 | 4.433,91 | 1.098 | 4.119,23 | ||||
| 2025-11-14 | 13F | Susquehanna International Group, Llp | 0 | -100,00 | 0 | |||||
| 2026-02-11 | 13F | Cerity Partners LLC | 79.600 | 25,70 | 300 | 15,83 | ||||
| 2026-02-11 | 13F | Longfellow Investment Management Co Llc | 534.513 | -13,28 | 2.015 | -20,26 | ||||
| 2026-02-17 | 13F/A | RBF Capital, LLC | 55.229 | 0,00 | 208 | -7,96 | ||||
| 2025-11-14 | 13F | Cubist Systematic Strategies, LLC | 470.768 | 41,24 | 1.930 | 76,58 | ||||
| 2025-11-14 | 13F | National Bank Of Canada /fi/ | 0 | -100,00 | 0 | |||||
| 2026-02-10 | 13F | Acadian Asset Management Llc | 253.830 | -76,02 | 1 | -100,00 | ||||
| 2026-02-13 | 13F | Ieq Capital, Llc | 33.648 | -2,49 | 127 | -10,64 | ||||
| 2026-02-13 | 13F | Caitong International Asset Management Co., Ltd | 8.548 | 32 | ||||||
| 2026-01-14 | 13F | Jfs Wealth Advisors, Llc | 253 | 0,00 | 1 | -100,00 | ||||
| 2026-01-29 | 13F | Aprio Wealth Management, LLC | 28.817 | -5,29 | 109 | -12,90 | ||||
| 2025-09-25 | NP | DFSE - Dimensional Emerging Markets Sustainability Core 1 ETF | 50.602 | 0,00 | 155 | -3,14 | ||||
| 2026-01-28 | 13F | CAPROCK Group, Inc. | 10.744 | 41 | ||||||
| 2026-02-17 | 13F | TCG Advisory Services, LLC | 14.341 | -4,62 | 54 | -11,48 | ||||
| 2025-11-13 | 13F | Quadrature Capital Ltd | 0 | -100,00 | 0 | |||||
| 2026-02-06 | 13F | EverSource Wealth Advisors, LLC | 4.401 | 57,91 | 17 | 45,45 | ||||
| 2026-02-12 | 13F | Renaissance Technologies Llc | 3.382.778 | 31,34 | 12.753 | 20,78 | ||||
| 2026-02-11 | 13F | Parallel Advisors, LLC | 21.790 | 4,57 | 82 | -3,53 | ||||
| 2026-02-13 | 13F | Rhumbline Advisers | 154.968 | -10,90 | 584 | -18,09 | ||||
| 2026-02-13 | 13F | Walleye Capital LLC | 83.745 | 316 | ||||||
| 2026-02-17 | 13F | Voleon Capital Management Lp | 0 | -100,00 | 0 | |||||
| 2026-02-17 | 13F | Two Sigma Advisers, Lp | 112.900 | -30,91 | 426 | -36,47 | ||||
| 2026-02-12 | 13F | Dimensional Fund Advisors Lp | 662.738 | 19,95 | 2.499 | 10,29 | ||||
| 2026-02-17 | 13F | Northern Trust Corp | 164.313 | 2,40 | 619 | -5,78 | ||||
| 2026-02-05 | 13F | Bessemer Group Inc | 735 | 0 | ||||||
| 2025-11-10 | 13F | MAI Capital Management | 0 | -100,00 | 0 | |||||
| 2026-02-17 | 13F | Advisor Group Holdings, Inc. | 142 | -95,46 | 1 | -100,00 | ||||
| 2025-09-26 | NP | OWSMX - Old Westbury Small & Mid Cap Strategies Fund | 2.310.064 | 33,60 | 7.069 | 29,78 | ||||
| 2026-02-17 | 13F | Bizma Investimentos Ltda | 13.687.979 | -2,78 | 51.604 | -10,61 | ||||
| 2026-02-13 | 13F | SRS Capital Advisors, Inc. | 3.870 | 15 | ||||||
| 2025-11-07 | 13F | Sierra Ocean, Llc | 0 | -100,00 | 0 | |||||
| 2026-02-13 | 13F | Laurion Capital Management LP | 0 | -100,00 | 0 | |||||
| 2026-01-29 | 13F | UBS Group AG | 1.876.765 | -35,06 | 7.075 | -40,29 | ||||
| 2026-02-09 | 13F | Prospera Financial Services Inc | 187.807 | 708 | ||||||
| 2026-02-13 | 13F | Smartleaf Asset Management LLC | 2.608 | 0,00 | 10 | -10,00 | ||||
| 2025-09-25 | NP | DFAX - Dimensional World ex U.S. Core Equity 2 ETF | 180.861 | 107,54 | 553 | 101,82 | ||||
| 2026-02-11 | 13F | West Family Investments, Inc. | 33.240 | 0,00 | 125 | -8,09 | ||||
| 2025-11-14 | 13F | Point72 Asia (Singapore) Pte. Ltd. | 15.621 | 64 | ||||||
| 2026-02-13 | 13F | American Century Companies Inc | 3.049.669 | 9,50 | 11.497 | 0,68 | ||||
| 2026-02-06 | 13F | Profund Advisors Llc | 18.184 | 32,34 | 69 | 21,43 | ||||
| 2025-10-22 | 13F | Geneos Wealth Management Inc. | 0 | -100,00 | 0 | |||||
| 2025-11-06 | 13F | Wealthstream Advisors, Inc. | 14.955 | 6,51 | 61 | 32,61 | ||||
| 2026-01-26 | 13F | Cwm, Llc | 10.213 | -2,33 | 0 | |||||
| 2025-11-13 | 13F | EntryPoint Capital, LLC | 0 | -100,00 | 0 | |||||
| 2026-01-08 | 13F | True Wealth Design, LLC | 59 | 3,51 | 0 | |||||
| 2026-02-17 | 13F | Boothbay Fund Management, Llc | 12.379 | 47 | ||||||
| 2026-02-03 | 13F | Ballentine Partners, LLC | 10.516 | 0,00 | 40 | -9,30 | ||||
| 2026-02-10 | 13F/A | Northwestern Mutual Wealth Management Co | 1.739 | 14,63 | 7 | 0,00 | ||||
| 2026-02-10 | 13F | Eurizon Capital SGR S.p.A. | 869 | 3 | ||||||
| 2026-02-13 | 13F | Pinnacle Wealth Planning Services, Inc. | 3.732 | 14 | ||||||
| 2026-02-12 | 13F | Advisors Asset Management, Inc. | 125.338 | -5,40 | 473 | -13,08 | ||||
| 2026-02-13 | 13F | Ausdal Financial Partners, Inc. | 17.159 | 65 | ||||||
| 2026-01-23 | 13F | Robeco Institutional Asset Management B.V. | 19.234 | 73 | ||||||
| 2025-11-14 | 13F | Axa S.a. | 0 | -100,00 | 0 | |||||
| 2026-02-02 | 13F | Qrg Capital Management, Inc. | 53.189 | 201 | ||||||
| 2026-01-27 | 13F | WealthCollab, LLC | 1.534 | 39,84 | 6 | 25,00 | ||||
| 2026-02-05 | 13F | Allworth Financial LP | 2.920 | -4,14 | 11 | -8,33 | ||||
| 2026-01-30 | 13F | Us Bancorp \de\ | 16.872 | -6,73 | 64 | -14,86 | ||||
| 2026-01-26 | 13F | PFG Investments, LLC | 16.300 | 61 | ||||||
| 2026-02-17 | 13F | GeoWealth Management, LLC | 11.796 | 44 | ||||||
| 2025-11-14 | 13F | Aigen Investment Management, Lp | 0 | -100,00 | 0 | |||||
| 2026-02-09 | 13F | Legal & General Group Plc | 135.500 | 0,00 | 512 | -7,76 | ||||
| 2025-10-14 | 13F | Trust Co Of Vermont | 0 | -100,00 | 0 | |||||
| 2026-02-13 | 13F | Ubs Asset Management Americas Inc | 540 | 2 | ||||||
| 2025-11-14 | 13F | Skopos Labs, Inc. | 0 | -100,00 | 0 | |||||
| 2026-02-19 | 13F | Invesco Ltd. | 255.013 | 16,31 | 961 | 7,02 | ||||
| 2026-02-12 | 13F | Banco BTG Pactual S.A. | 697.900 | 2.631 | ||||||
| 2026-02-13 | 13F | Pathstone Holdings, LLC | 37.308 | 7,27 | 141 | -1,41 | ||||
| 2026-02-13 | 13F | Centiva Capital, LP | 60.963 | 121,42 | 230 | 104,46 | ||||
| 2026-02-17 | 13F | Citadel Advisors Llc | 52.064 | -85,79 | 196 | -86,94 | ||||
| 2026-01-14 | 13F | Hennion & Walsh Asset Management, Inc. | 15.397 | 58 | ||||||
| 2026-02-17 | 13F | Citadel Advisors Llc | Put | 49.900 | -0,60 | 188 | -8,29 | |||
| 2026-02-11 | 13F | Group One Trading, L.p. | 100 | 0 | ||||||
| 2026-01-23 | 13F | Ritholtz Wealth Management | 177.022 | -1,74 | 667 | -9,62 | ||||
| 2026-02-11 | 13F | Group One Trading, L.p. | Call | 4.800 | 84,62 | 18 | 80,00 | |||
| 2026-01-30 | 13F | R Squared Ltd | 0 | -100,00 | 0 | |||||
| 2026-02-17 | 13F | Millennium Management Llc | 1.610.338 | -42,42 | 6.071 | -47,06 | ||||
| 2026-02-03 | 13F | Sequoia Financial Advisors, LLC | 63.023 | 9,30 | 238 | 0,42 | ||||
| 2026-02-17 | 13F | Royal Bank Of Canada | 4.666 | 693,54 | 18 | 800,00 | ||||
| 2025-09-25 | NP | DEXC - Dimensional Emerging Markets ex China Core Equity ETF | 32.100 | 27,38 | 98 | 24,05 | ||||
| 2026-02-12 | 13F | Raiffeisen Bank International AG | 0 | -100,00 | 0 | |||||
| 2026-01-16 | 13F | Beaumont Financial Advisors, LLC | 20.920 | 0,00 | 79 | -8,24 | ||||
| 2026-02-09 | 13F | Catalyst Funds Management Pty Ltd | 0 | -100,00 | 0 | |||||
| 2026-02-12 | 13F | Hrt Financial Lp | 0 | -100,00 | 0 | |||||
| 2025-11-14 | 13F | Wetherby Asset Management Inc | 37.697 | -22,40 | 155 | -3,14 | ||||
| 2026-01-29 | 13F | UMA Financial Services, Inc. | 236 | 0,00 | 1 | |||||
| 2026-02-17 | 13F | Bank Of America Corp /de/ | 1.832.496 | 3.019,04 | 6.909 | 2.778,33 | ||||
| 2026-02-11 | 13F | Simplex Trading, Llc | 433 | -83,83 | 2 | |||||
| 2026-02-09 | 13F | Hantz Financial Services, Inc. | 4.372 | 114,63 | 0 | |||||
| 2026-02-19 | 13F | CI Private Wealth, LLC | 62.118 | 0,93 | 234 | -7,14 | ||||
| 2025-09-25 | NP | DFCEX - Emerging Markets Core Equity Portfolio - Institutional Class This fund is a listed as child fund of Dimensional Fund Advisors Lp and if that institution has disclosed ownership in this security, then these positions will not be double counted when calculating total shares and total value | 12.552 | 0,00 | 38 | -2,56 | ||||
| 2026-02-03 | 13F | Ethic Inc. | 70.352 | 63,70 | 265 | 50,57 | ||||
| 2026-02-10 | 13F | Goldman Sachs Group Inc | 4.214.612 | 98,17 | 15.889 | 82,23 | ||||
| 2026-02-06 | 13F | Pnc Financial Services Group, Inc. | 75.092 | -0,16 | 283 | -8,12 | ||||
| 2026-02-17 | 13F | Balyasny Asset Management Llc | 225.270 | 24,41 | 849 | 14,42 | ||||
| 2026-02-13 | 13F | Mariner, LLC | 118.358 | 4,53 | 447 | -3,88 | ||||
| 2026-02-17 | 13F | Qube Research & Technologies Ltd | 1.064.526 | 382,21 | 4.013 | 343,43 | ||||
| 2026-02-17 | 13F | Creative Planning | 351.390 | 5,30 | 1.325 | -3,22 | ||||
| 2026-02-17 | 13F | Fmr Llc | 31.185 | -9,46 | 118 | -17,02 | ||||
| 2026-01-21 | 13F | Yousif Capital Management, Llc | 17.210 | 0,00 | 72 | 1,43 | ||||
| 2026-02-19 | 13F | Atomi Financial Group, Inc. | 161.337 | 745,32 | 608 | 679,49 | ||||
| 2025-10-15 | 13F | Private Trust Co Na | 0 | -100,00 | 0 | |||||
| 2026-02-17 | 13F | Public Employees Retirement System Of Ohio | 44.534 | 3.014,27 | 168 | 3.240,00 | ||||
| 2026-02-12 | 13F | Quadrant Capital Group Llc | 22.550 | 1,08 | 85 | -6,59 | ||||
| 2026-02-06 | 13F | Plan A Wealth LLC | 13.993 | -0,45 | 53 | -8,77 | ||||
| 2026-02-24 | 13F | Bell Investment Advisors, Inc | 342 | 1 | ||||||
| 2026-02-13 | 13F | Marshall Wace, Llp | 0 | -100,00 | 0 | |||||
| 2026-02-13 | 13F | VPR Management LLC | 46.700 | 0,00 | 176 | -7,85 | ||||
| 2026-02-11 | 13F | Simplex Trading, Llc | Put | 0 | -100,00 | 0 | ||||
| 2026-01-08 | 13F | Tuttle Tactical Management LLC | 20.767 | 78 | ||||||
| 2026-02-12 | 13F | Brinker Capital Investments, LLC | 16.737 | 0,13 | 63 | -7,35 | ||||
| 2025-11-14 | 13F | AXA Investment Managers S.A. | 14.619 | 60 | ||||||
| 2025-09-26 | NP | RTXAX - Tax-Managed Real Assets Fund Class A | 69.292 | 0,00 | 212 | -2,75 | ||||
| 2025-11-04 | 13F | Principal Financial Group Inc | 0 | -100,00 | 0 | |||||
| 2026-01-23 | 13F | Farther Finance Advisors, LLC | 6.840 | 18,77 | 26 | 8,70 | ||||
| 2026-02-13 | 13F | SPX Equities Gestao de Recursos Ltda | 582.585 | 2.613,61 | 2.196 | 2.395,45 | ||||
| 2026-02-14 | 13F | Rockefeller Capital Management L.P. | 140 | 4,48 | 1 | |||||
| 2025-09-25 | NP | DFAE - Dimensional Emerging Core Equity Market ETF | 57.684 | 9,70 | 177 | 6,67 | ||||
| 2026-02-17 | 13F | Aqr Capital Management Llc | 64.594 | 24,63 | 244 | 14,62 | ||||
| 2026-02-17 | 13F | Russell Investments Group, Ltd. | 69.292 | 0,00 | 261 | -8,10 | ||||
| 2025-09-25 | NP | DFEM - Dimensional Emerging Markets Core Equity 2 ETF | 42.882 | 0,00 | 131 | -2,96 | ||||
| 2026-02-17 | 13F | Graham Capital Management, L.P. | 16.443 | 62 | ||||||
| 2026-02-17 | 13F | Tower Research Capital LLC (TRC) | 980 | 4 | ||||||
| 2026-02-09 | 13F | Bleakley Financial Group, LLC | 189.528 | -4,23 | 715 | -11,96 | ||||
| 2026-02-17 | 13F | Parvin Asset Management, LLC | 166.400 | 627 | ||||||
| 2026-02-11 | 13F | IMA Wealth, Inc. | 160 | 1 | ||||||
| 2026-02-11 | 13F | Franklin Resources Inc | 19.210 | 32,28 | 72 | 22,03 | ||||
| 2025-11-14 | 13F | Virtu Financial LLC | 0 | -100,00 | 0 | |||||
| 2026-02-13 | 13F | Sei Investments Co | 79.397 | 4,07 | 299 | -4,17 | ||||
| 2026-02-13 | 13F | Morgan Stanley | 4.947.134 | -19,92 | 18.651 | -26,37 | ||||
| 2025-11-13 | 13F | Hsbc Holdings Plc | 403.243 | 9,77 | 1.653 | 37,41 | ||||
| 2026-02-11 | 13F | O'shaughnessy Asset Management, Llc | 342.978 | 7,49 | 1.293 | -1,15 | ||||
| 2026-02-13 | 13F | Arrowstreet Capital, Limited Partnership | 276.228 | 1.041 | ||||||
| 2026-02-17 | 13F | XTX Topco Ltd | 122.561 | 462 | ||||||
| 2026-02-17 | 13F | PharVision Advisers, LLC | 51.880 | 82,79 | 196 | 68,10 | ||||
| 2026-02-06 | 13F | Global Retirement Partners, LLC | 4.300 | 255,67 | 16 | 300,00 | ||||
| 2026-02-10 | 13F | Capital Innovations LLC | 405.382 | 1.528 | ||||||
| 2026-01-16 | 13F | Ronald Blue Trust, Inc. | 27.693 | -16,87 | 104 | -23,53 | ||||
| 2026-02-17 | 13F | Laird Norton Trust Company, Llc | 88.988 | 335 | ||||||
| 2026-02-17 | 13F | Schonfeld Strategic Advisors LLC | 111.972 | 810,34 | 422 | 744,00 | ||||
| 2026-02-18 | 13F | EP Wealth Advisors, Inc. | 11.804 | 45 | ||||||
| 2025-11-06 | 13F | Metis Global Partners, LLC | 0 | -100,00 | 0 | |||||
| 2026-01-09 | 13F | SG Americas Securities, LLC | 11.789 | 0 | ||||||
| 2026-02-03 | 13F/A | Mount Yale Investment Advisors, LLC | 0 | -100,00 | 0 | -100,00 | ||||
| 2026-01-30 | 13F | Mitsubishi UFJ Trust & Banking Corp | 13.622 | -6,84 | 51 | -13,56 | ||||
| 2025-11-04 | 13F | Frank, Rimerman Advisors LLC | 0 | -100,00 | 0 | |||||
| 2026-02-17 | 13F | Two Sigma Investments, Lp | 454.111 | -44,46 | 1.712 | -48,96 | ||||
| 2026-01-26 | 13F | Mirae Asset Global Investments Co., Ltd. | 37.647 | 3,98 | 142 | -4,73 | ||||
| 2026-02-18 | 13F | Vident Advisory, LLC | 286.333 | 4,16 | 1.079 | -4,26 |
Other Listings
| US:UGP | 5,05 $ |