Grundlæggende statistik
| Institutionelle aktier (lange) | 216.213.784 - 72,73% (ex 13D/G) - change of -10,64MM shares -4,69% MRQ |
| Institutionel værdi (lang) | $ 2.733.566 USD ($1000) |
Institutionelt ejerskab og aktionærer
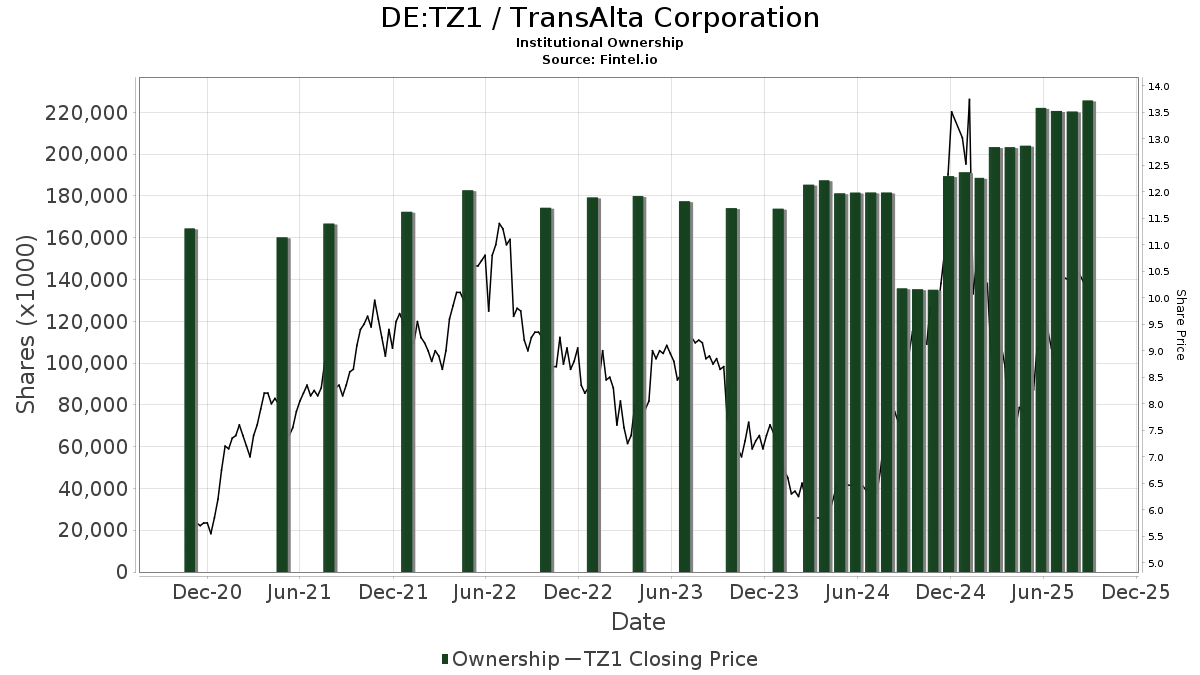
TransAlta Corporation (DE:TZ1) har 175 institutionelle ejere og aktionærer, der har indsendt 13D/G- eller 13F-formularer til Securities Exchange Commission (SEC). Disse institutioner har i alt 216,213,784 aktier. Største aktionærer omfatter Brookfield Asset Management Inc., Royal Bank Of Canada, Fmr Llc, Rubric Capital Management LP, Bank Of Montreal /can/, Vanguard Group Inc, Bank Of America Corp /de/, Millennium Management Llc, Oaktree Capital Management Lp, and American Century Companies Inc .
TransAlta Corporation (DB:TZ1) institutionel ejerskabsstruktur viser aktuelle positioner i virksomheden efter institutioner og fonde, samt seneste ændringer i positionsstørrelse. Større aktionærer kan omfatte individuelle investorer, investeringsforeninger, hedgefonde eller institutioner. Skema 13D angiver, at investoren besidder (eller besidder) mere end 5 % af virksomheden og har til hensigt (eller har til hensigt at) aktivt at forfølge en ændring i forretningsstrategi. Skema 13G indikerer en passiv investering på over 5%.
The share price as of April 30, 2026 is 10,22 / share. Previously, on May 5, 2025, the share price was 8,09 / share. This represents an increase of 26,27% over that period.
Fondens stemningsscore
Fund Sentiment Score (fka Ownership Accumulation Score) finder de aktier, der bliver mest købt af fonde. Det er resultatet af en sofistikeret, multi-faktor kvantitativ model, der identificerer virksomheder med de højeste niveauer af institutionel akkumulering. Scoringsmodellen bruger en kombination af den samlede stigning i oplyste ejere, ændringerne i porteføljeallokeringer i disse ejere og andre målinger. Tallet går fra 0 til 100, hvor højere tal indikerer et højere niveau af akkumulering for sine jævnaldrende, og 50 er gennemsnittet.
Opdateringsfrekvens: Dagligt
Se Ownership Explorer, som giver en liste over højest rangerende virksomheder.
AI+ Ask Fintel’s AI assistant about TransAlta Corporation.
Select a question to share a public post with an AI-crafted answer.
Thinking of good questions…
13F og NPORT arkivering
Detaljer om 13F-arkivering er gratis. Detaljer om NP-ansøgninger kræver et premium-medlemskab. Grønne rækker angiver nye positioner. Røde rækker angiver lukkede positioner. Klik på linket ikon for at se den fulde transaktionshistorik.
Opgrader
for at låse premium-data op og eksportere til Excel ![]() .
.
| Fil dato | Kilde | Investor | Type | Gennemsnitlig pris (Øst) |
Aktier | Δ Aktier (%) |
Rapporteret Værdi ($1000) |
Δ Værdi (%) |
Port Alloc (%) |
|
|---|---|---|---|---|---|---|---|---|---|---|
| 2026-02-09 | 13F | Waratah Capital Advisors Ltd. | 0 | -100,00 | 0 | |||||
| 2026-02-13 | 13F | Entropy Technologies, LP | 23.977 | 303 | ||||||
| 2026-02-17 | 13F | Raymond James Financial Inc | 65.184 | 4,34 | 824 | -3,52 | ||||
| 2025-11-14 | 13F | Wellington Management Group Llp | 0 | -100,00 | 0 | |||||
| 2026-04-24 | 13F | Private Advisor Group, LLC | 34.000 | -6,46 | 445 | -3,05 | ||||
| 2026-02-17 | 13F | Tower Research Capital LLC (TRC) | 440 | -89,50 | 6 | -91,23 | ||||
| 2026-02-17 | 13F | Toronto Dominion Bank | 2.569.246 | -7,53 | 32.497 | -14,36 | ||||
| 2026-02-17 | 13F | Toronto Dominion Bank | Put | 8.000 | -58,97 | 101 | -62,03 | |||
| 2026-02-17 | 13F | Toronto Dominion Bank | Call | 32.700 | -76,11 | 414 | -77,90 | |||
| 2026-02-17 | 13F | Cinctive Capital Management LP | 0 | -100,00 | 0 | |||||
| 2026-02-18 | 13F | Vident Advisory, LLC | 71.703 | -6,18 | 906 | -13,22 | ||||
| 2026-02-04 | 13F | Swiss Life Asset Management Ltd | 12.897 | 0,00 | 163 | -7,39 | ||||
| 2026-02-13 | 13F | Centiva Capital, LP | 0 | -100,00 | 0 | -100,00 | ||||
| 2026-02-13 | 13F | Mariner, LLC | 102.819 | 13,60 | 1.300 | 5,01 | ||||
| 2025-11-10 | 13F | Greenland Capital Management LP | 0 | -100,00 | 0 | -100,00 | ||||
| 2026-02-14 | 13F | Rockefeller Capital Management L.P. | 149 | 2 | ||||||
| 2026-02-17 | 13F | Westerly Capital Management, Llc | 805.000 | -10,56 | 10.175 | -17,30 | ||||
| 2026-01-30 | 13F | Mitsubishi UFJ Trust & Banking Corp | 41.300 | -63,61 | 516 | -66,71 | ||||
| 2026-02-17 | 13F | Optiver Holding B.V. | 66 | -63,33 | 1 | -100,00 | ||||
| 2026-02-10 | 13F | Capital Innovations LLC | 99.595 | 1.259 | ||||||
| 2026-02-13 | 13F | Aigen Investment Management, Lp | 31.298 | 534 | ||||||
| 2026-02-17 | 13F | Massar Capital Management, LP | 140.738 | 1.779 | ||||||
| 2026-02-10 | 13F | Goldman Sachs Group Inc | 4.897.323 | -27,09 | 61.902 | -32,58 | ||||
| 2025-11-14 | 13F | Capstone Investment Advisors, Llc | 192.590 | 498,64 | 2.633 | 658,50 | ||||
| 2026-02-17 | 13F | Russell Investments Group, Ltd. | 22.862 | 339,57 | 290 | 307,04 | ||||
| 2026-02-17 | 13F | Citadel Advisors Llc | Put | 282.500 | 1.514,29 | 3.571 | 1.393,72 | |||
| 2026-02-17 | 13F | Citadel Advisors Llc | Call | 76.900 | 7,40 | 972 | -0,61 | |||
| 2025-11-07 | 13F | Shell Asset Management Co | 4.200 | -74,21 | 0 | |||||
| 2026-02-06 | 13F/A | Rathbone Brothers plc | 57.012 | 0,00 | 722 | -7,33 | ||||
| 2026-02-17 | 13F/A | Northwest & Ethical Investments L.P. | 30.172 | 29,26 | 382 | 19,81 | ||||
| 2026-02-11 | 13F | Franklin Resources Inc | 57.254 | 215,28 | 724 | 191,94 | ||||
| 2026-04-29 | 13F | Police & Firemen's Retirement System of New Jersey | 105.102 | 0,00 | 1.377 | 3,46 | ||||
| 2026-02-17 | 13F | Citadel Advisors Llc | 2.027.408 | 108,73 | 25.626 | 93,01 | ||||
| 2026-02-17 | 13F | Sona Asset Management (us) Llc | 200.000 | 0,00 | 2.530 | -7,40 | ||||
| 2025-11-14 | 13F | Moore Capital Management, Lp | 0 | -100,00 | 0 | -100,00 | ||||
| 2026-02-09 | 13F | Waratah Capital Advisors Ltd. | Call | 0 | -100,00 | 0 | ||||
| 2026-02-13 | 13F | Aviso Financial Inc. | 0 | -100,00 | 0 | |||||
| 2026-02-06 | 13F | Larson Financial Group LLC | 362 | 42,52 | 5 | 33,33 | ||||
| 2026-02-11 | 13F | Deutsche Bank Ag\ | 16.794 | 0,00 | 212 | -7,42 | ||||
| 2026-02-10 | 13F | Goldman Sachs Group Inc | Call | 0 | -100,00 | 0 | -100,00 | |||
| 2026-02-10 | 13F | Quantbot Technologies LP | 23.841 | -52,08 | 301 | -55,74 | ||||
| 2026-02-12 | 13F | Federation des caisses Desjardins du Quebec | 535.816 | -31,12 | 6.765 | -36,11 | ||||
| 2025-11-14 | 13F | AREX Capital Management, LP | 0 | -100,00 | 0 | -100,00 | ||||
| 2026-04-22 | 13F | Sterling Capital Management LLC | 650 | 9 | ||||||
| 2026-02-13 | 13F | Rokos Capital Management LLP | 0 | -100,00 | 0 | |||||
| 2026-02-13 | 13F | Dynamic Technology Lab Private Ltd | 32.810 | 82,63 | 415 | 68,70 | ||||
| 2026-02-17 | 13F | Oaktree Capital Management Lp | 6.415.253 | 0,00 | 81.247 | -7,30 | ||||
| 2026-02-13 | 13F | Verition Fund Management LLC | 227.121 | 200,70 | 2.871 | 178,10 | ||||
| 2026-02-17 | 13F | potrero capital research llc | 1.724.544 | -31,54 | 21.798 | -36,69 | ||||
| 2026-02-13 | 13F | Kempen Capital Management N.v. | 244.856 | 9,11 | 4.251 | -0,38 | ||||
| 2026-04-28 | 13F | Sage Rhino Capital Llc | 11.078 | 8,65 | 145 | 13,28 | ||||
| 2026-02-17 | 13F | Engineers Gate Manager LP | 34.849 | 440 | ||||||
| 2026-02-17 | 13F | AYAL Capital Advisors Ltd | Call | 0 | -100,00 | 0 | ||||
| 2025-11-14 | 13F | Wolverine Trading, Llc | 18.755 | 25,59 | 256 | 61,01 | ||||
| 2026-02-10 | 13F | Connor, Clark & Lunn Investment Management Ltd. | 979.699 | 1,30 | 12.391 | -6,18 | ||||
| 2026-02-18 | 13F | Mackenzie Financial Corp | 3.613.617 | -19,02 | 45.657 | -25,08 | ||||
| 2026-02-17 | 13F | Tudor Investment Corp Et Al | 404.429 | 2.821,54 | 5.112 | 2.604,23 | ||||
| 2026-02-13 | 13F | Van Eck Associates Corp | 44.848 | -22,99 | 1 | |||||
| 2026-02-17 | 13F | AYAL Capital Advisors Ltd | 25.600 | -90,01 | 324 | -90,78 | ||||
| 2026-02-17 | 13F | Trexquant Investment LP | 69.002 | -74,82 | 872 | -76,72 | ||||
| 2026-02-17 | 13F | DZ BANK AG Deutsche Zentral Genossenschafts Bank, Frankfurt am Main | 187.804 | 2.374 | ||||||
| 2026-02-13 | 13F | DLD Asset Management, LP | 12.000 | 152 | ||||||
| 2025-11-14 | 13F | Millennium Management Llc | Call | 0 | -100,00 | 0 | -100,00 | |||
| 2026-02-13 | 13F | DLD Asset Management, LP | Call | 26.000 | 329 | |||||
| 2026-02-17 | 13F | Two Sigma Investments, Lp | 11.699 | -91,20 | 148 | -91,91 | ||||
| 2026-02-13 | 13F | Manufacturers Life Insurance Company, The | 0 | -100,00 | 0 | |||||
| 2026-02-13 | 13F | Maplelane Capital, Llc | 0 | -100,00 | 0 | |||||
| 2026-02-13 | 13F | State Street Corp | 1.183.363 | -4,25 | 15.007 | -11,43 | ||||
| 2025-11-14 | 13F | Ubs Asset Management Americas Inc | 0 | -100,00 | 0 | |||||
| 2026-03-11 | 13F | Leonteq Securities AG | 0 | -100,00 | 0 | |||||
| 2026-02-13 | 13F | Bank Of Nova Scotia | 1.081.198 | -12,36 | 13.674 | -18,86 | ||||
| 2026-02-12 | 13F | Quadrant Capital Group Llc | 17.276 | 0,00 | 218 | -7,63 | ||||
| 2026-02-17 | 13F | Advisor Group Holdings, Inc. | 2.367 | 8,58 | 30 | 3,57 | ||||
| 2026-02-13 | 13F | JustInvest LLC | 40.546 | 4,68 | 513 | -3,21 | ||||
| 2026-02-12 | 13F | BlackRock, Inc. | 274.814 | -12,77 | 3.474 | -19,35 | ||||
| 2026-04-21 | 13F | PharVision Advisers, LLC | 0 | -100,00 | 0 | |||||
| 2026-02-12 | 13F | Scotia Capital Inc. | 246.564 | 12,11 | 3.111 | 4,01 | ||||
| 2026-02-11 | 13F | Metis Global Partners, LLC | 25.626 | 0,00 | 324 | -7,43 | ||||
| 2026-02-17 | 13F | Point72 Asset Management, L.P. | 996.761 | 12.605 | ||||||
| 2026-02-17 | 13F | Caption Management, LLC | 0 | -100,00 | 0 | |||||
| 2026-04-07 | 13F | Signaturefd, Llc | 25.532 | -0,58 | 334 | 3,09 | ||||
| 2026-04-13 | 13F | Lee Financial Co | 10.003 | 132 | ||||||
| 2026-02-12 | 13F | DRW Securities, LLC | 0 | -100,00 | 0 | -100,00 | ||||
| 2026-02-09 | 13F | Harbour Investments, Inc. | 192 | 2 | ||||||
| 2026-02-17 | 13F | Investment Management Corp of Ontario | 32.401 | 410 | ||||||
| 2026-01-29 | 13F | Vanguard Group Inc | 11.123.833 | 1,59 | 140.694 | -5,93 | ||||
| 2026-02-17 | 13F | OnyxPoint Global Management LP | Call | 55.000 | 696 | |||||
| 2026-02-13 | 13F | Citigroup Inc | 404.730 | 629,99 | 5.126 | 577,01 | ||||
| 2026-02-11 | 13F | Jpmorgan Chase & Co | 595.012 | 493,13 | 7.521 | 448,50 | ||||
| 2026-02-13 | 13F | Morgan Stanley | 3.497.528 | -56,78 | 44.209 | -60,03 | ||||
| 2026-03-02 | 13F | Tobam | 4.545 | -13,43 | 0 | |||||
| 2026-02-13 | 13F | Bridgewater Associates, LP | 56.152 | -38,53 | 711 | -43,03 | ||||
| 2026-02-13 | 13F | Rubric Capital Management LP | 17.781.325 | 11,49 | 224.756 | 3,09 | ||||
| 2026-02-13 | 13F | Great West Life Assurance Co /can/ | 32.304 | -5,13 | 0 | |||||
| 2026-02-17 | 13F | Balyasny Asset Management Llc | 0 | -100,00 | 0 | -100,00 | ||||
| 2026-02-17 | 13F | BTG Pactual Asset Management US LLC | 186.980 | 263,22 | 2.365 | 236,27 | ||||
| 2026-02-03 | 13F | Ballentine Partners, LLC | 11.497 | -7,74 | 145 | -14,71 | ||||
| 2025-11-13 | 13F | Quadrature Capital Ltd | 0 | -100,00 | 0 | |||||
| 2026-02-17 | 13F | Janus Henderson Group Plc | 104.287 | 0,00 | 1.320 | -7,50 | ||||
| 2026-01-23 | 13F | Westside Investment Management, Inc. | 962 | 0,00 | 13 | -7,69 | ||||
| 2026-03-03 | 13F/A | Caitong International Asset Management Co., Ltd | 6.900 | 87 | ||||||
| 2026-02-10 | 13F | Td Asset Management Inc | 909.411 | 3,61 | 11.517 | -3,96 | ||||
| 2026-04-22 | 13F | Pictet Asset Management Holding SA | 58.504 | 19,58 | 767 | 23,75 | ||||
| 2026-02-13 | 13F | Quarry LP | 5.424 | 265,99 | 69 | 240,00 | ||||
| 2026-02-13 | 13F | Quarry LP | Call | 6.600 | 83 | |||||
| 2026-02-13 | 13F | Wells Fargo & Company/mn | 1.232 | 0,00 | 16 | -6,25 | ||||
| 2026-02-11 | 13F | Parallel Advisors, LLC | 359 | 0,00 | 5 | 0,00 | ||||
| 2026-02-13 | 13F | Smartleaf Asset Management LLC | 466 | 6 | ||||||
| 2026-02-17 | 13F | Twinbeech Capital Lp | 33.224 | 420 | ||||||
| 2026-02-10 | 13F | Bnp Paribas Arbitrage, Sa | 993.179 | -33,88 | 12.554 | -38,86 | ||||
| 2026-02-17 | 13F | Voleon Capital Management Lp | 15.391 | 195 | ||||||
| 2026-02-18 | 13F | GWM Advisors LLC | 77 | 0,00 | 1 | -100,00 | ||||
| 2026-02-12 | 13F | Bank Of Montreal /can/ | 13.295.335 | 27,53 | 168.163 | 18,11 | ||||
| 2026-02-13 | 13F | Squarepoint Ops LLC | 18.348 | -76,10 | 232 | -77,98 | ||||
| 2026-02-12 | 13F | Renaissance Technologies Llc | 1.210.995 | 17,57 | 15.307 | 8,71 | ||||
| 2026-04-30 | 13F | Nuveen, LLC | 212.983 | 0,00 | 2.791 | 3,49 | ||||
| 2026-02-13 | 13F | Sculptor Capital LP | 3.000.000 | 37.958 | ||||||
| 2026-02-13 | 13F | BRITISH COLUMBIA INVESTMENT MANAGEMENT Corp | 140.168 | -8,84 | 1.773 | -15,58 | ||||
| 2026-02-17 | 13F | Ardsley Advisory Partners Lp | 180.000 | 56,52 | 2.277 | 44,88 | ||||
| 2026-02-10 | 13F | State of Wyoming | 27.057 | 33,71 | 342 | 23,91 | ||||
| 2026-02-13 | 13F | National Bank Of Canada /fi/ | Call | 89 | -79,82 | 113 | -81,40 | |||
| 2026-02-11 | 13F | Simplex Trading, Llc | 9.547 | 121 | ||||||
| 2026-02-13 | 13F | Rhumbline Advisers | 15 | 0,00 | 0 | |||||
| 2026-01-28 | 13F | DekaBank Deutsche Girozentrale | 34.081 | 0,00 | 0 | |||||
| 2026-02-11 | 13F | Simplex Trading, Llc | Call | 147.800 | 285,90 | 1.868 | ||||
| 2026-03-12 | 13F/A | Peak6 Llc | Call | 61.100 | -49,08 | 772 | -52,93 | |||
| 2026-01-30 | 13F | Us Bancorp \de\ | 1.483 | 0,00 | 19 | -10,00 | ||||
| 2026-02-11 | 13F | Simplex Trading, Llc | Put | 23.500 | 170,11 | 297 | ||||
| 2026-02-12 | 13F | Hrt Financial Lp | 0 | -100,00 | 0 | |||||
| 2026-02-17 | 13F | Jones Financial Companies Lllp | 1.632 | 1.532,00 | 21 | 1.900,00 | ||||
| 2026-04-07 | 13F | Farther Finance Advisors, LLC | 34 | 78,95 | 0 | |||||
| 2026-05-01 | 13F | Heronetta Management, L.P. | 0 | -100,00 | 0 | |||||
| 2026-02-17 | 13F | Royal Bank Of Canada | Put | 352.000 | 3.420,00 | 4.449 | 3.147,45 | |||
| 2026-02-17 | 13F | Royal Bank Of Canada | Call | 20.000 | -44,44 | 253 | -48,58 | |||
| 2026-02-17 | 13F | Royal Bank Of Canada | 25.754.198 | -25,83 | 325.533 | -31,42 | ||||
| 2026-01-29 | 13F | IMC-Chicago, LLC | Put | 19.400 | 245 | |||||
| 2026-02-13 | 13F | National Bank Of Canada /fi/ | Put | 12 | -98,31 | 15 | -98,45 | |||
| 2025-11-13 | 13F | Timelo Investment Management Inc. | 0 | -100,00 | 0 | -100,00 | ||||
| 2026-01-29 | 13F | IMC-Chicago, LLC | Call | 161.600 | 2.043 | |||||
| 2026-04-07 | 13F | CoreCap Advisors, LLC | 105 | 0,00 | 1 | 0,00 | ||||
| 2026-02-13 | 13F | Brookfield Asset Management Inc. | 26.947.535 | 0,02 | 340.617 | -7,43 | ||||
| 2026-02-17 | 13F | Cetera Investment Advisers | 0 | -100,00 | 0 | |||||
| 2026-01-27 | 13F | WealthCollab, LLC | 480 | 0,00 | 6 | 0,00 | ||||
| 2026-02-17 | 13F | First Manhattan Co | 793.222 | -7,34 | 10.064 | -14,29 | ||||
| 2026-02-17 | 13F | Aventail Capital Group, LP | 0 | -100,00 | 0 | |||||
| 2026-02-10 | 13F | Norges Bank | 3.581.371 | 45.298 | ||||||
| 2026-02-13 | 13F | American Century Companies Inc | 6.061.717 | 101,63 | 76.669 | 86,70 | ||||
| 2026-04-30 | 13F | Costello Asset Management, INC | 1.800 | 0,00 | 24 | 4,55 | ||||
| 2026-02-05 | 13F | Bessemer Group Inc | 68.300 | 0,00 | 1 | |||||
| 2026-02-13 | 13F | Charles Schwab Investment Management Inc | 894.124 | -0,46 | 11.324 | -7,73 | ||||
| 2025-11-14 | 13F | Skopos Labs, Inc. | 0 | -100,00 | 0 | |||||
| 2026-02-17 | 13F | D. E. Shaw & Co., Inc. | 220.216 | -49,16 | 2.786 | -52,91 | ||||
| 2026-04-20 | 13F | Ronald Blue Trust, Inc. | 223 | -87,90 | 3 | -91,30 | ||||
| 2026-02-12 | 13F | Dimensional Fund Advisors Lp | 1.537.875 | 6,74 | 19.439 | -1,30 | ||||
| 2026-02-17 | 13F | Lombard Odier Asset Management (USA) Corp | 74.625 | -56,36 | 944 | -59,57 | ||||
| 2026-02-17 | 13F | Susquehanna International Group, Llp | Call | 338.400 | 576,80 | 4.277 | 526,21 | |||
| 2026-02-17 | 13F | Alliancebernstein L.p. | 40.551 | -86,08 | 513 | -87,15 | ||||
| 2026-02-05 | 13F | AustralianSuper Pty Ltd | 0 | -100,00 | 0 | -100,00 | ||||
| 2026-02-17 | 13F | Susquehanna International Group, Llp | 275.957 | -31,86 | 3.488 | -36,98 | ||||
| 2026-02-17 | 13F | Yaupon Capital Management LP | 1.290.906 | -7,40 | 16.327 | -14,26 | ||||
| 2026-02-17 | 13F | Susquehanna International Group, Llp | Put | 174.100 | 454,46 | 2.201 | 412,82 | |||
| 2026-02-12 | 13F | Jane Street Group, Llc | Call | 457.500 | 676,74 | 5.783 | 618,26 | |||
| 2026-02-12 | 13F | Jane Street Group, Llc | Put | 12.000 | 152 | |||||
| 2026-02-12 | 13F | Jane Street Group, Llc | 558.934 | 9,95 | 7.065 | 1,65 | ||||
| 2026-01-14 | 13F | Hennion & Walsh Asset Management, Inc. | 45.894 | -1,81 | 580 | -9,09 | ||||
| 2026-02-04 | 13F | First Eagle Investment Management, LLC | 15.474 | 0,00 | 196 | -7,58 | ||||
| 2026-04-27 | 13F | Y-Intercept (Hong Kong) Ltd | 0 | -100,00 | 0 | |||||
| 2025-11-10 | 13F | Jupiter Asset Management Ltd | 0 | -100,00 | 0 | |||||
| 2026-02-11 | 13F | CenterBook Partners LP | 377.942 | 4.777 | ||||||
| 2026-04-13 | 13F | Artemis Investment Management LLP | 1.875.520 | 3,14 | 24.664 | 7,24 | ||||
| 2026-02-13 | 13F | Itau Unibanco Holding S.A. | 989 | -19,40 | 13 | -25,00 | ||||
| 2026-04-28 | 13F | SBI Securities Co., Ltd. | 73 | 2.333,33 | 1 | |||||
| 2026-02-17 | 13F | Ritter Alpha, LP | 10.389 | 131 | ||||||
| 2025-11-13 | 13F | K2 Principal Fund, L.p. | Call | 0 | -100,00 | 0 | ||||
| 2025-11-14 | 13F | Peak6 Llc | 0 | -100,00 | 0 | |||||
| 2026-02-06 | 13F | Pinnbrook Capital Management Lp | 0 | -100,00 | 0 | -100,00 | ||||
| 2026-02-10 | 13F | Clear Harbor Asset Management, LLC | 47.900 | 1,05 | 605 | -6,49 | ||||
| 2026-02-23 | 13F | Virtu Financial LLC | 11.626 | 0 | ||||||
| 2026-04-09 | 13F | Pacifica Partners Inc. | 175 | 0,00 | 2 | 0,00 | ||||
| 2026-02-17 | 13F | Jain Global LLC | 0 | -100,00 | 0 | |||||
| 2026-01-27 | 13F | TD Waterhouse Canada Inc. | 48.141 | -13,12 | 608 | -20,55 | ||||
| 2026-02-05 | 13F | Allworth Financial LP | 614 | 0,00 | 8 | -12,50 | ||||
| 2026-02-11 | 13F | Allianz Asset Management GmbH | 17.008 | 28,01 | 215 | 18,78 | ||||
| 2026-02-17 | 13F | Man Group plc | 2.098.053 | 159,92 | 26.520 | 140,34 | ||||
| 2026-02-09 | 13F | Legal & General Group Plc | 288.863 | -6,22 | 3.658 | -13,07 | ||||
| 2026-02-19 | 13F | Invesco Ltd. | 534.715 | -26,50 | 6.759 | -32,05 | ||||
| 2026-02-13 | 13F | Healthcare Of Ontario Pension Plan Trust Fund | 700.000 | 8.855 | ||||||
| 2026-04-28 | 13F | Bogart Wealth, LLC | 21 | 0 | ||||||
| 2025-11-14 | 13F | J. Goldman & Co LP | Call | 0 | -100,00 | 0 | ||||
| 2025-11-10 | 13F | MAI Capital Management | 0 | -100,00 | 0 | |||||
| 2026-02-17 | 13F | Public Employees Retirement System Of Ohio | 92.264 | -14,71 | 1.168 | -20,97 | ||||
| 2026-04-17 | 13F | Bell Investment Advisors, Inc | 42 | 1 | ||||||
| 2026-01-29 | 13F | UBS Group AG | Call | 0 | -100,00 | 0 | -100,00 | |||
| 2026-02-17 | 13F | Brevan Howard Capital Management LP | Call | 0 | -100,00 | 0 | ||||
| 2026-02-17 | 13F | Brevan Howard Capital Management LP | 0 | -100,00 | 0 | |||||
| 2026-01-27 | 13F | Zurcher Kantonalbank (Zurich Cantonalbank) | 79.801 | 2,48 | 1.011 | -4,99 | ||||
| 2026-02-17 | 13F | BlueCrest Capital Management Ltd | 393.880 | 4.979 | ||||||
| 2026-02-17 | 13F | Value Aligned Research Advisors, LLC | 0 | -100,00 | 0 | |||||
| 2025-11-14 | 13F | ExodusPoint Capital Management, LP | 0 | -100,00 | 0 | |||||
| 2026-02-10 | 13F | CIBC World Markets Inc. | 1.574.000 | 6,14 | 19.911 | -1,68 | ||||
| 2026-02-17 | 13F | Blackstone Group Inc | 0 | -100,00 | 0 | |||||
| 2025-11-13 | 13F | O'shaughnessy Asset Management, Llc | 0 | -100,00 | 0 | -100,00 | ||||
| 2026-01-29 | 13F | UBS Group AG | 3.057.715 | -27,32 | 38.650 | -32,80 | ||||
| 2026-02-13 | 13F | Public Sector Pension Investment Board | 15.360 | 194 | ||||||
| 2026-02-13 | 13F | National Bank Of Canada /fi/ | 1.415.276 | -9,56 | 17.865 | -16,19 | ||||
| 2026-04-16 | 13F | Warren Street Wealth Advisors, LLC | 0 | -100,00 | 0 | -100,00 | ||||
| 2026-02-13 | 13F | Arvin Capital Management LP | 3.819.100 | 22,92 | 48.273 | 13,66 | ||||
| 2026-02-13 | 13F | Arvin Capital Management LP | Call | 402.200 | -38,60 | 5.084 | -43,23 | |||
| 2026-02-13 | 13F | OMERS ADMINISTRATION Corp | 0 | -100,00 | 0 | |||||
| 2026-02-11 | 13F | CLARET ASSET MANAGEMENT Corp | 47.392 | -0,44 | 1 | |||||
| 2026-02-17 | 13F | Creative Planning | 51.193 | -2,19 | 647 | -9,51 | ||||
| 2026-02-19 | 13F | Mcguire Capital Advisors Inc | 579 | 7 | ||||||
| 2026-04-15 | 13F | FNY Investment Advisers, LLC | 0 | -100,00 | 0 | |||||
| 2026-02-02 | 13F | Intact Investment Management Inc. | 428.800 | -26,06 | 5.423 | -31,55 | ||||
| 2026-02-11 | 13F | Fox Run Management, L.l.c. | 51.078 | 646 | ||||||
| 2026-02-11 | 13F | Tacita Capital Inc | 208.307 | -5,02 | 2.636 | -12,05 | ||||
| 2026-02-13 | 13F | Barclays Plc | 8.519 | -96,88 | 108 | -97,13 | ||||
| 2025-12-01 | 13F/A | Polar Asset Management Partners Inc. | 0 | -100,00 | 0 | -100,00 | ||||
| 2026-02-11 | 13F | Group One Trading, L.p. | Put | 52.000 | 2.500,00 | 657 | 2.333,33 | |||
| 2026-02-17 | 13F | Lazard Asset Management Llc | 0 | -100,00 | 0 | -100,00 | ||||
| 2026-02-17 | 13F | Guardian Partners Inc. | 0 | -100,00 | 0 | |||||
| 2026-02-10 | 13F | CIBC Asset Management Inc | 246.087 | -2,38 | 3.114 | -9,45 | ||||
| 2026-02-11 | 13F | Group One Trading, L.p. | 14.217 | 180 | ||||||
| 2026-02-11 | 13F | Group One Trading, L.p. | Call | 265.800 | 534,37 | 3.360 | 487,24 | |||
| 2026-02-13 | 13F | Wexford Capital Lp | 0 | -100,00 | 0 | |||||
| 2026-02-12 | 13F | Campbell & CO Investment Adviser LLC | 88.622 | 1.120 | ||||||
| 2026-02-12 | 13F | Brinker Capital Investments, LLC | 26.133 | 37,68 | 330 | 27,41 | ||||
| 2026-02-09 | 13F | Geode Capital Management, Llc | 189.615 | 15,38 | 2.453 | 8,54 | ||||
| 2026-02-17 | 13F | Millennium Management Llc | 8.475.864 | -35,38 | 107.226 | -40,15 | ||||
| 2026-02-10 | 13F | Savant Capital, LLC | 16.568 | 10,82 | 209 | 2,45 | ||||
| 2026-02-17 | 13F | Millennium Management Llc | Put | 400.000 | 0,00 | 6.944 | -8,68 | |||
| 2026-04-16 | 13F | Warren Street Wealth Advisors, LLC | Call | 12.000 | 219 | |||||
| 2026-02-25 | 13F | Mariner Investment Group Llc | Call | 0 | -100,00 | 0 | -100,00 | |||
| 2026-02-17 | 13F | Gotham Asset Management, LLC | 31.756 | -0,01 | 401 | -7,60 | ||||
| 2026-02-17 | 13F | Qube Research & Technologies Ltd | 426.412 | 933,70 | 5.390 | 857,37 | ||||
| 2026-02-17 | 13F | Fmr Llc | 23.706.888 | 4,80 | 299.845 | -2,96 | ||||
| 2026-02-17 | 13F | Clayton Partners LLC | 629.572 | -9,23 | 7.958 | -16,07 | ||||
| 2026-02-12 | 13F | Swiss National Bank | 557.700 | 2,42 | 7.068 | -5,00 | ||||
| 2026-04-20 | 13F | Cardinal Point Capital Management, ULC | 182.660 | 8,46 | 2.397 | 12,33 | ||||
| 2026-02-13 | 13F | Hudson Bay Capital Management LP | 211.562 | 2.674 | ||||||
| 2026-02-17 | 13F | SIG North Trading, ULC | Put | 448.600 | 65,54 | 5.670 | 53,08 | |||
| 2026-02-17 | 13F | SIG North Trading, ULC | Call | 865.700 | 62,45 | 10.942 | 50,22 | |||
| 2026-03-06 | 13F | Hsbc Holdings Plc | 0 | -100,00 | 0 | |||||
| 2026-03-20 | 13F | Purpose Unlimited Inc. | 509.253 | 6.441 | ||||||
| 2026-04-14 | 13F | Nbc Securities, Inc. | 3.315 | 13,57 | 43 | 19,44 | ||||
| 2026-01-29 | 13F | IMC-Chicago, LLC | 0 | -100,00 | 0 | -100,00 | ||||
| 2026-02-17 | 13F | SIG North Trading, ULC | 149.915 | 29,77 | 1.895 | 19,95 | ||||
| 2026-02-10 | 13F | CIBC World Markets Inc. | Call | 0 | -100,00 | 0 | -100,00 | |||
| 2026-02-17 | 13F | Schonfeld Strategic Advisors LLC | 81.011 | 1.024 | ||||||
| 2026-02-17 | 13F | XTX Topco Ltd | 32.786 | -58,57 | 414 | -61,70 | ||||
| 2026-02-06 | 13F | EverSource Wealth Advisors, LLC | 3.000 | 37,11 | 38 | 27,59 | ||||
| 2026-02-17 | 13F | Clear Street Markets Llc | 0 | -100,00 | 0 | |||||
| 2026-02-17 | 13F | Two Sigma Advisers, Lp | 0 | -100,00 | 0 | |||||
| 2026-02-17 | 13F | Bank Of America Corp /de/ | 11.021.749 | 52,38 | 139.315 | 40,90 | ||||
| 2026-04-28 | 13F | Alberta Investment Management Corp | 70.852 | 932 | ||||||
| 2026-02-17 | 13F | Hartree Partners, LP | 0 | -100,00 | 0 |