Grundlæggende statistik
| Institutionelle aktier (lange) | 38.497.107 - 59,00% (ex 13D/G) - change of -6,72MM shares -14,86% MRQ |
| Institutionel værdi (lang) | $ 532.966 USD ($1000) |
Institutionelt ejerskab og aktionærer
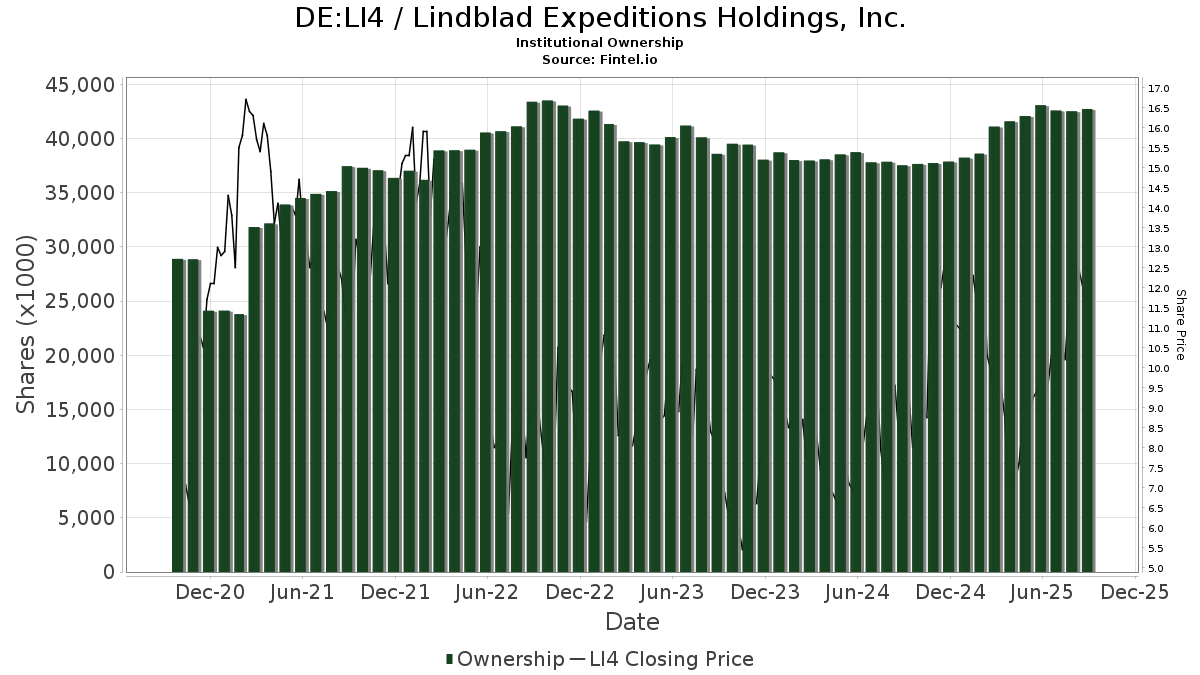
Lindblad Expeditions Holdings, Inc. (DE:LI4) har 185 institutionelle ejere og aktionærer, der har indsendt 13D/G- eller 13F-formularer til Securities Exchange Commission (SEC). Disse institutioner har i alt 38,497,107 aktier. Største aktionærer omfatter Ariel Investments, Llc, BlackRock, Inc., Vanguard Group Inc, Anchor Capital Management Company, Llc, Principal Financial Group Inc, Royce & Associates Lp, Black Diamond Financial, LLC, Bank of New York Mellon Corp, Penn Capital Management Co Inc, and Geode Capital Management, Llc .
Lindblad Expeditions Holdings, Inc. (DB:LI4) institutionel ejerskabsstruktur viser aktuelle positioner i virksomheden efter institutioner og fonde, samt seneste ændringer i positionsstørrelse. Større aktionærer kan omfatte individuelle investorer, investeringsforeninger, hedgefonde eller institutioner. Skema 13D angiver, at investoren besidder (eller besidder) mere end 5 % af virksomheden og har til hensigt (eller har til hensigt at) aktivt at forfølge en ændring i forretningsstrategi. Skema 13G indikerer en passiv investering på over 5%.
The share price as of April 24, 2026 is 15,50 / share. Previously, on April 28, 2025, the share price was 7,60 / share. This represents an increase of 103,95% over that period.
Fondens stemningsscore
Fund Sentiment Score (fka Ownership Accumulation Score) finder de aktier, der bliver mest købt af fonde. Det er resultatet af en sofistikeret, multi-faktor kvantitativ model, der identificerer virksomheder med de højeste niveauer af institutionel akkumulering. Scoringsmodellen bruger en kombination af den samlede stigning i oplyste ejere, ændringerne i porteføljeallokeringer i disse ejere og andre målinger. Tallet går fra 0 til 100, hvor højere tal indikerer et højere niveau af akkumulering for sine jævnaldrende, og 50 er gennemsnittet.
Opdateringsfrekvens: Dagligt
Se Ownership Explorer, som giver en liste over højest rangerende virksomheder.
AI+ Ask Fintel’s AI assistant about Lindblad Expeditions Holdings, Inc..
Select a question to share a public post with an AI-crafted answer.
Thinking of good questions…
13F og NPORT arkivering
Detaljer om 13F-arkivering er gratis. Detaljer om NP-ansøgninger kræver et premium-medlemskab. Grønne rækker angiver nye positioner. Røde rækker angiver lukkede positioner. Klik på linket ikon for at se den fulde transaktionshistorik.
Opgrader
for at låse premium-data op og eksportere til Excel ![]() .
.
| Fil dato | Kilde | Investor | Type | Gennemsnitlig pris (Øst) |
Aktier | Δ Aktier (%) |
Rapporteret Værdi ($1000) |
Δ Værdi (%) |
Port Alloc (%) |
|
|---|---|---|---|---|---|---|---|---|---|---|
| 2026-02-14 | 13F | Rockefeller Capital Management L.P. | 128 | 2 | ||||||
| 2026-01-23 | 13F | Assetmark, Inc | 3.082 | -30,60 | 44 | -21,43 | ||||
| 2026-02-13 | 13F | Caxton Associates Llp | 10.815 | -19,89 | 156 | -9,88 | ||||
| 2026-02-17 | 13F | Balyasny Asset Management Llc | 14.891 | 215 | ||||||
| 2026-02-13 | 13F | Pathstone Holdings, LLC | 33.139 | -0,60 | 478 | 11,97 | ||||
| 2026-02-11 | 13F | Franklin Resources Inc | 26.317 | -96,80 | 379 | -96,40 | ||||
| 2026-02-13 | 13F | Citigroup Inc | 5.158 | -25,52 | 74 | -15,91 | ||||
| 2026-02-13 | 13F | Sei Investments Co | 56.878 | 820 | ||||||
| 2026-04-16 | 13F | Diversified Trust Co | 13.412 | 21,82 | 232 | 46,84 | ||||
| 2026-02-17 | 13F | Millennium Management Llc | 246.633 | -70,43 | 3.556 | -66,69 | ||||
| 2026-02-11 | 13F | Parallel Advisors, LLC | 0 | -100,00 | 0 | |||||
| 2026-02-13 | 13F | MAI Capital Management | 624 | 0,00 | 9 | 14,29 | ||||
| 2026-02-17 | 13F | Canada Pension Plan Investment Board | 52.200 | 753 | ||||||
| 2026-02-13 | 13F | Formula Growth Ltd | 403.591 | -3,15 | 5.820 | 9,11 | ||||
| 2026-02-17 | 13F | Two Sigma Advisers, Lp | 209.100 | 17,54 | 3.015 | 32,41 | ||||
| 2026-02-03 | 13F | Harel Insurance Investments & Financial Services Ltd. | 30 | 0,00 | 0 | |||||
| 2026-02-17 | 13F | Cresset Asset Management, LLC | 0 | -100,00 | 0 | -100,00 | ||||
| 2026-02-13 | 13F | Nicholas Investment Partners, LP | 46.556 | -4,27 | 671 | 7,88 | ||||
| 2026-02-13 | 13F | Thomist Capital Management, LP | 19.800 | 287 | ||||||
| 2026-02-17 | 13F | Janus Henderson Group Plc | 14.166 | 0,00 | 204 | 12,71 | ||||
| 2026-02-12 | 13F | Adviser Investments LLC | 37.500 | 0,00 | 541 | 12,50 | ||||
| 2026-02-10 | 13F | Intech Investment Management Llc | 12.546 | -12,20 | 181 | -1,10 | ||||
| 2026-02-03 | 13F | Pier Capital, LLC | 577.479 | 21,65 | 8.327 | 37,05 | ||||
| 2026-02-09 | 13F | Geode Capital Management, Llc | 908.796 | 0,61 | 13.107 | 13,35 | ||||
| 2026-04-15 | 13F | Cacti Asset Management Llc | 41.500 | 0,00 | 718 | 21,11 | ||||
| 2026-02-12 | 13F | Federated Hermes, Inc. | 7.391 | -9,08 | 107 | 1,92 | ||||
| 2026-02-17 | 13F | State Of Wisconsin Investment Board | 30.364 | -9,05 | 438 | 2,34 | ||||
| 2026-02-11 | 13F | Inceptionr Llc | 14.425 | 208 | ||||||
| 2025-11-03 | 13F | Summit Global Investments | 0 | -100,00 | 0 | |||||
| 2026-02-11 | 13F | Group One Trading, L.p. | Put | 200 | 100,00 | 3 | 100,00 | |||
| 2026-01-26 | 13F | PFG Investments, LLC | 16.300 | 0,00 | 235 | 12,98 | ||||
| 2026-02-17 | 13F | Aperture Investors, LLC | 0 | -100,00 | 0 | |||||
| 2026-02-13 | 13F | Charles Schwab Investment Management Inc | 320.013 | -0,05 | 4.615 | 12,59 | ||||
| 2026-02-17 | 13F | Ameriprise Financial Inc | 99.034 | 0,41 | 1.428 | 13,15 | ||||
| 2026-02-13 | 13F | Arrowstreet Capital, Limited Partnership | 879.550 | 17,15 | 12.683 | 31,99 | ||||
| 2026-02-13 | 13F | BNP Paribas Asset Management Holding S.A. | 0 | -100,00 | 0 | |||||
| 2026-04-06 | 13F | Versant Capital Management, Inc | 59 | 0,00 | 1 | |||||
| 2026-02-11 | 13F | O'shaughnessy Asset Management, Llc | 0 | -100,00 | 0 | |||||
| 2026-02-10 | 13F | Rothschild Investment Llc | 119 | 8,18 | 2 | 0,00 | ||||
| 2026-02-17 | 13F | Man Group plc | 41.385 | -48,05 | 597 | -41,51 | ||||
| 2026-02-17 | 13F | Qube Research & Technologies Ltd | 345.047 | -14,20 | 4.976 | -3,34 | ||||
| 2026-02-13 | 13F | Ariel Investments, Llc | 5.118.819 | -7,35 | 73.813 | 4,38 | ||||
| 2026-01-20 | 13F | Harbor Capital Advisors, Inc. | 78.241 | 122,60 | 1 | |||||
| 2026-02-17 | 13F | Aristeia Capital Llc | 62.044 | 50,13 | 895 | 69,32 | ||||
| 2025-11-14 | 13F | ExodusPoint Capital Management, LP | 0 | -100,00 | 0 | |||||
| 2026-02-10 | 13F | Bnp Paribas Arbitrage, Sa | 74.261 | -43,04 | 1.071 | -35,85 | ||||
| 2026-02-10 | 13F | Goldman Sachs Group Inc | 604.437 | 76,72 | 8.716 | 99,11 | ||||
| 2026-01-28 | 13F | Klp Kapitalforvaltning As | 9.300 | 0,00 | 134 | 12,61 | ||||
| 2026-03-06 | 13F | Hsbc Holdings Plc | 53.749 | 112,92 | 775 | 145,71 | ||||
| 2026-02-10 | 13F | Connor, Clark & Lunn Investment Management Ltd. | 481.390 | -22,67 | 6.942 | -12,89 | ||||
| 2026-02-17 | 13F | Trexquant Investment LP | 26.533 | -69,45 | 383 | -65,62 | ||||
| 2026-02-17 | 13F | Oberweis Asset Management Inc/ | 306.800 | 2,47 | 4.424 | 15,45 | ||||
| 2026-02-13 | 13F | Manufacturers Life Insurance Company, The | 0 | -100,00 | 0 | |||||
| 2026-02-13 | 13F | State Street Corp | 832.968 | -0,03 | 12.011 | 12,62 | ||||
| 2026-04-13 | 13F | True Wealth Design, LLC | 1 | 0,00 | 0 | |||||
| 2026-01-30 | 13F | Torren Management, LLC | 44 | 1 | ||||||
| 2026-02-09 | 13F | Cary Street Partners Financial Llc | 32.419 | 0,00 | 467 | 12,80 | ||||
| 2026-02-17 | 13F | Susquehanna International Group, Llp | 11.686 | 169 | ||||||
| 2026-02-09 | 13F | Hartland & Co., LLC | 7 | -93,86 | 0 | -100,00 | ||||
| 2026-04-21 | 13F | Pinnacle Associates Ltd | 840.323 | -7,61 | 14.538 | 10,85 | ||||
| 2026-02-17 | 13F | Fmr Llc | 3.190 | -15,02 | 46 | -4,17 | ||||
| 2026-02-12 | 13F | Aristides Capital LLC | 26.180 | 4,72 | 378 | 17,81 | ||||
| 2026-02-17 | 13F | Price T Rowe Associates Inc /md/ | 22.507 | 12,53 | 0 | |||||
| 2026-01-21 | 13F | Hunter Associates Investment Management Llc | 228.490 | 0,00 | 3 | 50,00 | ||||
| 2026-02-13 | 13F | Squarepoint Ops LLC | 150.185 | 299,33 | 2.166 | 350,10 | ||||
| 2026-02-17 | 13F | Northern Trust Corp | 291.380 | -3,55 | 4.202 | 8,67 | ||||
| 2026-04-22 | 13F | Sterling Capital Management LLC | 248 | -3,50 | 4 | 33,33 | ||||
| 2026-02-17 | 13F | Bank Of America Corp /de/ | 277.793 | 100,09 | 4.006 | 125,38 | ||||
| 2026-02-13 | 13F | Parkside Financial Bank & Trust | 55 | 0,00 | 1 | |||||
| 2026-01-29 | 13F | Vanguard Group Inc | 2.355.182 | 0,98 | 33.962 | 13,76 | ||||
| 2026-02-12 | 13F | Swiss National Bank | 75.641 | 2,72 | 1.091 | 15,71 | ||||
| 2026-02-13 | 13F | Needham Investment Management Llc | 52.223 | 0,00 | 753 | 12,72 | ||||
| 2026-02-18 | 13F | Mackenzie Financial Corp | 105.973 | -17,16 | 1.525 | -6,84 | ||||
| 2026-02-13 | 13F | Pinnacle Wealth Planning Services, Inc. | 421 | 6 | ||||||
| 2026-02-12 | 13F | JT Stratford LLC | 0 | -100,00 | 0 | |||||
| 2026-01-29 | 13F | Comerica Bank | 35.884 | 0,00 | 517 | 12,64 | ||||
| 2026-02-17 | 13F | Graham Capital Management, L.P. | 24.763 | 2,44 | 357 | 15,53 | ||||
| 2026-01-28 | 13F | Villere St Denis J & Co Llc | 0 | -100,00 | 0 | |||||
| 2026-02-12 | 13F | MetLife Investment Management, LLC | 21.449 | 6,91 | 309 | 20,70 | ||||
| 2025-11-12 | 13F | Group One Trading, L.p. | 0 | -100,00 | 0 | -100,00 | ||||
| 2025-11-14 | 13F | Susquehanna International Group, Llp | Call | 0 | -100,00 | 0 | ||||
| 2026-04-23 | 13F | North Star Investment Management Corp. | 204.800 | 0,00 | 3.543 | 19,98 | ||||
| 2026-04-15 | 13F | Brady Martz Wealth Solutions, LLC | 10.018 | 173 | ||||||
| 2026-02-13 | 13F | Barclays Plc | 189.582 | 3,94 | 2.734 | 17,10 | ||||
| 2026-02-17 | 13F | XTX Topco Ltd | 0 | -100,00 | 0 | |||||
| 2026-02-17 | 13F | nVerses Capital, LLC | 10.803 | 156 | ||||||
| 2026-04-20 | 13F | State of Alaska, Department of Revenue | 2.738 | 0,00 | 0 | |||||
| 2026-02-12 | 13F | CIBC Private Wealth Group, LLC | 2 | 0,00 | 0 | |||||
| 2025-11-14 | 13F | Susquehanna International Group, Llp | Put | 0 | -100,00 | 0 | ||||
| 2026-02-12 | 13F | Renaissance Technologies Llc | 94.485 | -47,61 | 1.362 | -40,99 | ||||
| 2026-02-06 | 13F | EverSource Wealth Advisors, LLC | 237 | -5,20 | 3 | 0,00 | ||||
| 2026-02-13 | 13F | Smartleaf Asset Management LLC | 411 | 0,00 | 6 | 0,00 | ||||
| 2026-02-13 | 13F | Marshall Wace, Llp | 374.643 | -34,14 | 5.402 | -25,81 | ||||
| 2026-02-12 | 13F | Integrated Quantitative Investments LLC | 0 | -100,00 | 0 | |||||
| 2026-02-10 | 13F | Quantbot Technologies LP | 16.997 | 245 | ||||||
| 2026-02-11 | 13F | Simplex Trading, Llc | Put | 0 | -100,00 | 0 | ||||
| 2026-02-12 | 13F | Voya Investment Management Llc | 30.220 | 1,55 | 436 | 14,47 | ||||
| 2026-02-11 | 13F | Simplex Trading, Llc | Call | 0 | -100,00 | 0 | ||||
| 2026-02-11 | 13F | Simplex Trading, Llc | 0 | -100,00 | 0 | |||||
| 2026-02-11 | 13F | Manchester Capital Management LLC | 0 | -100,00 | 0 | -100,00 | ||||
| 2026-04-23 | 13F | CWM Advisors, LLC | 29.728 | -8,32 | 514 | 10,06 | ||||
| 2026-02-13 | 13F | Panagora Asset Management Inc | 197.232 | 8,47 | 2.844 | 22,22 | ||||
| 2026-04-07 | 13F | Signaturefd, Llc | 72 | 0,00 | 1 | 0,00 | ||||
| 2026-04-16 | 13F | SG Americas Securities, LLC | 27.883 | -83,81 | 0 | -100,00 | ||||
| 2026-02-12 | 13F | Fuller & Thaler Asset Management, Inc. | 29.480 | 0,00 | 425 | 12,73 | ||||
| 2026-01-29 | 13F | Simon Quick Advisors, Llc | 16.118 | 0,00 | 232 | 12,62 | ||||
| 2026-02-17 | 13F | Tudor Investment Corp Et Al | 219.574 | -27,43 | 3.166 | -18,23 | ||||
| 2026-02-17 | 13F | Aqr Capital Management Llc | 107.355 | -23,37 | 1.548 | -13,66 | ||||
| 2026-02-17 | 13F | Anchor Capital Management Company, Llc | 1.911.106 | 0,00 | 27.558 | 12,66 | ||||
| 2026-01-26 | 13F | Cwm, Llc | 2.297 | -52,63 | 0 | |||||
| 2026-02-06 | 13F | Pnc Financial Services Group, Inc. | 501 | 213,12 | 7 | 250,00 | ||||
| 2026-02-12 | 13F | Ensign Peak Advisors, Inc | 13.617 | -58,82 | 196 | -53,66 | ||||
| 2026-01-27 | 13F | Hedges Asset Management LLC | 139.900 | -0,99 | 2.017 | 11,56 | ||||
| 2026-02-03 | 13F | SBI Securities Co., Ltd. | 883 | 0,00 | 13 | 9,09 | ||||
| 2026-01-29 | 13F | UBS Group AG | 833.372 | 57,93 | 12.017 | 77,92 | ||||
| 2026-02-14 | 13F | Militia Capital Partners, LP | 62.268 | 0,00 | 898 | 12,55 | ||||
| 2026-02-17 | 13F | Quantinno Capital Management LP | 16.740 | 25,57 | 241 | 41,76 | ||||
| 2025-11-14 | 13F | Citadel Advisors Llc | 0 | -100,00 | 0 | -100,00 | ||||
| 2026-02-13 | 13F | Walleye Capital LLC | 112.973 | 1.629 | ||||||
| 2026-01-27 | 13F | Zurcher Kantonalbank (Zurich Cantonalbank) | 6.220 | 0,00 | 90 | 12,66 | ||||
| 2026-02-06 | 13F | Larson Financial Group LLC | 605 | 285,35 | 9 | 300,00 | ||||
| 2026-02-05 | 13F | Amalgamated Bank | 1.183 | -4,90 | 0 | |||||
| 2026-02-06 | 13F | Covestor Ltd | 630 | 0 | ||||||
| 2026-02-13 | 13F | Verition Fund Management LLC | 12.500 | -20,69 | 180 | -10,45 | ||||
| 2026-02-13 | 13F | Balanced Rock Investment Advisor | 12.750 | -1,39 | 184 | 10,91 | ||||
| 2026-02-13 | 13F | Rhumbline Advisers | 45.420 | -15,66 | 655 | -5,08 | ||||
| 2026-04-13 | 13F | Wedge Capital Management L L P/nc | 122.446 | 1,76 | 2.118 | 22,07 | ||||
| 2026-02-17 | 13F | Lazard Asset Management Llc | 126.757 | 1.828 | ||||||
| 2026-02-17 | 13F | Royal Bank Of Canada | 4.494 | 127,08 | 65 | 160,00 | ||||
| 2026-02-12 | 13F | Quadrant Capital Group Llc | 872 | -11,74 | 13 | 0,00 | ||||
| 2026-02-13 | 13F | Rice Hall James & Associates, Llc | 138.296 | -16,63 | 1.994 | -6,08 | ||||
| 2026-02-13 | 13F | Lord, Abbett & Co. Llc | 541.751 | 63,70 | 8 | 75,00 | ||||
| 2026-02-17 | 13F | Granahan Investment Management Inc/ma | 0 | -100,00 | 0 | |||||
| 2026-04-21 | 13F | Pinnacle Wealth Management Advisory Group, LLC | 0 | -100,00 | 0 | |||||
| 2026-02-17 | 13F | Alliancebernstein L.p. | 39.980 | 10,20 | 577 | 24,14 | ||||
| 2026-02-13 | 13F | Stifel Financial Corp | 314.933 | -1,13 | 4.541 | 11,38 | ||||
| 2026-02-09 | 13F | Royce & Associates Lp | 1.091.371 | -2,59 | 15.738 | 9,73 | ||||
| 2026-02-17 | 13F | Engineers Gate Manager LP | 44.407 | -28,95 | 640 | -20,00 | ||||
| 2026-02-17 | 13F | Two Sigma Investments, Lp | 237.252 | -4,00 | 3.421 | 8,16 | ||||
| 2026-02-10 | 13F | State of Wyoming | 9.418 | 136 | ||||||
| 2026-02-17 | 13F | California State Teachers Retirement System | 39.738 | 12,63 | 573 | 27,05 | ||||
| 2026-02-13 | 13F | Victory Capital Management Inc | 90.140 | 1,07 | 1.300 | 13,85 | ||||
| 2026-02-02 | 13F | Principal Financial Group Inc | 1.482.913 | 8,98 | 21.384 | 22,77 | ||||
| 2026-02-11 | 13F | Gwn Securities Inc. | 0 | -100,00 | 0 | |||||
| 2026-02-13 | 13F | Police & Firemen's Retirement System of New Jersey | 10.364 | 0,00 | 149 | 12,88 | ||||
| 2026-02-11 | 13F | Ameritas Investment Partners, Inc. | 3.449 | 50 | ||||||
| 2026-02-12 | 13F | Dimensional Fund Advisors Lp | 494.343 | 6,31 | 7.128 | 19,78 | ||||
| 2026-02-13 | 13F | Morgan Stanley | 555.079 | 6,96 | 8.004 | 20,51 | ||||
| 2026-02-17 | 13F | D. E. Shaw & Co., Inc. | 81.430 | -44,45 | 1.174 | -37,42 | ||||
| 2026-04-06 | 13F | GAMMA Investing LLC | 950 | 25,50 | 16 | 60,00 | ||||
| 2026-02-13 | 13F | Y-Intercept (Hong Kong) Ltd | 131.957 | 1.166,87 | 1.903 | 1.330,08 | ||||
| 2026-02-13 | 13F | Quarry LP | 907 | 13 | ||||||
| 2026-02-17 | 13F | Optiver Holding B.V. | 338 | 0,00 | 5 | 0,00 | ||||
| 2026-02-10 | 13F | Envestnet Asset Management Inc | 17.823 | 1,60 | 257 | 14,73 | ||||
| 2026-02-11 | 13F | Deutsche Bank Ag\ | 29.521 | 4,02 | 426 | 17,08 | ||||
| 2026-02-13 | 13F | Great West Life Assurance Co /can/ | 1.218 | 0,00 | 0 | |||||
| 2025-11-12 | 13F | Fox Run Management, L.l.c. | 0 | -100,00 | 0 | |||||
| 2026-04-13 | 13F | Loring Wolcott & Coolidge Fiduciary Advisors Llp/ma | 46.593 | -23,10 | 891 | -8,80 | ||||
| 2026-02-12 | 13F | Orvieto Partners, L.P. | 13.780 | 199 | ||||||
| 2026-01-15 | 13F | Nisa Investment Advisors, Llc | 640 | 377,61 | 9 | 800,00 | ||||
| 2025-11-21 | 13F | Nebula Research & Development LLC | 0 | -100,00 | 0 | |||||
| 2026-02-17 | 13F | Kemnay Advisory Services Inc. | 3.963 | 57 | ||||||
| 2026-02-12 | 13F | Nuveen, LLC | 163.570 | -27,75 | 2.359 | -18,61 | ||||
| 2026-02-17 | 13F | Russell Investments Group, Ltd. | 168.981 | -0,84 | 2.437 | 11,69 | ||||
| 2026-02-17 | 13F | Prelude Capital Management, Llc | 11.906 | -6,25 | 172 | 5,56 | ||||
| 2026-02-17 | 13F | Creative Planning | 30.256 | 4,23 | 436 | 17,52 | ||||
| 2026-02-17 | 13F | Driehaus Capital Management Llc | 567.906 | -32,61 | 8.189 | -24,08 | ||||
| 2026-02-11 | 13F | Jpmorgan Chase & Co | 290.269 | -21,41 | 4.186 | -11,47 | ||||
| 2026-02-09 | 13F | Jackson Creek Investment Advisors LLC | 34.667 | 0 | ||||||
| 2025-11-14 | 13F | Corton Capital Inc. | 11.758 | 151 | ||||||
| 2026-01-14 | 13F | Osher Van de Voorde Investment Management | 12.000 | 0,00 | 173 | 13,07 | ||||
| 2026-02-03 | 13F | McIlrath & Eck, LLC | 863 | 0,00 | 12 | 9,09 | ||||
| 2026-02-12 | 13F | State Board Of Administration Of Florida Retirement System | 10.000 | 0,00 | 144 | 12,50 | ||||
| 2026-01-30 | 13F | Catalytic Wealth RIA, LLC | 297.089 | 0,01 | 4.284 | 12,68 | ||||
| 2026-02-17 | 13F | Algert Global Llc | 685.365 | 24,87 | 10 | 28,57 | ||||
| 2026-02-17 | 13F | Magnetar Financial LLC | 19.879 | 287 | ||||||
| 2026-04-13 | 13F | IFP Advisors, Inc | 5 | -50,00 | 0 | |||||
| 2026-02-17 | 13F | Brevan Howard Capital Management LP | 37.409 | 539 | ||||||
| 2026-02-17 | 13F | Tower Research Capital LLC (TRC) | 897 | -70,43 | 13 | -68,42 | ||||
| 2026-04-21 | 13F | PharVision Advisers, LLC | 0 | -100,00 | 0 | |||||
| 2026-02-03 | 13F | Black Diamond Financial, LLC | 1.068.362 | 0,00 | 15.406 | 12,65 | ||||
| 2026-02-13 | 13F | SRS Capital Advisors, Inc. | 576 | -66,45 | 8 | -61,90 | ||||
| 2026-02-10 | 13F | Acadian Asset Management Llc | 106.360 | 182,28 | 2 | |||||
| 2026-02-04 | 13F | Virginia Retirement Systems Et Al | 20.000 | -41,18 | 288 | -33,79 | ||||
| 2026-02-17 | 13F | Petrus Trust Company, LTA | 0 | -100,00 | 0 | |||||
| 2026-02-09 | 13F | Quest Partners LLC | 46.731 | -10,48 | 674 | 0,75 | ||||
| 2026-01-28 | 13F | Teacher Retirement System Of Texas | 29.637 | -1,93 | 427 | 10,62 | ||||
| 2025-11-14 | 13F | Sherbrooke Park Advisers Llc | 0 | -100,00 | 0 | |||||
| 2026-02-13 | 13F | Ubs Asset Management Americas Inc | 46.220 | 0,56 | 666 | 13,27 | ||||
| 2026-02-05 | 13F | Allworth Financial LP | 141 | -34,72 | 2 | 0,00 | ||||
| 2026-02-17 | 13F | Silvercrest Asset Management Group Llc | 865.119 | 0,00 | 12.475 | 12,66 | ||||
| 2026-02-17 | 13F | MIRAE ASSET GLOBAL ETFS HOLDINGS Ltd. | 17.442 | 1,11 | 252 | 14,09 | ||||
| 2026-02-17 | 13F | Aster Capital Management (DIFC) Ltd | 563 | 8 | ||||||
| 2026-02-17 | 13F | Numerai GP LLC | 37.392 | 93,63 | 539 | 118,22 | ||||
| 2026-02-10 | 13F | Moors & Cabot, Inc. | 43.500 | -8,42 | 627 | 3,13 | ||||
| 2026-04-07 | 13F | Farther Finance Advisors, LLC | 213 | 51,06 | 4 | 50,00 | ||||
| 2025-11-14 | 13F | Gotham Asset Management, LLC | 0 | -100,00 | 0 | |||||
| 2026-02-12 | 13F | Jane Street Group, Llc | 94.639 | 117,40 | 1.365 | 144,88 | ||||
| 2026-02-09 | 13F | Legal & General Group Plc | 23.513 | -29,62 | 339 | -20,61 | ||||
| 2026-02-13 | 13F | Wells Fargo & Company/mn | 41.993 | 81,58 | 606 | 104,39 | ||||
| 2025-11-10 | 13F | Jupiter Asset Management Ltd | 0 | -100,00 | 0 | |||||
| 2026-02-10 | 13F | Bank of New York Mellon Corp | 1.030.646 | 21,47 | 14.862 | 36,84 | ||||
| 2026-02-13 | 13F | Prudential Financial Inc | 0 | -100,00 | 0 | |||||
| 2026-02-17 | 13F | Citadel Advisors Llc | Put | 0 | -100,00 | 0 | -100,00 | |||
| 2026-02-12 | 13F | BlackRock, Inc. | 3.463.059 | 8,07 | 49.937 | 21,75 | ||||
| 2025-11-12 | 13F/A | Norges Bank | 98.200 | -34,18 | 908 | -36,90 | ||||
| 2026-02-13 | 13F | Brasada Capital Management, Lp | 38.000 | 8,57 | 549 | 26,27 | ||||
| 2026-02-19 | 13F | Invesco Ltd. | 36.911 | 12,87 | 532 | 27,27 | ||||
| 2026-01-29 | 13F | Quent Capital, LLC | 118.500 | 1.709 | ||||||
| 2026-02-17 | 13F | PDT Partners, LLC | 28.050 | 0,00 | 404 | 12,53 | ||||
| 2026-02-12 | 13F | New York State Common Retirement Fund | 634.039 | 0,00 | 9.143 | 12,66 | ||||
| 2025-11-17 | 13F | Jacobs Levy Equity Management, Inc | 0 | -100,00 | 0 | -100,00 | ||||
| 2026-02-11 | 13F | Los Angeles Capital Management Llc | 163.116 | 0,78 | 1.892 | -8,64 | ||||
| 2026-02-17 | 13F | Advisor Group Holdings, Inc. | 3.227 | -11,73 | 47 | 0,00 | ||||
| 2026-02-09 | 13F | Penn Capital Management Co Inc | 947.890 | -2,23 | 13.683 | 10,14 | ||||
| 2026-02-17 | 13F | Jump Financial, LLC | 13.132 | 189 | ||||||
| 2026-01-28 | 13F | Arizona State Retirement System | 10.547 | -6,86 | 152 | 5,56 | ||||
| 2026-02-17 | 13F | Aquatic Capital Management LLC | 21.489 | -32,82 | 310 | -24,45 | ||||
| 2025-11-14 | 13F | Skopos Labs, Inc. | 0 | -100,00 | 0 |
Other Listings
| US:LIND | 18,38 $ |