Grundlæggende statistik
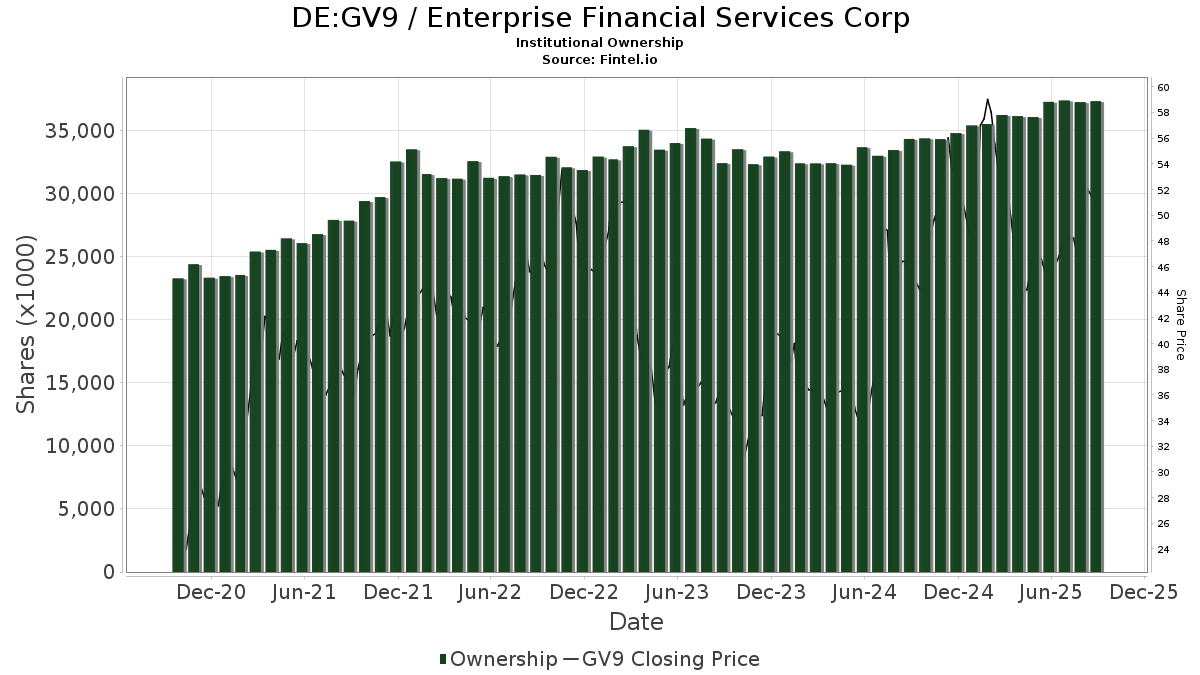
| Institutionelle aktier (lange) | 27.270.202 - 74,55% (ex 13D/G) - change of -8,96MM shares -24,74% MRQ |
| Institutionel værdi (lang) | $ 1.407.201 USD ($1000) |
Institutionelt ejerskab og aktionærer
Enterprise Financial Services Corp (DE:GV9) har 242 institutionelle ejere og aktionærer, der har indsendt 13D/G- eller 13F-formularer til Securities Exchange Commission (SEC). Disse institutioner har i alt 27,270,202 aktier. Største aktionærer omfatter BlackRock, Inc., Vanguard Group Inc, Dimensional Fund Advisors Lp, Earnest Partners Llc, First Trust Advisors Lp, State Street Corp, Delaware Management Holdings, Inc., Thrivent Financial For Lutherans, Geode Capital Management, Llc, and American Century Companies Inc .
Enterprise Financial Services Corp (DB:GV9) institutionel ejerskabsstruktur viser aktuelle positioner i virksomheden efter institutioner og fonde, samt seneste ændringer i positionsstørrelse. Større aktionærer kan omfatte individuelle investorer, investeringsforeninger, hedgefonde eller institutioner. Skema 13D angiver, at investoren besidder (eller besidder) mere end 5 % af virksomheden og har til hensigt (eller har til hensigt at) aktivt at forfølge en ændring i forretningsstrategi. Skema 13G indikerer en passiv investering på over 5%.
The share price as of April 29, 2026 is 49,60 / share. Previously, on May 2, 2025, the share price was 45,60 / share. This represents an increase of 8,77% over that period.
Fondens stemningsscore
Fund Sentiment Score (fka Ownership Accumulation Score) finder de aktier, der bliver mest købt af fonde. Det er resultatet af en sofistikeret, multi-faktor kvantitativ model, der identificerer virksomheder med de højeste niveauer af institutionel akkumulering. Scoringsmodellen bruger en kombination af den samlede stigning i oplyste ejere, ændringerne i porteføljeallokeringer i disse ejere og andre målinger. Tallet går fra 0 til 100, hvor højere tal indikerer et højere niveau af akkumulering for sine jævnaldrende, og 50 er gennemsnittet.
Opdateringsfrekvens: Dagligt
Se Ownership Explorer, som giver en liste over højest rangerende virksomheder.
AI+ Ask Fintel’s AI assistant about Enterprise Financial Services Corp.
Select a question to share a public post with an AI-crafted answer.
Thinking of good questions…
13F og NPORT arkivering
Detaljer om 13F-arkivering er gratis. Detaljer om NP-ansøgninger kræver et premium-medlemskab. Grønne rækker angiver nye positioner. Røde rækker angiver lukkede positioner. Klik på linket ikon for at se den fulde transaktionshistorik.
Opgrader
for at låse premium-data op og eksportere til Excel ![]() .
.
| Fil dato | Kilde | Investor | Type | Gennemsnitlig pris (Øst) |
Aktier | Δ Aktier (%) |
Rapporteret Værdi ($1000) |
Δ Værdi (%) |
Port Alloc (%) |
|
|---|---|---|---|---|---|---|---|---|---|---|
| 2026-04-15 | 13F | Atwood & Palmer Inc | 2.460 | 0,00 | 133 | 0,76 | ||||
| 2026-02-09 | 13F | William Blair Investment Management, Llc | 246.029 | -57,43 | 13.286 | -60,36 | ||||
| 2026-04-09 | 13F | Acropolis Investment Management, LLC | 31.105 | 0,00 | 1.683 | 0,24 | ||||
| 2025-11-14 | 13F | ExodusPoint Capital Management, LP | 35.078 | 2.034 | ||||||
| 2026-02-17 | 13F | Susquehanna International Group, Llp | 35.595 | 2,56 | 1.922 | -4,47 | ||||
| 2026-02-03 | 13F | Orion Capital Management LLC | 1 | 0,00 | 0 | |||||
| 2026-04-13 | 13F | IFP Advisors, Inc | 81 | 0,00 | 4 | 0,00 | ||||
| 2026-04-30 | 13F | Teacher Retirement System Of Texas | 10.196 | -3,42 | 552 | -3,33 | ||||
| 2026-02-13 | 13F | Charles Schwab Investment Management Inc | 435.528 | -3,51 | 23.519 | -10,14 | ||||
| 2026-04-28 | 13F | Harbor Capital Advisors, Inc. | 0 | -100,00 | 0 | |||||
| 2026-02-17 | 13F | Cambria Investment Management, L.P. | 11.697 | 16,97 | 632 | 8,98 | ||||
| 2026-01-28 | 13F | DekaBank Deutsche Girozentrale | 10.317 | 0,00 | 0 | |||||
| 2026-02-17 | 13F | Engineers Gate Manager LP | 0 | -100,00 | 0 | |||||
| 2026-02-17 | 13F | Russell Investments Group, Ltd. | 140.629 | 8,96 | 7.594 | 1,47 | ||||
| 2026-02-12 | 13F | Wealthspire Advisors, LLC | 0 | -100,00 | 0 | |||||
| 2026-02-17 | 13F | Citadel Advisors Llc | 48.607 | 9,87 | 2.625 | 2,30 | ||||
| 2026-04-13 | 13F | Clayton Financial Group LLC | 10.000 | 0,00 | 541 | 0,19 | ||||
| 2026-02-13 | 13F | BNP Paribas Asset Management Holding S.A. | 617 | 0 | ||||||
| 2026-02-10 | 13F | PL Capital Advisors, LLC | 733.329 | 4,94 | 39.600 | -2,27 | ||||
| 2025-11-21 | 13F/A | CIBC Bancorp USA Inc. | 3.912 | 227 | ||||||
| 2026-01-27 | 13F | TD Waterhouse Canada Inc. | 265 | 0,00 | 14 | -6,67 | ||||
| 2026-02-17 | 13F | Qube Research & Technologies Ltd | 321.732 | 104,22 | 17.374 | 90,20 | ||||
| 2026-02-17 | 13F | Susquehanna Portfolio Strategies, LLC | 23.729 | -21,80 | 1.281 | -27,17 | ||||
| 2026-02-17 | 13F | Alliancebernstein L.p. | 37.343 | 0,00 | 2.017 | -6,88 | ||||
| 2026-02-13 | 13F | Macquarie Group Ltd | 0 | -100,00 | 0 | |||||
| 2026-02-09 | 13F | Emerald Advisers, Llc | 530 | 0,00 | 29 | -6,67 | ||||
| 2026-02-09 | 13F | Geode Capital Management, Llc | 946.996 | 0,46 | 51.146 | -6,43 | ||||
| 2026-02-13 | 13F | Maltese Capital Management Llc | 55.559 | -30,55 | 3.000 | -35,32 | ||||
| 2026-02-13 | 13F | Wells Fargo & Company/mn | 109.430 | 10,78 | 5.909 | 3,18 | ||||
| 2026-02-13 | 13F | Arrowstreet Capital, Limited Partnership | 0 | -100,00 | 0 | |||||
| 2026-02-10 | 13F | Quantbot Technologies LP | 11.463 | 619 | ||||||
| 2026-02-13 | 13F | Panagora Asset Management Inc | 23.195 | -26,39 | 1.253 | -31,43 | ||||
| 2025-11-14 | 13F | Cubist Systematic Strategies, LLC | 0 | -100,00 | 0 | |||||
| 2026-04-23 | 13F | Cornerstone Wealth Management, LLC | 13.556 | 0,07 | 734 | 0,27 | ||||
| 2026-02-11 | 13F | Jpmorgan Chase & Co | 363.088 | -7,92 | 19.607 | -14,24 | ||||
| 2026-04-16 | 13F | SG Americas Securities, LLC | 65.832 | 123,13 | 4 | 200,00 | ||||
| 2026-01-23 | 13F | Rsm Us Wealth Management Llc | 8.390 | 0,43 | 462 | -4,55 | ||||
| 2026-02-17 | 13F | Public Employees Retirement System Of Ohio | 4.810 | 0,27 | 260 | -6,83 | ||||
| 2026-04-23 | 13F | SJS Investment Consulting Inc. | 3 | 0,00 | 0 | |||||
| 2026-01-23 | 13F | Robeco Institutional Asset Management B.V. | 0 | -100,00 | 0 | |||||
| 2026-02-17 | 13F | Janus Henderson Group Plc | 16.575 | 0,00 | 895 | -6,97 | ||||
| 2026-02-17 | 13F | Guggenheim Capital Llc | 29.635 | -1,81 | 1.600 | -8,52 | ||||
| 2026-02-13 | 13F | Victory Capital Management Inc | 4.177 | -70,02 | 226 | -72,12 | ||||
| 2026-02-17 | 13F | Tudor Investment Corp Et Al | 72.905 | 249,10 | 3.937 | 225,29 | ||||
| 2026-04-29 | 13F | Connable Office Inc | 6.607 | -16,43 | 358 | -16,20 | ||||
| 2026-02-13 | 13F | Squarepoint Ops LLC | 7.080 | -25,13 | 382 | -30,29 | ||||
| 2025-11-14 | 13F | DRW Securities, LLC | 0 | -100,00 | 0 | -100,00 | ||||
| 2026-02-02 | 13F | Mutual Advisors, LLC | 24.067 | -0,02 | 1.300 | -0,76 | ||||
| 2026-02-12 | 13F | Campbell & CO Investment Adviser LLC | 58.675 | 3.168 | ||||||
| 2026-02-13 | 13F | Morgan Stanley | 136.479 | 10,91 | 7.370 | 3,29 | ||||
| 2026-02-13 | 13F | Dynamic Technology Lab Private Ltd | 0 | -100,00 | 0 | |||||
| 2026-04-30 | 13F | Nuveen, LLC | 259.048 | 3,42 | 14.017 | 3,63 | ||||
| 2026-02-17 | 13F | Elizabeth Park Capital Advisors, Ltd. | 0 | -100,00 | 0 | |||||
| 2026-01-30 | 13F | Us Bancorp \de\ | 3.974 | -1,44 | 215 | -8,15 | ||||
| 2026-02-13 | 13F | Verition Fund Management LLC | 28.755 | 1.553 | ||||||
| 2026-02-03 | 13F | SBI Securities Co., Ltd. | 0 | -100,00 | 0 | |||||
| 2026-02-13 | 13F | LM Advisors LLC | 585 | -94,60 | 11 | |||||
| 2026-01-28 | 13F | Chicago Partners Investment Group LLC | 4.440 | 0,50 | 247 | 3,36 | ||||
| 2026-04-08 | 13F | Wealth Enhancement Advisory Services, Llc | 0 | -100,00 | 0 | |||||
| 2026-04-07 | 13F | CoreCap Advisors, LLC | 2 | 0 | ||||||
| 2026-01-26 | 13F | Cwm, Llc | 1.739 | -41,90 | 0 | |||||
| 2026-02-09 | 13F | Knights of Columbus Asset Advisors LLC | 19.488 | -52,92 | 1.052 | -56,17 | ||||
| 2026-04-23 | 13F | Peregrine Capital Management Llc | 84.335 | -8,78 | 4.563 | -8,59 | ||||
| 2026-01-14 | 13F | Enterprise Financial Services Corp | 331.579 | -7,83 | 17.905 | -14,16 | ||||
| 2026-04-22 | 13F | Western Financial Corp/CA | 576.505 | -0,15 | 31.195 | 0,05 | ||||
| 2026-02-12 | 13F | Voya Investment Management Llc | 6.798 | 0,00 | 367 | -6,85 | ||||
| 2026-02-13 | 13F | Parkside Financial Bank & Trust | 4.874 | 26,01 | 263 | 17,41 | ||||
| 2026-04-30 | 13F | Mosaic Family Wealth Partners, Llc | 32.696 | 1.769 | ||||||
| 2026-02-10 | 13F | Mutual Of America Capital Management Llc | 130.038 | -4,73 | 7.022 | -11,27 | ||||
| 2026-02-13 | 13F | SRS Capital Advisors, Inc. | 83 | -98,34 | 4 | -98,62 | ||||
| 2026-02-13 | 13F | Boston Partners | 108.294 | 5,99 | 5.848 | -1,30 | ||||
| 2026-02-10 | 13F | Bank of New York Mellon Corp | 167.837 | -4,17 | 9.063 | -10,74 | ||||
| 2026-02-13 | 13F | State Street Corp | 1.271.888 | -2,49 | 68.682 | -9,19 | ||||
| 2026-02-12 | 13F | Dimensional Fund Advisors Lp | 2.122.854 | -0,40 | 114.636 | -7,24 | ||||
| 2026-04-29 | 13F | Duncker Streett & Co Inc | 1.100 | 0,00 | 60 | 0,00 | ||||
| 2026-02-13 | 13F | Stifel Financial Corp | 20.613 | -1,94 | 1.113 | -8,62 | ||||
| 2026-02-10 | 13F | Savant Capital, LLC | 0 | -100,00 | 0 | |||||
| 2026-02-12 | 13F | New York State Common Retirement Fund | 68.451 | 3,74 | 3.696 | -3,37 | ||||
| 2026-02-17 | 13F | Quantinno Capital Management LP | 8.750 | 1,63 | 473 | -5,41 | ||||
| 2026-02-17 | 13F | Wellington Management Group Llp | 0 | -100,00 | 0 | |||||
| 2026-02-10 | 13F | Weaver Consulting Group | 5.612 | 0,00 | 303 | -6,77 | ||||
| 2026-02-04 | 13F | Midwest Trust Co | 38.647 | -1,41 | 2.087 | -8,19 | ||||
| 2026-02-17 | 13F | Balyasny Asset Management Llc | 3.966 | -45,88 | 214 | -49,53 | ||||
| 2026-02-14 | 13F | Rockefeller Capital Management L.P. | 374 | 484,38 | 20 | 566,67 | ||||
| 2026-04-14 | 13F | Opal Wealth Advisors, LLC | 554 | 30 | ||||||
| 2026-02-04 | 13F | Ameritas Advisory Services, LLC | 0 | -100,00 | 0 | |||||
| 2025-11-14 | 13F | Nomura Holdings Inc | 0 | -100,00 | 0 | |||||
| 2025-11-13 | 13F | Hsbc Holdings Plc | 0 | -100,00 | 0 | |||||
| 2026-02-13 | 13F | Healthcare Of Ontario Pension Plan Trust Fund | 39.875 | 2.153 | ||||||
| 2026-02-12 | 13F | Moneta Group Investment Advisors Llc | 95.617 | -2,71 | 5.163 | -9,39 | ||||
| 2026-02-04 | 13F | First Foundation Advisors | 5.870 | 0,00 | 317 | -7,06 | ||||
| 2026-02-13 | 13F | Mariner, LLC | 11.413 | -16,35 | 616 | -22,12 | ||||
| 2026-04-24 | 13F | Root Financial Partners, LLC | 107 | 143,18 | 6 | 150,00 | ||||
| 2026-02-11 | 13F | Empowered Funds, LLC | 152.610 | 7,77 | 8.241 | 0,37 | ||||
| 2026-02-17 | 13F | Aqr Capital Management Llc | 50.952 | -29,22 | 2.751 | -34,09 | ||||
| 2026-02-13 | 13F | Prudential Financial Inc | 27.257 | -8,11 | 1.472 | -14,43 | ||||
| 2026-02-17 | 13F | MIRAE ASSET GLOBAL ETFS HOLDINGS Ltd. | 17.058 | 0,32 | 921 | -6,50 | ||||
| 2026-04-30 | 13F | LRI Investments, LLC | 110 | 0,00 | 6 | 0,00 | ||||
| 2026-02-11 | 13F | CSM Advisors, LLC | 11.341 | 38,29 | 1 | |||||
| 2026-02-13 | 13F | Kennedy Capital Management, Inc. | 218.512 | 20,08 | 11.800 | 11,83 | ||||
| 2026-02-13 | 13F | Martingale Asset Management L P | 0 | -100,00 | 0 | |||||
| 2026-02-09 | 13F | Hartland & Co., LLC | 0 | -100,00 | 0 | |||||
| 2026-02-11 | 13F | Ameritas Investment Partners, Inc. | 3.066 | 166 | ||||||
| 2026-04-14 | 13F | Plancorp, LLC | 92.536 | 0,02 | 5.355 | 7,21 | ||||
| 2026-02-06 | 13F | Larson Financial Group LLC | 4 | 0,00 | 0 | |||||
| 2026-02-17 | 13F | Mirabella Financial Services Llp | 7.564 | 408 | ||||||
| 2026-01-13 | 13F | Dakota Wealth Management | 4.048 | 0,00 | 219 | -6,84 | ||||
| 2026-02-13 | 13F | Rafferty Asset Management, LLC | 23.474 | -18,74 | 1.268 | -24,31 | ||||
| 2026-02-11 | 13F | Deutsche Bank Ag\ | 29.034 | 5,60 | 1.568 | -1,69 | ||||
| 2025-11-14 | 13F | Graham Capital Management, L.P. | 0 | -100,00 | 0 | |||||
| 2026-04-10 | 13F | Pure Financial Advisors, Inc. | 6.134 | 0,36 | 332 | 0,30 | ||||
| 2026-02-12 | 13F | Swiss National Bank | 72.964 | 1,96 | 3.940 | -5,04 | ||||
| 2026-04-07 | 13F | Signaturefd, Llc | 806 | -0,74 | 44 | 0,00 | ||||
| 2026-02-03 | 13F | Denali Advisors Llc | 140.800 | 11,83 | 7.603 | 4,16 | ||||
| 2025-11-14 | 13F | AXA Investment Managers S.A. | 67.921 | 3.938 | ||||||
| 2026-04-29 | 13F | Police & Firemen's Retirement System of New Jersey | 10.181 | 0,00 | 551 | 0,18 | ||||
| 2026-02-13 | 13F | Smartleaf Asset Management LLC | 338 | 112,58 | 19 | 100,00 | ||||
| 2026-04-29 | 13F | Klp Kapitalforvaltning As | 8.300 | 5,06 | 449 | 5,40 | ||||
| 2026-04-23 | 13F | Oppenheimer Asset Management Inc. | 23.402 | -1,85 | 1.266 | -1,63 | ||||
| 2026-02-05 | 13F | Thrivent Financial For Lutherans | 995.541 | 2,68 | 54 | -5,36 | ||||
| 2026-01-29 | 13F | UBS Group AG | 72.012 | -3,34 | 3.889 | -9,98 | ||||
| 2026-02-05 | 13F | HFM Investment Advisors, LLC | 1 | 0,00 | 0 | |||||
| 2026-02-13 | 13F | Sei Investments Co | 69.068 | -0,35 | 3.730 | -7,19 | ||||
| 2026-02-17 | 13F | California State Teachers Retirement System | 35.498 | 2,94 | 1.917 | -4,15 | ||||
| 2026-04-16 | 13F | Fiduciary Advisors, Inc. | 301 | 0,67 | 16 | 0,00 | ||||
| 2026-02-03 | 13F | F/M Investments LLC | 86.597 | -2,67 | 4.676 | -9,34 | ||||
| 2026-02-13 | 13F | Entropy Technologies, LP | 4.600 | 248 | ||||||
| 2026-02-17 | 13F | Lazard Asset Management Llc | 24.852 | 3,89 | 1.342 | -3,17 | ||||
| 2026-01-28 | 13F | Universal- Beteiligungs- und Servicegesellschaft mbH | 126.717 | 1,04 | 6.843 | -5,90 | ||||
| 2026-02-13 | 13F | Ieq Capital, Llc | 0 | -100,00 | 0 | |||||
| 2026-04-10 | 13F | Daytona Street Capital LLC | 2.830 | 0,00 | 156 | 2,63 | ||||
| 2026-04-24 | 13F | Strs Ohio | 16.200 | 51,40 | 877 | 51,82 | ||||
| 2026-04-20 | 13F | State of Alaska, Department of Revenue | 1.672 | 0,00 | 0 | |||||
| 2025-11-07 | 13F | Shell Asset Management Co | 1.609 | -60,78 | 0 | |||||
| 2026-01-26 | 13F | KBC Group NV | 1.542 | 0,00 | 0 | |||||
| 2026-02-17 | 13F | Advisor Group Holdings, Inc. | 24.075 | 0,38 | 1.300 | -11,38 | ||||
| 2026-01-30 | 13F | New York State Teachers Retirement System | 0 | -100,00 | 0 | |||||
| 2026-04-30 | 13F | First Horizon Corp | 548 | -22,60 | 30 | -23,68 | ||||
| 2026-02-09 | 13F | Endeavour Capital Advisors Inc | 185.240 | 109,75 | 10.003 | 95,35 | ||||
| 2026-02-17 | 13F | Northern Trust Corp | 355.909 | -7,13 | 19.219 | -13,50 | ||||
| 2026-02-11 | 13F | Rise Advisors, LLC | 0 | -100,00 | 0 | |||||
| 2026-02-17 | 13F | Raymond James Financial Inc | 81.736 | -24,96 | 4.478 | -29,11 | ||||
| 2025-11-17 | 13F | PharVision Advisers, LLC | 0 | -100,00 | 0 | |||||
| 2026-02-05 | 13F | Amalgamated Bank | 1.153 | -9,85 | 0 | |||||
| 2026-02-12 | 13F | Cibc World Markets Corp | 0 | -100,00 | 0 | |||||
| 2026-04-13 | 13F | True Wealth Design, LLC | 103 | -4,63 | 6 | 0,00 | ||||
| 2026-01-16 | 13F | Claris Advisors, Llc / Mo / | 0 | -100,00 | 0 | |||||
| 2026-02-10 | 13F | Bnp Paribas Arbitrage, Sa | 8.038 | 10,84 | 434 | 3,33 | ||||
| 2026-04-06 | 13F | GAMMA Investing LLC | 126 | 63,64 | 7 | 50,00 | ||||
| 2026-02-10 | 13F | Goldman Sachs Group Inc | 187.911 | 12,93 | 10.147 | 5,18 | ||||
| 2026-02-13 | 13F | Great West Life Assurance Co /can/ | 3.276 | -75,17 | 0 | |||||
| 2026-02-18 | 13F | EP Wealth Advisors, Inc. | 5.600 | 2,25 | 302 | 0,33 | ||||
| 2025-11-14 | 13F | Axa S.a. | 0 | -100,00 | 0 | |||||
| 2026-01-26 | 13F/A | Phocas Financial Corp. | 133.505 | -0,24 | 7.209 | -7,09 | ||||
| 2026-02-13 | 13F | Commerce Bank | 21.465 | 0,00 | 1.159 | -6,83 | ||||
| 2026-04-27 | 13F | Td Private Client Wealth Llc | 0 | -100,00 | 0 | |||||
| 2026-02-09 | 13F | Hantz Financial Services, Inc. | 76 | 0,00 | 0 | |||||
| 2026-02-13 | 13F | Rhumbline Advisers | 52.296 | -13,25 | 2.824 | -19,23 | ||||
| 2026-02-13 | 13F | Jacobs Levy Equity Management, Inc | 19.715 | -3,17 | 1.065 | -9,83 | ||||
| 2026-02-10 | 13F | Hillsdale Investment Management Inc. | 0 | -100,00 | 0 | |||||
| 2026-02-13 | 13F | Ubs Asset Management Americas Inc | 93.202 | 3,44 | 5.033 | -3,66 | ||||
| 2026-02-13 | 13F | Quarry LP | 108 | -56,97 | 6 | -64,29 | ||||
| 2026-04-20 | 13F | Ronald Blue Trust, Inc. | 8 | 0 | ||||||
| 2026-04-23 | 13F | CBOE Vest Financial, LLC | 89.386 | -14,22 | 4.837 | -14,06 | ||||
| 2025-11-14 | 13F | Centiva Capital, LP | 0 | -100,00 | 0 | |||||
| 2026-02-12 | 13F | Advisors Asset Management, Inc. | 4.043 | -25,06 | 218 | -30,13 | ||||
| 2025-11-12 | 13F | Simplex Trading, Llc | Call | 0 | -100,00 | 0 | ||||
| 2026-02-17 | 13F | Fmr Llc | 7.465 | 130,12 | 403 | 114,36 | ||||
| 2026-02-13 | 13F | MAI Capital Management | 40.276 | 0,17 | 2.175 | -6,74 | ||||
| 2026-04-07 | 13F | Farther Finance Advisors, LLC | 96 | 9,09 | 5 | 25,00 | ||||
| 2026-02-09 | 13F | Legal & General Group Plc | 36.109 | -6,83 | 1.950 | -13,26 | ||||
| 2026-02-12 | 13F | State Board Of Administration Of Florida Retirement System | 10.275 | 0,00 | 555 | -6,89 | ||||
| 2026-02-05 | 13F | Atria Investments Llc | 4.191 | -29,52 | 226 | -34,30 | ||||
| 2026-04-13 | 13F | Massmutual Trust Co Fsb/adv | 7 | 0,00 | 0 | |||||
| 2026-01-29 | 13F | Vanguard Group Inc | 2.371.519 | 0,59 | 128.062 | -6,31 | ||||
| 2026-02-17 | 13F | Susquehanna International Group, Llp | Call | 0 | -100,00 | 0 | ||||
| 2026-04-24 | 13F | Keybank National Association/oh | 7.623 | -4,72 | 412 | -4,63 | ||||
| 2026-02-17 | 13F | Two Sigma Investments, Lp | 6.680 | 63,73 | 361 | 52,54 | ||||
| 2026-02-17 | 13F | Jones Financial Companies Lllp | 392 | -32,53 | 21 | -38,24 | ||||
| 2026-02-17 | 13F | Aquatic Capital Management LLC | 9.073 | 44,82 | 490 | 34,71 | ||||
| 2026-02-19 | 13F | Invesco Ltd. | 52.887 | -16,34 | 2.856 | -22,10 | ||||
| 2026-02-17 | 13F | Cetera Investment Advisers | 9.101 | -22,45 | 491 | -27,79 | ||||
| 2026-04-23 | 13F | MQS Management LLC | 0 | -100,00 | 0 | |||||
| 2026-02-06 | 13F | EverSource Wealth Advisors, LLC | 470 | -39,35 | 25 | -43,18 | ||||
| 2026-02-17 | 13F | Ameriprise Financial Inc | 41.077 | -37,26 | 2.218 | -41,57 | ||||
| 2026-02-17 | 13F | Captrust Financial Advisors | 0 | -100,00 | 0 | |||||
| 2026-02-02 | 13F | Principal Financial Group Inc | 36.225 | 41,89 | 1.956 | 32,16 | ||||
| 2026-02-17 | 13F | Millennium Management Llc | 105.077 | 2.090,93 | 5.674 | 1.941,01 | ||||
| 2026-04-20 | 13F | Jfs Wealth Advisors, Llc | 10 | 0,00 | 1 | |||||
| 2026-01-27 | 13F | Zurcher Kantonalbank (Zurich Cantonalbank) | 13.490 | 0,00 | 728 | -6,91 | ||||
| 2026-02-12 | 13F | MetLife Investment Management, LLC | 20.872 | -3,81 | 1.127 | -10,41 | ||||
| 2026-02-11 | 13F | Franklin Resources Inc | 54.564 | 3,46 | 2.946 | -3,63 | ||||
| 2026-02-17 | 13F | First Manhattan Co | 0 | -100,00 | 0 | |||||
| 2026-04-30 | 13F | Clear Street Markets Llc | 295 | 16 | ||||||
| 2026-02-12 | 13F | Alps Advisors Inc | 7.598 | 0,85 | 410 | -5,96 | ||||
| 2026-02-10 | 13F | Lido Advisors, LLC | 6.369 | 0,00 | 369 | 0,00 | ||||
| 2026-02-09 | 13F | Fisher Asset Management, LLC | 133.166 | -17,22 | 7.191 | -22,91 | ||||
| 2026-04-30 | 13F | Kestra Advisory Services, LLC | 0 | -100,00 | 0 | |||||
| 2026-02-12 | 13F | Earnest Partners Llc | 1.488.421 | -5,50 | 80.375 | -11,99 | ||||
| 2026-02-17 | 13F | Mercer Global Advisors Inc /adv | 9.442 | 0,55 | 510 | -6,43 | ||||
| 2026-02-13 | 13F | Visionary Wealth Advisors | 38.484 | -19,97 | 2.078 | -25,47 | ||||
| 2026-02-17 | 13F | Creative Planning | 50.425 | -9,91 | 2.723 | -16,12 | ||||
| 2026-04-28 | 13F | Westfuller Advisors, LLC | 23 | -30,30 | 1 | 0,00 | ||||
| 2026-02-12 | 13F | Brown Brothers Harriman & Co | 89 | 5 | ||||||
| 2026-02-05 | 13F | Wakefield Asset Management LLLP | 0 | -100,00 | 0 | |||||
| 2026-03-17 | 13F | Cornerstone Planning, LLC | 5.746 | -8,09 | 310 | -11,93 | ||||
| 2026-04-27 | 13F | Meramec Financial Planners, LLC | 6.036 | 0,00 | 353 | -2,22 | ||||
| 2025-11-14 | 13F | XTX Topco Ltd | 0 | -100,00 | 0 | -100,00 | ||||
| 2026-01-30 | 13F | Jennison Associates Llc | 621.824 | -1,69 | 33.578 | -8,44 | ||||
| 2026-02-11 | 13F | Los Angeles Capital Management Llc | 202 | 11 | ||||||
| 2026-02-05 | 13F | Convergence Investment Partners, LLC | 0 | -100,00 | 0 | |||||
| 2026-02-13 | 13F | Colony Group, LLC | 6.716 | -4,32 | 363 | -12,35 | ||||
| 2026-04-07 | 13F | Eastern Bank | 228 | 0,00 | 12 | 0,00 | ||||
| 2026-04-22 | 13F | Pictet Asset Management Holding SA | 6.190 | 17,59 | 335 | 17,61 | ||||
| 2026-02-10 | 13F | Intech Investment Management Llc | 15.988 | 0,00 | 863 | -6,80 | ||||
| 2026-02-17 | 13F | Jump Financial, LLC | 4.639 | 251 | ||||||
| 2026-02-10 | 13F | Connor, Clark & Lunn Investment Management Ltd. | 20.665 | -32,87 | 1.116 | -37,50 | ||||
| 2025-11-13 | 13F | Renaissance Technologies Llc | 0 | -100,00 | 0 | |||||
| 2026-02-13 | 13F | Manufacturers Life Insurance Company, The | 0 | -100,00 | 0 | |||||
| 2026-02-20 | 13F | Sunbelt Securities, Inc. | 45 | 0,00 | 2 | 0,00 | ||||
| 2026-02-17 | 13F | Royal Bank Of Canada | 2.089 | -71,85 | 113 | -73,72 | ||||
| 2026-02-17 | 13F | Delaware Management Holdings, Inc. | 1.057.697 | 57.116 | ||||||
| 2026-02-13 | 13F | Cullen Capital Management, LLC | 6.681 | 0,00 | 361 | -6,98 | ||||
| 2026-02-02 | 13F | Danske Bank A/s | 100 | 0,00 | 5 | 0,00 | ||||
| 2026-02-06 | 13F | Jag Capital Management, Llc | 12.185 | 7,49 | 658 | 0,15 | ||||
| 2026-02-10 | 13F | Globeflex Capital L P | 14.579 | -14,84 | 787 | -20,67 | ||||
| 2026-02-11 | 13F | Cerity Partners LLC | 5.103 | 1,88 | 276 | -5,17 | ||||
| 2026-01-15 | 13F | Allspring Global Investments Holdings, LLC | 6.392 | 9,58 | 345 | 3,29 | ||||
| 2026-04-21 | 13F | Maseco Llp | 0 | -100,00 | 0 | |||||
| 2026-02-02 | 13F | Fifth Third Bancorp | 0 | -100,00 | 0 | |||||
| 2026-02-10 | 13F/A | Northwestern Mutual Wealth Management Co | 844 | 1,32 | 46 | -6,25 | ||||
| 2026-01-12 | 13F | Rialto Wealth Management, LLC | 1 | 0,00 | 0 | |||||
| 2026-02-17 | 13F | Canada Pension Plan Investment Board | 6.000 | 324 | ||||||
| 2026-02-09 | 13F | Quest Partners LLC | 49.847 | 250,15 | 2.692 | 226,18 | ||||
| 2026-02-10 | 13F | Eurizon Capital SGR S.p.A. | 147 | 8 | ||||||
| 2026-02-13 | 13F | Marshall Wace, Llp | 7.277 | 393 | ||||||
| 2026-02-13 | 13F | First Trust Advisors Lp | 1.471.244 | 6,03 | 79.447 | -1,25 | ||||
| 2026-04-15 | 13F | Fortitude Family Office, LLC | 5 | 150,00 | 0 | |||||
| 2026-04-22 | 13F | Sterling Capital Management LLC | 6.621 | -37,81 | 358 | -37,63 | ||||
| 2026-01-28 | 13F | Arizona State Retirement System | 10.338 | -5,18 | 558 | -11,71 | ||||
| 2026-02-05 | 13F | Allworth Financial LP | 31 | -72,57 | 2 | -83,33 | ||||
| 2026-02-17 | 13F | Tower Research Capital LLC (TRC) | 1.250 | -14,73 | 68 | -20,24 | ||||
| 2026-02-11 | 13F | LPL Financial LLC | 6.296 | -7,14 | 340 | -13,74 | ||||
| 2026-04-28 | 13F | Busey Wealth Management | 15.241 | -0,65 | 825 | -0,48 | ||||
| 2026-02-10 | 13F | Rothschild Investment Llc | 22 | -26,67 | 1 | 0,00 | ||||
| 2026-02-13 | 13F | American Century Companies Inc | 936.856 | 1,85 | 50.590 | -5,14 | ||||
| 2026-02-10 | 13F | Envestnet Asset Management Inc | 80.875 | -27,22 | 4.367 | -32,21 | ||||
| 2026-04-24 | 13F | ProShare Advisors LLC | 5.319 | -20,69 | 288 | -20,72 | ||||
| 2026-02-11 | 13F | Brandywine Global Investment Management, LLC | 66.111 | -3,50 | 3.570 | -10,15 | ||||
| 2026-04-28 | 13F | Handelsbanken Fonder AB | 9.537 | 29,99 | 1 | |||||
| 2026-02-17 | 13F | Optiver Holding B.V. | 104 | -49,51 | 6 | -54,55 | ||||
| 2026-04-17 | 13F | Bell Investment Advisors, Inc | 23 | 0,00 | 1 | 0,00 | ||||
| 2026-02-13 | 13F | Citigroup Inc | 24.687 | -3,37 | 1.333 | -9,99 | ||||
| 2026-02-06 | 13F | Pnc Financial Services Group, Inc. | 299 | -88,26 | 16 | -89,12 | ||||
| 2025-11-03 | 13F | Hussman Strategic Advisors, Inc. | 0 | -100,00 | 0 | |||||
| 2026-04-30 | 13F | Torren Management, LLC | 12 | 9,09 | 1 | |||||
| 2026-02-05 | 13F | Bessemer Group Inc | 0 | -100,00 | 0 | |||||
| 2026-02-12 | 13F | Cloud Capital Management, LLC | 0 | -100,00 | 0 | |||||
| 2026-02-17 | 13F | Hotchkis & Wiley Capital Management Llc | 165.454 | 0,74 | 8.935 | -6,18 | ||||
| 2026-04-06 | 13F | Versant Capital Management, Inc | 511 | 0,00 | 28 | 0,00 | ||||
| 2026-02-13 | 13F | Umb Bank N A/mo | 214 | 0,00 | 12 | -8,33 | ||||
| 2026-02-17 | 13F | Bridgeway Capital Management Inc | 316.875 | -2,88 | 17.111 | -9,55 | ||||
| 2026-02-06 | 13F | Bare Financial Services, Inc | 23 | 64,29 | 1 | |||||
| 2026-02-17 | 13F | Bank Of America Corp /de/ | 376.088 | 3,44 | 20.309 | -3,66 | ||||
| 2026-04-21 | 13F | Trilogy Capital Inc. | 5.468 | 0,00 | 296 | 0,00 | ||||
| 2026-04-29 | 13F | CVA Family Office, LLC | 11 | 1 | ||||||
| 2026-04-27 | 13F | Y-Intercept (Hong Kong) Ltd | 8.352 | 2,69 | 452 | 2,73 | ||||
| 2026-01-29 | 13F | Teachers Retirement System Of The State Of Kentucky | 46.519 | -4,17 | 3 | 0,00 | ||||
| 2026-04-28 | 13F | Bogart Wealth, LLC | 30 | 0,00 | 2 | 0,00 | ||||
| 2026-03-03 | 13F/A | Integrated Investment Consultants, LLC | 4.678 | -0,02 | 253 | -7,01 | ||||
| 2026-02-13 | 13F | Nfj Investment Group, Llc | 178.250 | -3,54 | 9.626 | -10,16 | ||||
| 2026-02-17 | 13F/A | RBF Capital, LLC | 40.700 | 0,00 | 2.198 | -6,87 | ||||
| 2026-01-29 | 13F | Comerica Bank | 1.995 | -2,25 | 108 | -9,32 | ||||
| 2026-02-12 | 13F | Federated Hermes, Inc. | 2.890 | 9,84 | 156 | 2,63 | ||||
| 2026-02-17 | 13F | Price T Rowe Associates Inc /md/ | 36.767 | 7,89 | 2 | 0,00 | ||||
| 2026-02-13 | 13F | Barclays Plc | 78.182 | 21,23 | 4.222 | 12,89 | ||||
| 2026-02-13 | 13F | Aptus Capital Advisors, LLC | 234.247 | 0,44 | 12.649 | -6,46 | ||||
| 2025-11-04 | 13F | Jackson Creek Investment Advisors LLC | 0 | -100,00 | 0 | |||||
| 2026-02-09 | 13F | Keating Financial Advisory Services, Inc. | 5 | 0 | ||||||
| 2026-02-12 | 13F | Jane Street Group, Llc | 0 | -100,00 | 0 | |||||
| 2026-01-27 | 13F | Meritage Portfolio Management | 4.070 | 0,00 | 220 | -6,81 | ||||
| 2026-02-06 | 13F | Covestor Ltd | 155 | -0,64 | 0 | |||||
| 2026-04-20 | 13F | Courier Capital Llc | 6.416 | 0,00 | 347 | 0,29 | ||||
| 2026-02-11 | 13F | GW&K Investment Management, LLC | 41.759 | 2 | ||||||
| 2026-02-12 | 13F | BlackRock, Inc. | 3.423.887 | -0,66 | 184.890 | -7,48 | ||||
| 2026-02-04 | 13F | Bailard, Inc. | 5.000 | 270 | ||||||
| 2026-02-11 | 13F | Parallel Advisors, LLC | 54 | -22,86 | 3 | -50,00 | ||||
| 2026-02-12 | 13F | Quadrant Capital Group Llc | 2.317 | 1.113,09 | 125 | 1.036,36 | ||||
| 2026-01-27 | 13F | Hgk Asset Management Inc | 0 | -100,00 | 0 | |||||
| 2026-02-11 | 13F | Buckingham Strategic Partners | 0 | -100,00 | 0 | |||||
| 2026-02-19 | 13F | CI Private Wealth, LLC | 6.096 | 329 | ||||||
| 2026-04-30 | 13F | Nisa Investment Advisors, Llc | 272 | 0,00 | 15 | 0,00 | ||||
| 2025-11-12 | 13F | Aster Capital Management (DIFC) Ltd | 0 | -100,00 | 0 | -100,00 |
Other Listings
| US:EFSC | 57,78 $ |