Grundlæggende statistik
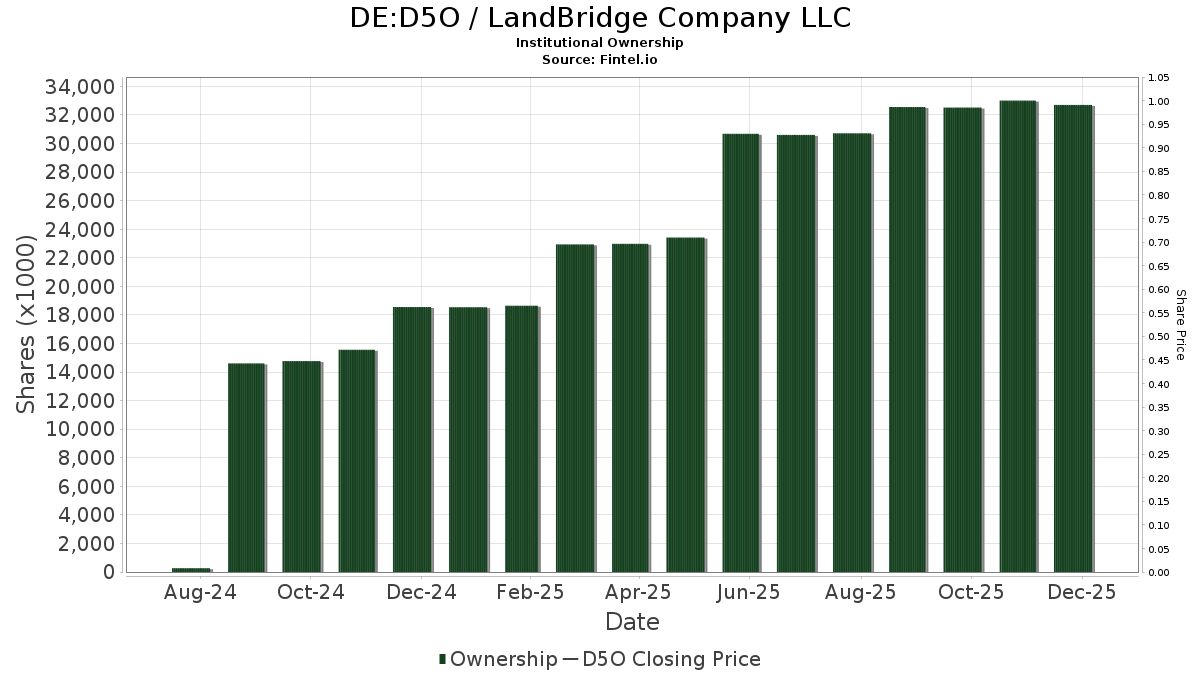
| Institutionelle aktier (lange) | 27.928.572 - 100,32% (ex 13D/G) - change of -4,79MM shares -14,64% MRQ |
| Institutionel værdi (lang) | $ 1.369.116 USD ($1000) |
Institutionelt ejerskab og aktionærer
LandBridge Company LLC (DE:D5O) har 169 institutionelle ejere og aktionærer, der har indsendt 13D/G- eller 13F-formularer til Securities Exchange Commission (SEC). Disse institutioner har i alt 27,928,572 aktier. Største aktionærer omfatter First Manhattan Co, Horizon Kinetics Asset Management Llc, Morgan Stanley, Vanguard Group Inc, Fmr Llc, William Blair Investment Management, Llc, VGSIX - Vanguard Real Estate Index Fund Investor Shares, Hood River Capital Management LLC, Schwartz Investment Counsel Inc, and Df Dent & Co Inc .
LandBridge Company LLC (DB:D5O) institutionel ejerskabsstruktur viser aktuelle positioner i virksomheden efter institutioner og fonde, samt seneste ændringer i positionsstørrelse. Større aktionærer kan omfatte individuelle investorer, investeringsforeninger, hedgefonde eller institutioner. Skema 13D angiver, at investoren besidder (eller besidder) mere end 5 % af virksomheden og har til hensigt (eller har til hensigt at) aktivt at forfølge en ændring i forretningsstrategi. Skema 13G indikerer en passiv investering på over 5%.
Fondens stemningsscore
Fund Sentiment Score (fka Ownership Accumulation Score) finder de aktier, der bliver mest købt af fonde. Det er resultatet af en sofistikeret, multi-faktor kvantitativ model, der identificerer virksomheder med de højeste niveauer af institutionel akkumulering. Scoringsmodellen bruger en kombination af den samlede stigning i oplyste ejere, ændringerne i porteføljeallokeringer i disse ejere og andre målinger. Tallet går fra 0 til 100, hvor højere tal indikerer et højere niveau af akkumulering for sine jævnaldrende, og 50 er gennemsnittet.
Opdateringsfrekvens: Dagligt
Se Ownership Explorer, som giver en liste over højest rangerende virksomheder.
AI+ Ask Fintel’s AI assistant about LandBridge Company LLC.
Select a question to share a public post with an AI-crafted answer.
Thinking of good questions…
13F og NPORT arkivering
Detaljer om 13F-arkivering er gratis. Detaljer om NP-ansøgninger kræver et premium-medlemskab. Grønne rækker angiver nye positioner. Røde rækker angiver lukkede positioner. Klik på linket ikon for at se den fulde transaktionshistorik.
Opgrader
for at låse premium-data op og eksportere til Excel ![]() .
.
| Fil dato | Kilde | Investor | Type | Gennemsnitlig pris (Øst) |
Aktier | Δ Aktier (%) |
Rapporteret Værdi ($1000) |
Δ Værdi (%) |
Port Alloc (%) |
|
|---|---|---|---|---|---|---|---|---|---|---|
| 2026-02-28 | 13F | NCM Capital Management, LLC | 4.900 | 28,95 | 240 | 18,81 | ||||
| 2026-02-13 | 13F | First Trust Advisors Lp | 0 | -100,00 | 0 | |||||
| 2026-02-17 | 13F | Captrust Financial Advisors | 267.982 | 0,23 | 13.128 | -7,96 | ||||
| 2026-02-12 | 13F | Quadrant Capital Group Llc | 85 | 4 | ||||||
| 2026-02-11 | 13F | Horizon Kinetics Asset Management Llc | 5.642.766 | 0,19 | 276.439 | -8,00 | ||||
| 2025-11-14 | 13F | Point72 Asia (Singapore) Pte. Ltd. | 3.341 | 430,32 | 178 | 323,81 | ||||
| 2026-02-17 | 13F | XTX Topco Ltd | 18.298 | 896 | ||||||
| 2026-02-17 | 13F | National Asset Management, Inc. | 5.921 | 30,97 | 290 | 20,33 | ||||
| 2026-01-26 | 13F | Atlas Wealth Partners, LLC | 37.433 | 6,84 | 1.834 | -1,93 | ||||
| 2026-02-13 | 13F | Santa Monica Partners Lp | 18.000 | -35,71 | 1 | -100,00 | ||||
| 2026-02-09 | 13F | Legal & General Group Plc | 16.104 | 4,85 | 789 | -3,79 | ||||
| 2025-10-22 | 13F | Gunderson Capital Management Inc. | 0 | -100,00 | 0 | |||||
| 2025-11-13 | 13F/A | Cynosure Management, Llc | 11.070 | 0,00 | 591 | -21,12 | ||||
| 2026-02-10 | 13F | Murphy & Mullick Capital Management Corp | 30 | 0,00 | 1 | 0,00 | ||||
| 2026-02-17 | 13F | Raymond James Financial Inc | 388.303 | -14,36 | 19.023 | -21,36 | ||||
| 2026-02-13 | 13F | Quattro Advisors LLC | 737 | 36 | ||||||
| 2026-02-17 | 13F | Two Sigma Advisers, Lp | 19.800 | -86,22 | 970 | -87,35 | ||||
| 2026-02-12 | 13F | Sprott Inc. | 85.193 | 14,56 | 4.174 | 5,19 | ||||
| 2026-02-17 | 13F | First Manhattan Co | 6.861.939 | 24,04 | 338.714 | 14,77 | ||||
| 2026-02-11 | 13F | Simplex Trading, Llc | 791 | -34,19 | 39 | |||||
| 2026-02-18 | 13F | Vident Advisory, LLC | 4.486 | 220 | ||||||
| 2026-02-17 | 13F | Aquatic Capital Management LLC | 0 | -100,00 | 0 | |||||
| 2026-02-11 | 13F | LPL Financial LLC | 15.321 | -52,41 | 751 | -56,32 | ||||
| 2026-02-13 | 13F | Pathstone Holdings, LLC | 7.885 | -0,42 | 386 | -8,53 | ||||
| 2026-02-11 | 13F | Jpmorgan Chase & Co | 5 | -16,67 | 0 | |||||
| 2026-01-20 | 13F | Quintet Private Bank (Europe) S.A. | 0 | -100,00 | 0 | |||||
| 2026-01-26 | 13F | Childress Capital Advisors, Llc | 6.800 | -17,58 | 333 | -24,32 | ||||
| 2026-02-12 | 13F | BlackRock, Inc. | 49.877 | 6,43 | 2.443 | -2,28 | ||||
| 2026-02-13 | 13F | Wells Fargo & Company/mn | 134.866 | 34,28 | 6.607 | 23,31 | ||||
| 2025-11-13 | 13F | Bnp Paribas Arbitrage, Sa | 0 | -100,00 | 0 | -100,00 | ||||
| 2025-11-14 | 13F | T. Rowe Price Investment Management, Inc. | 0 | -100,00 | 0 | |||||
| 2026-02-17 | 13F | one8zero8, LLC | 72.903 | 10,39 | 3.572 | 1,36 | ||||
| 2026-02-17 | 13F | Jones Financial Companies Lllp | 1.788 | 45,13 | 88 | 29,85 | ||||
| 2026-02-06 | 13F | EverSource Wealth Advisors, LLC | 78 | 4 | ||||||
| 2026-02-17 | 13F | California State Teachers Retirement System | 16.483 | 0,00 | 808 | -8,19 | ||||
| 2026-02-17 | 13F | Janus Henderson Group Plc | 9.025 | 0,00 | 442 | -8,32 | ||||
| 2026-02-09 | 13F | Geode Capital Management, Llc | 32.419 | 7,46 | 1.588 | -1,31 | ||||
| 2026-01-28 | 13F | Fairway Wealth LLC | 777 | 0,00 | 38 | -7,32 | ||||
| 2026-02-10 | 13F | State of Wyoming | 4.838 | -12,20 | 237 | -19,11 | ||||
| 2025-11-14 | 13F | Cubist Systematic Strategies, LLC | 59.733 | 27,29 | 3.187 | 0,47 | ||||
| 2026-02-13 | 13F | Zuckerman Investment Group, LLC | 0 | -100,00 | 0 | |||||
| 2025-11-14 | 13F | Lombard Odier Asset Management (USA) Corp | 0 | -100,00 | 0 | -100,00 | ||||
| 2025-09-26 | NP | ETTOX - E*TRADE No Fee Total Market Index Fund | 5 | 0,00 | 0 | |||||
| 2025-09-26 | NP | USMIX - Extended Market Index Fund | 2.726 | 0,78 | 155 | -21,03 | ||||
| 2026-02-17 | 13F | Balyasny Asset Management Llc | 42.735 | 107,09 | 2.094 | 90,27 | ||||
| 2026-01-28 | 13F | Klp Kapitalforvaltning As | 4.100 | 13,89 | 201 | 4,17 | ||||
| 2026-02-17 | 13F | Jump Financial, LLC | 0 | -100,00 | 0 | |||||
| 2026-02-12 | 13F | Triumph Capital Management | 100 | -28,57 | 5 | -42,86 | ||||
| 2026-02-13 | 13F | Morgan Stanley | 4.894.992 | -1,09 | 239.806 | -9,17 | ||||
| 2026-02-17 | 13F | Family Management Corp | 0 | -100,00 | 0 | |||||
| 2025-09-24 | NP | FREL - Fidelity MSCI Real Estate Index ETF This fund is a listed as child fund of Fmr Llc and if that institution has disclosed ownership in this security, then these positions will not be double counted when calculating total shares and total value | 11.498 | -3,28 | 652 | -24,39 | ||||
| 2026-02-17 | 13F | Crawford Investment Counsel Inc | 88.347 | 4.328 | ||||||
| 2025-11-10 | 13F | Pekin Hardy Strauss, Inc. | 0 | -100,00 | 0 | -100,00 | ||||
| 2026-02-13 | 13F | Mariner, LLC | 5.771 | -5,63 | 283 | -13,50 | ||||
| 2026-02-10 | 13F | Essex Financial Services, Inc. | 19.082 | 4,25 | 935 | -4,30 | ||||
| 2026-02-17 | 13F | Wiley Bros.-aintree Capital, Llc | 4.272 | 209 | ||||||
| 2026-02-12 | 13F | Promethium Advisors,llc | 68.037 | 10,43 | 3.333 | 1,43 | ||||
| 2025-09-26 | NP | FSRNX - Fidelity Real Estate Index Fund This fund is a listed as child fund of Fmr Llc and if that institution has disclosed ownership in this security, then these positions will not be double counted when calculating total shares and total value | 26.838 | 2,47 | 1.521 | -19,82 | ||||
| 2026-02-06 | 13F | Bare Financial Services, Inc | 45 | 2 | ||||||
| 2026-02-17 | 13F | Millennium Management Llc | 151.003 | 112,78 | 7.398 | 95,38 | ||||
| 2025-11-10 | 13F | Sigma Planning Corp | 0 | -100,00 | 0 | |||||
| 2026-02-12 | 13F | Jane Street Group, Llc | 102.032 | 29,21 | 4.999 | 18,66 | ||||
| 2025-09-26 | NP | FCPGX - Fidelity Small Cap Growth Fund This fund is a listed as child fund of Fmr Llc and if that institution has disclosed ownership in this security, then these positions will not be double counted when calculating total shares and total value | 372.248 | -0,41 | 21.099 | -22,09 | ||||
| 2026-02-12 | 13F | Jane Street Group, Llc | Put | 10.100 | 6,32 | 495 | -2,37 | |||
| 2025-09-26 | NP | FESIX - Fidelity SAI Real Estate Index Fund This fund is a listed as child fund of Fmr Llc and if that institution has disclosed ownership in this security, then these positions will not be double counted when calculating total shares and total value | 1.720 | -1,26 | 97 | -23,02 | ||||
| 2026-02-13 | 13F | Citigroup Inc | 4.328 | 32,23 | 212 | 21,84 | ||||
| 2026-02-12 | 13F | Jane Street Group, Llc | Call | 28.500 | 96,55 | 1.396 | 80,60 | |||
| 2026-02-10 | 13F | Goldman Sachs Group Inc | 214.771 | 1.957,19 | 10.522 | 1.792,27 | ||||
| 2025-11-13 | 13F | Winton Capital Group Ltd | 0 | -100,00 | 0 | |||||
| 2026-01-16 | 13F | Ipswich Investment Management Co., Inc. | 29.644 | -17,87 | 1.452 | -24,57 | ||||
| 2026-01-26 | 13F | Cwm, Llc | 423 | 9,30 | 0 | |||||
| 2025-11-10 | 13F | Td Asset Management Inc | 0 | -100,00 | 0 | |||||
| 2026-02-11 | 13F | Curio Wealth, Llc | 0 | -100,00 | 0 | |||||
| 2026-01-09 | 13F | SG Americas Securities, LLC | 0 | -100,00 | 0 | |||||
| 2025-11-13 | 13F | FORA Capital, LLC | 0 | -100,00 | 0 | |||||
| 2026-01-16 | 13F | TB Alternative Assets Ltd. | 8.141 | 399 | ||||||
| 2025-09-26 | NP | FSSLX - Fidelity Series Small Cap Core Fund | 52.842 | -28,73 | 2.995 | -44,24 | ||||
| 2026-02-17 | 13F | Caption Management, LLC | 0 | -100,00 | 0 | |||||
| 2026-02-13 | 13F | Landscape Capital Management, L.l.c. | 4.103 | 201 | ||||||
| 2025-10-20 | 13F | Albion Financial Group /ut | 0 | -100,00 | 0 | -100,00 | ||||
| 2025-09-25 | NP | VGSIX - Vanguard Real Estate Index Fund Investor Shares | 648.451 | 14,25 | 36.754 | -10,62 | ||||
| 2026-02-17 | 13F | Graham Capital Management, L.P. | 0 | -100,00 | 0 | |||||
| 2026-02-17 | 13F | Hood River Capital Management LLC | 621.071 | -7,40 | 30.426 | -14,97 | ||||
| 2026-02-17 | 13F | Advisor Group Holdings, Inc. | 15.117 | 501,79 | 741 | 456,39 | ||||
| 2026-02-17 | 13F | Cetera Investment Advisers | 15.304 | 3,24 | 750 | -5,19 | ||||
| 2026-01-28 | 13F | Kingswood Wealth Advisors, Llc | 14.446 | -64,21 | 708 | -67,16 | ||||
| 2026-02-02 | 13F | Oppenheimer Asset Management Inc. | 7.176 | 352 | ||||||
| 2026-02-13 | 13F | Caitong International Asset Management Co., Ltd | 237 | 189,02 | 12 | 175,00 | ||||
| 2026-02-06 | 13F | HighTower Advisors, LLC | 110.626 | 30,75 | 5.420 | 20,05 | ||||
| 2026-02-09 | 13F | Jefferies Financial Group Inc. | 58.477 | 2.865 | ||||||
| 2026-02-04 | 13F | Independent Advisor Alliance | 17.112 | 2,74 | 838 | -5,63 | ||||
| 2026-02-12 | 13F | Commonwealth Equity Services, Llc | 22.653 | 7,38 | 1.110 | 110.800,00 | ||||
| 2026-02-13 | 13F | State Street Corp | 21.983 | -13,87 | 1.077 | -20,94 | ||||
| 2025-12-09 | 13F/A | Tudor Investment Corp Et Al | Call | 5.900 | 63,89 | 315 | 29,22 | |||
| 2026-01-15 | 13F | Founders Capital Management | 300 | 50,00 | 15 | 40,00 | ||||
| 2026-01-20 | 13F/A | Miller Wealth Advisors, Llc | 290 | 5,45 | 14 | 0,00 | ||||
| 2026-02-12 | 13F | CIBC Private Wealth Group, LLC | 825 | 40 | ||||||
| 2026-02-12 | 13F | Loomis Sayles & Co L P | 0 | -100,00 | 0 | |||||
| 2026-02-14 | 13F | Rockefeller Capital Management L.P. | 29.736 | -10,45 | 1.457 | -17,79 | ||||
| 2026-02-17 | 13F | Quadrature Capital Ltd | 0 | -100,00 | 0 | |||||
| 2025-11-12 | 13F | Cambridge Investment Research Advisors, Inc. | 0 | -100,00 | 0 | |||||
| 2026-02-17 | 13F | Voloridge Investment Management, Llc | 0 | -100,00 | 0 | |||||
| 2026-01-13 | 13F | CoreCap Advisors, LLC | 0 | -100,00 | 0 | |||||
| 2026-02-12 | 13F | Counterpoint Mutual Funds LLC | 0 | -100,00 | 0 | |||||
| 2026-02-13 | 13F | Peak6 Llc | Call | 14.900 | -75,17 | 730 | -77,23 | |||
| 2025-11-14 | 13F | Skopos Labs, Inc. | 0 | -100,00 | 0 | |||||
| 2026-02-17 | 13F | Point72 Asset Management, L.P. | 0 | -100,00 | 0 | |||||
| 2026-02-13 | 13F | Van Eck Associates Corp | 5.705 | 37,21 | 0 | |||||
| 2026-02-17 | 13F | Spears Abacus Advisors LLC | 17.340 | 0,38 | 849 | -7,82 | ||||
| 2026-02-12 | 13F | Tocqueville Asset Management L.p. | 103.450 | -7,53 | 5.068 | -15,08 | ||||
| 2026-02-17 | 13F | Northern Trust Corp | 7.395 | 2,55 | 362 | -5,73 | ||||
| 2026-02-13 | 13F | Pinnacle Wealth Planning Services, Inc. | 989 | 48 | ||||||
| 2026-02-17 | 13F | Df Dent & Co Inc | 438.992 | 21.506 | ||||||
| 2026-02-17 | 13F | Fmr Llc | 813.748 | -0,78 | 39.866 | -8,89 | ||||
| 2025-11-14 | 13F | Boothbay Fund Management, Llc | 0 | -100,00 | 0 | |||||
| 2026-02-13 | 13F | Ingalls & Snyder Llc | 0 | -100,00 | 0 | |||||
| 2026-02-17 | 13F | Amundi | 188.273 | 9.223 | ||||||
| 2026-02-17 | 13F | Hilltop Holdings Inc. | 0 | -100,00 | 0 | |||||
| 2025-11-07 | 13F | L & S Advisors Inc | 0 | -100,00 | 0 | |||||
| 2026-02-10 | 13F | EagleClaw Capital Managment, LLC | 200.880 | -0,72 | 9.841 | -8,83 | ||||
| 2026-02-17 | 13F | Advisory Services Network, LLC | 88.681 | 1,54 | 4.344 | -6,76 | ||||
| 2026-01-07 | 13F | Sandbox Financial Partners, LLC | 0 | -100,00 | 0 | |||||
| 2026-02-13 | 13F | Squarepoint Ops LLC | 10.317 | 505 | ||||||
| 2026-02-10 | 13F | Lido Advisors, LLC | 8.711 | 10,13 | 461 | 9,50 | ||||
| 2026-02-13 | 13F | Barclays Plc | 12 | 0,00 | 1 | |||||
| 2026-02-13 | 13F | SRS Capital Advisors, Inc. | 855 | -1,84 | 42 | -10,87 | ||||
| 2026-02-13 | 13F | Marshall Wace, Llp | 142.506 | 6.981 | ||||||
| 2026-01-28 | 13F | Key Client Fiduciary Advisors, LLC | 52.094 | 2,62 | 2.552 | -5,76 | ||||
| 2026-01-28 | 13F | Key Client Fiduciary Advisors, LLC | Call | 1.500 | 73 | |||||
| 2026-01-07 | 13F | Harbor Investment Advisory, Llc | 1.521 | 75 | ||||||
| 2026-02-04 | 13F | Schwartz Investment Counsel Inc | 592.891 | 2,26 | 29.046 | -6,09 | ||||
| 2025-09-25 | NP | VRTPX - Vanguard Real Estate II Index Fund This fund is a listed as child fund of Vanguard Group Inc and if that institution has disclosed ownership in this security, then these positions will not be double counted when calculating total shares and total value | 112.791 | 15,49 | 6.393 | -9,65 | ||||
| 2025-11-12 | 13F | PKS Advisory Services, LLC | 0 | -100,00 | 0 | -100,00 | ||||
| 2026-02-17 | 13F | Cinctive Capital Management LP | 126.914 | 128,72 | 6.218 | 110,03 | ||||
| 2025-09-26 | NP | BKSE - BNY Mellon US Small Cap Core Equity ETF | 577 | -23,58 | 33 | -40,74 | ||||
| 2026-02-10 | 13F | Quantbot Technologies LP | 0 | -100,00 | 0 | |||||
| 2025-09-26 | NP | FOCSX - Fidelity Small Cap Growth K6 Fund This fund is a listed as child fund of Fmr Llc and if that institution has disclosed ownership in this security, then these positions will not be double counted when calculating total shares and total value | 182.306 | 0,61 | 10.333 | -21,29 | ||||
| 2026-01-23 | 13F | Eagle Bay Advisors LLC | 425 | 21 | ||||||
| 2026-02-13 | 13F | HITE Hedge Asset Management LLC | 47.105 | 175,76 | 2.308 | 153,24 | ||||
| 2026-02-17 | 13F | Adage Capital Partners Gp, L.l.c. | 100.000 | 4.899 | ||||||
| 2026-02-18 | 13F | Galaxy Group Investments LLC | 739 | 36 | ||||||
| 2026-02-10 | 13F | Seven Grand Managers, Llc | 100.000 | 0,00 | 4.899 | -8,17 | ||||
| 2026-01-29 | 13F | Generali Investments, Management Co LLC | 0 | -100,00 | 0 | |||||
| 2026-02-03 | 13F | International Assets Investment Management, Llc | 28 | 1 | ||||||
| 2026-01-29 | 13F | Comerica Bank | 1.394 | 1,83 | 68 | -6,85 | ||||
| 2026-02-12 | 13F | Steward Partners Investment Advisory, Llc | 12.468 | 21,94 | 611 | 11,93 | ||||
| 2026-02-13 | 13F | Resources Investment Advisors, LLC. | 26.997 | -11,02 | 1.323 | -18,29 | ||||
| 2026-02-12 | 13F | Compass Capital Corp /ma/ /adv | 3.931 | 224 | ||||||
| 2026-02-13 | 13F | Verition Fund Management LLC | 0 | -100,00 | 0 | |||||
| 2025-11-14 | 13F | Raymond James Financial Inc | Put | 0 | -100,00 | 0 | -100,00 | |||
| 2026-02-17 | 13F | Aqr Capital Management Llc | 71.074 | 6,42 | 3.482 | -2,27 | ||||
| 2025-10-23 | 13F | Canton Hathaway, LLC | 0 | -100,00 | 0 | |||||
| 2026-02-17 | 13F | Bank Of America Corp /de/ | 5.924 | -95,84 | 290 | -96,18 | ||||
| 2026-02-12 | 13F | Swiss National Bank | 37.400 | 2,47 | 1.832 | -5,91 | ||||
| 2025-11-14 | 13F | Driehaus Capital Management Llc | 0 | -100,00 | 0 | -100,00 | ||||
| 2026-02-02 | 13F | Avidian Wealth Solutions, LLC | 0 | -100,00 | 0 | |||||
| 2026-02-10 | 13F | Pecaut & Co. | 15.992 | 0,01 | 783 | -8,21 | ||||
| 2025-11-13 | 13F | Bridgewater Associates, LP | 0 | -100,00 | 0 | |||||
| 2026-01-22 | 13F | Apollon Wealth Management, LLC | 12.945 | 0,30 | 634 | -7,85 | ||||
| 2025-10-24 | 13F | ORG Partners LLC | 0 | -100,00 | 0 | |||||
| 2026-02-06 | 13F | GPS Wealth Strategies Group, LLC | 0 | -100,00 | 0 | |||||
| 2026-02-17 | 13F | Citadel Advisors Llc | 224.730 | 119,66 | 11.010 | 101,70 | ||||
| 2026-02-06 | 13F | Pnc Financial Services Group, Inc. | 3.405 | 9.628,57 | 167 | 16.500,00 | ||||
| 2025-11-17 | 13F | PDT Partners, LLC | 0 | -100,00 | 0 | -100,00 | ||||
| 2026-02-17 | 13F | Citadel Advisors Llc | Put | 42.200 | 12,53 | 2.067 | 3,35 | |||
| 2026-02-17 | 13F | Citadel Advisors Llc | Call | 34.200 | -28,00 | 1.675 | -33,90 | |||
| 2026-02-17 | 13F | Private Advisor Group, LLC | 17.277 | -5,68 | 846 | -13,41 | ||||
| 2025-11-14 | 13F | Wolverine Trading, Llc | 8.799 | 465 | ||||||
| 2025-11-14 | 13F | Wolverine Trading, Llc | Call | 9.700 | 513 | |||||
| 2025-11-14 | 13F | Wolverine Trading, Llc | Put | 20.000 | 1.057 | |||||
| 2025-09-25 | NP | TEKX - SPDR Galaxy Transformative Tech Accelerators ETF | 511 | -79,33 | 29 | -82,50 | ||||
| 2026-02-11 | 13F | Manchester Capital Management LLC | 0 | -100,00 | 0 | -100,00 | ||||
| 2026-02-17 | 13F | Ancora Advisors, LLC | 250 | 0,00 | 12 | -7,69 | ||||
| 2026-02-17 | 13F | Schonfeld Strategic Advisors LLC | 0 | -100,00 | 0 | |||||
| 2026-02-17 | 13F | Tudor Investment Corp Et Al | 6.378 | 312 | ||||||
| 2026-01-27 | 13F | Zurcher Kantonalbank (Zurich Cantonalbank) | 3.376 | 0,00 | 165 | -8,33 | ||||
| 2025-10-20 | 13F | Segment Wealth Management, LLC | 0 | -100,00 | 0 | |||||
| 2026-02-17 | 13F | Moore Capital Management, Lp | 0 | -100,00 | 0 | |||||
| 2026-02-13 | 13F | Sei Investments Co | 67.360 | 3.300 | ||||||
| 2026-02-17 | 13F | Two Sigma Investments, Lp | 44.046 | -76,87 | 2.158 | -78,77 | ||||
| 2026-02-17 | 13F | RMB Capital Management, LLC | 0 | -100,00 | 0 | |||||
| 2026-02-17 | 13F | Ghisallo Capital Management LLC | 50.219 | -61,37 | 2.460 | -64,53 | ||||
| 2026-01-26 | 13F | Annex Advisory Services, LLC | 294.143 | 8,61 | 14.410 | -0,26 | ||||
| 2026-02-17 | 13F | Interval Partners, LP | 0 | -100,00 | 0 | |||||
| 2026-02-17 | 13F | Engineers Gate Manager LP | 11.833 | -56,10 | 580 | -59,71 | ||||
| 2025-11-14 | 13F | Brooklands Fund Management Ltd | Call | 0 | -100,00 | 0 | ||||
| 2026-02-06 | 13F | Mad River Investors | 262.934 | 9,08 | 12.881 | 0,16 | ||||
| 2026-02-11 | 13F | Group One Trading, L.p. | 1.204 | -69,19 | 59 | -72,12 | ||||
| 2026-02-17 | 13F | Blackstone Group Inc | 0 | -100,00 | 0 | |||||
| 2026-02-17 | 13F | Susquehanna International Group, Llp | Put | 81.900 | 9,05 | 4.012 | 0,15 | |||
| 2026-02-17 | 13F | Susquehanna International Group, Llp | Call | 42.600 | 9,79 | 2.087 | 0,82 | |||
| 2025-11-13 | 13F | Family Management Corp | Put | 0 | -100,00 | 0 | -100,00 | |||
| 2026-02-17 | 13F | Susquehanna International Group, Llp | 31.029 | -32,00 | 1.520 | -37,55 | ||||
| 2025-11-17 | 13F | Avondale Wealth Management | 0 | -100,00 | 0 | |||||
| 2026-02-17 | 13F | Royal Bank Of Canada | 19.701 | -33,97 | 966 | -39,32 | ||||
| 2026-02-12 | 13F | Hrt Financial Lp | 0 | -100,00 | 0 | |||||
| 2026-01-26 | 13F | KBC Group NV | 628 | 0,00 | 0 | |||||
| 2026-01-29 | 13F | Vanguard Group Inc | 861.815 | 0,82 | 42.220 | -7,41 | ||||
| 2026-02-11 | 13F | Empowered Funds, LLC | 6.881 | -3,95 | 337 | -11,78 | ||||
| 2026-01-27 | 13F | Financial Management Professionals, Inc. | 298 | 119,12 | 15 | 100,00 | ||||
| 2026-02-13 | 13F | Kestra Advisory Services, LLC | 671 | 33 | ||||||
| 2026-02-17 | 13F/A | Uniplan Investment Counsel, Inc. | 0 | -100,00 | 0 | |||||
| 2026-02-17 | 13F | Yaupon Capital Management LP | 51.258 | 15,38 | 2.511 | 5,95 | ||||
| 2025-09-26 | NP | GYLD - Arrow Dow Jones Global Yield ETF | 2.605 | 46,51 | 148 | 14,84 | ||||
| 2026-01-29 | 13F | Dunhill Financial, LLC | 1 | 0 | ||||||
| 2026-02-13 | 13F | Y-Intercept (Hong Kong) Ltd | 40.229 | 16,51 | 1.971 | 6,95 | ||||
| 2026-02-03 | 13F | SBI Securities Co., Ltd. | 18 | 0,00 | 1 | |||||
| 2026-02-12 | 13F | Chilton Capital Management Llc | 7.333 | 0,00 | 359 | -8,18 | ||||
| 2026-01-28 | 13F | Geneos Wealth Management Inc. | 3.395 | -12,50 | 166 | -19,42 | ||||
| 2026-02-18 | 13F | GWM Advisors LLC | 406 | 1,00 | 20 | -9,52 | ||||
| 2026-01-29 | 13F | UBS Group AG | 274.851 | -35,50 | 13.465 | -40,78 | ||||
| 2026-02-12 | 13F | Dimensional Fund Advisors Lp | 4.665 | 11,55 | 229 | 2,24 | ||||
| 2026-02-17 | 13F | Blair William & Co/il | 12.475 | 17,69 | 611 | 8,14 | ||||
| 2026-02-17 | 13F | Summit Street Capital Management, LLC | 227.258 | -20,49 | 11.133 | -26,98 | ||||
| 2026-02-06 | 13F | One Charles Private Wealth Services, LLC | 236.707 | -3,38 | 11.596 | -11,27 | ||||
| 2026-02-11 | 13F | Deutsche Bank Ag\ | 1.153 | 0,00 | 56 | -8,20 | ||||
| 2025-11-14 | 13F | State Of Wisconsin Investment Board | 0 | -100,00 | 0 | |||||
| 2026-02-06 | 13F | IFP Advisors, Inc | 50 | 0,00 | 2 | 0,00 | ||||
| 2026-01-28 | 13F | Arizona State Retirement System | 5.305 | -4,96 | 260 | -12,79 | ||||
| 2026-02-09 | 13F | Malaga Cove Capital, LLC | 17.388 | 7,67 | 852 | -1,16 | ||||
| 2026-02-17 | 13F | DV Trading LLC | 200 | 10 | ||||||
| 2026-02-13 | 13F | Ubs Asset Management Americas Inc | 20.559 | 16,77 | 1.007 | 7,24 | ||||
| 2026-01-20 | 13F | Stratos Wealth Partners, LTD. | 4.892 | 0,10 | 240 | -8,08 | ||||
| 2026-02-10 | 13F | SCS Capital Management LLC | 0 | -100,00 | 0 | |||||
| 2025-11-14 | 13F | Walleye Capital LLC | 0 | -100,00 | 0 | |||||
| 2026-02-17 | 13F | Russell Investments Group, Ltd. | 3.102 | 152 | ||||||
| 2026-02-09 | 13F | Atticus Wealth Management, Llc | 5.586 | 1,95 | 274 | -6,51 | ||||
| 2026-02-11 | 13F | Janney Montgomery Scott LLC | 25.507 | -4,58 | 1 | 0,00 | ||||
| 2026-02-10 | 13F | Moors & Cabot, Inc. | 206.117 | 4,96 | 10.098 | -3,62 | ||||
| 2026-01-16 | 13F | Ronald Blue Trust, Inc. | 1.716 | 0,35 | 84 | -7,69 | ||||
| 2026-02-17 | 13F | Tower Research Capital LLC (TRC) | 955 | 15.816,67 | 47 | |||||
| 2026-01-28 | 13F | Turtle Creek Wealth Advisors, LLC | 0 | -100,00 | 0 | |||||
| 2026-02-06 | 13F | Sierra Summit Advisors Llc | 0 | -100,00 | 0 | |||||
| 2025-09-24 | NP | FFTY - Innovator IBD(R) 50 ETF | 0 | -100,00 | 0 | -100,00 | ||||
| 2025-09-26 | NP | FTLS - First Trust Long/Short Equity ETF This fund is a listed as child fund of First Trust Advisors Lp and if that institution has disclosed ownership in this security, then these positions will not be double counted when calculating total shares and total value | 17.828 | 1.010 | ||||||
| 2026-01-28 | 13F | Cortland Associates Inc/mo | 408.280 | -1,01 | 20.002 | -9,10 | ||||
| 2026-02-09 | 13F | William Blair Investment Management, Llc | 690.291 | 33.817 | ||||||
| 2025-11-07 | 13F | Sierra Ocean, Llc | 0 | -100,00 | 0 | |||||
| 2026-02-05 | 13F | Allworth Financial LP | 142 | 0,00 | 7 | -14,29 | ||||
| 2026-02-13 | 13F | Stifel Financial Corp | 6.308 | -50,83 | 309 | -54,82 | ||||
| 2025-09-24 | NP | Innovator ETFs Trust - Innovator U.S. Small Cap Managed Floor ETF | 187 | 6,25 | 11 | -16,67 | ||||
| 2026-01-12 | 13F | Viking Fund Management Llc | 80.000 | 100,00 | 3.919 | 83,65 | ||||
| 2026-01-21 | 13F | Flagship Harbor Advisors, Llc | 1.043 | 51 |
Other Listings
| US:LB | 77,66 $ |