Grundlæggende statistik
| Institutionelle aktier (lange) | 64.260.138 - 104,01% (ex 13D/G) - change of -15,87MM shares -19,81% MRQ |
| Institutionel værdi (lang) | $ 13.021.370 USD ($1000) |
Institutionelt ejerskab og aktionærer
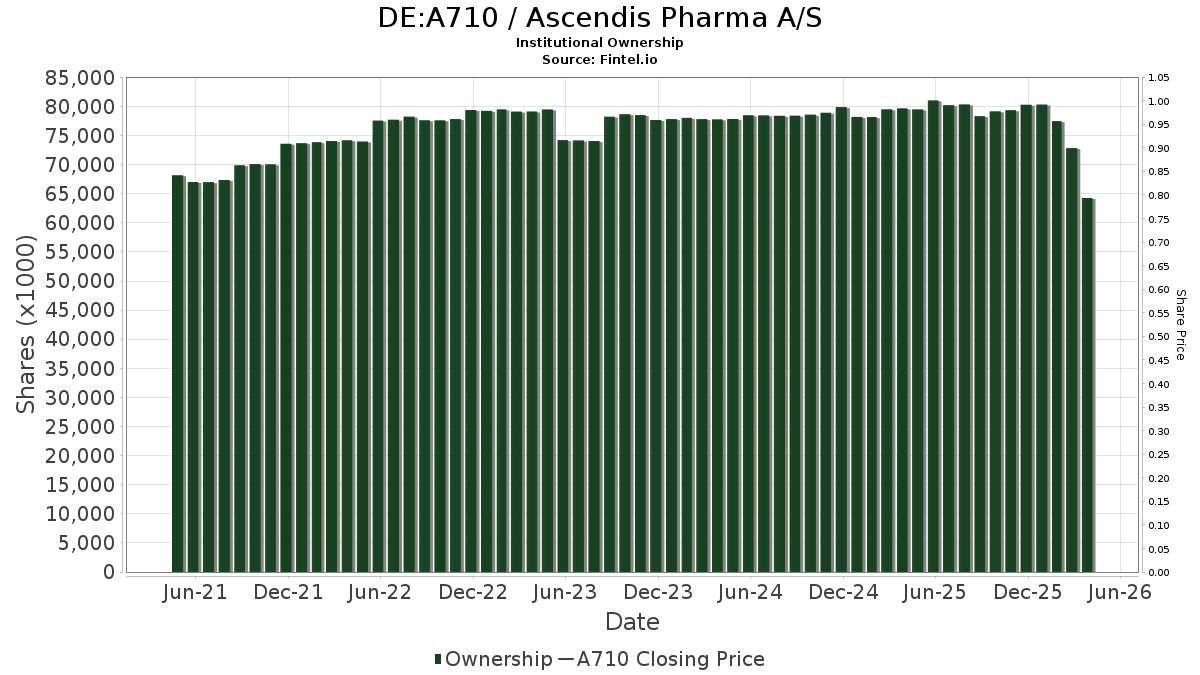
Ascendis Pharma A/S (DE:A710) har 310 institutionelle ejere og aktionærer, der har indsendt 13D/G- eller 13F-formularer til Securities Exchange Commission (SEC). Disse institutioner har i alt 64,260,138 aktier. Største aktionærer omfatter Ra Capital Management, L.p., Westfield Capital Management Co Lp, Avoro Capital Advisors LLC, Fmr Llc, Janus Henderson Group Plc, Artisan Partners Limited Partnership, Capital International Investors, Franklin Resources Inc, Massachusetts Financial Services Co /ma/, and Wellington Management Group Llp .
Ascendis Pharma A/S (DB:A710) institutionel ejerskabsstruktur viser aktuelle positioner i virksomheden efter institutioner og fonde, samt seneste ændringer i positionsstørrelse. Større aktionærer kan omfatte individuelle investorer, investeringsforeninger, hedgefonde eller institutioner. Skema 13D angiver, at investoren besidder (eller besidder) mere end 5 % af virksomheden og har til hensigt (eller har til hensigt at) aktivt at forfølge en ændring i forretningsstrategi. Skema 13G indikerer en passiv investering på over 5%.
Fondens stemningsscore
Fund Sentiment Score (fka Ownership Accumulation Score) finder de aktier, der bliver mest købt af fonde. Det er resultatet af en sofistikeret, multi-faktor kvantitativ model, der identificerer virksomheder med de højeste niveauer af institutionel akkumulering. Scoringsmodellen bruger en kombination af den samlede stigning i oplyste ejere, ændringerne i porteføljeallokeringer i disse ejere og andre målinger. Tallet går fra 0 til 100, hvor højere tal indikerer et højere niveau af akkumulering for sine jævnaldrende, og 50 er gennemsnittet.
Opdateringsfrekvens: Dagligt
Se Ownership Explorer, som giver en liste over højest rangerende virksomheder.
AI+ Ask Fintel’s AI assistant about Ascendis Pharma A/S.
Select a question to share a public post with an AI-crafted answer.
Thinking of good questions…
13F og NPORT arkivering
Detaljer om 13F-arkivering er gratis. Detaljer om NP-ansøgninger kræver et premium-medlemskab. Grønne rækker angiver nye positioner. Røde rækker angiver lukkede positioner. Klik på linket ikon for at se den fulde transaktionshistorik.
Opgrader
for at låse premium-data op og eksportere til Excel ![]() .
.
| Fil dato | Kilde | Investor | Type | Gennemsnitlig pris (Øst) |
Aktier | Δ Aktier (%) |
Rapporteret Værdi ($1000) |
Δ Værdi (%) |
Port Alloc (%) |
|
|---|---|---|---|---|---|---|---|---|---|---|
| 2026-04-20 | 13F | Moody Aldrich Partners Llc | 1.249 | -2,12 | 286 | 4,78 | ||||
| 2026-02-17 | 13F | Ishara Investments LP | 5.000 | 1.066 | ||||||
| 2026-02-12 | 13F | Castleark Management Llc | 66.336 | 55,51 | 14.145 | 66,80 | ||||
| 2026-02-12 | 13F | Penserra Capital Management LLC | 279 | 0 | ||||||
| 2026-02-13 | 13F | OMERS ADMINISTRATION Corp | 0 | -100,00 | 0 | |||||
| 2026-02-13 | 13F | Aigen Investment Management, Lp | 1.184 | 252 | ||||||
| 2026-02-17 | 13F | Ancora Advisors, LLC | 12 | 3 | ||||||
| 2025-11-12 | 13F | CIBC Bancorp USA Inc. | 8.378 | 1.666 | ||||||
| 2026-02-17 | 13F | PFM Health Sciences, LP | 177.685 | 22,28 | 37.890 | 31,15 | ||||
| 2026-02-13 | 13F | Y-Intercept (Hong Kong) Ltd | 6.034 | -25,13 | 1.287 | -19,73 | ||||
| 2026-02-17 | 13F | Advisor Group Holdings, Inc. | 1.140 | -13,57 | 243 | -6,90 | ||||
| 2026-02-17 | 13F | Avoro Capital Advisors LLC | 5.111.111 | 0,02 | 1.089.893 | 7,28 | ||||
| 2026-01-14 | 13F | ORG Wealth Partners, LLC | 27 | 8,00 | 6 | 25,00 | ||||
| 2025-11-12 | 13F | R Squared Ltd | 0 | -100,00 | 0 | |||||
| 2026-02-19 | 13F | CI Private Wealth, LLC | 3.393 | 17,69 | 724 | 26,18 | ||||
| 2026-02-13 | 13F | American Century Companies Inc | 1.443.141 | 164,99 | 307.737 | 184,22 | ||||
| 2026-02-17 | 13F | Ninepoint Partners LP | 2.115 | 182,38 | 451 | 204,73 | ||||
| 2026-02-17 | 13F | Quadrature Capital Ltd | 0 | -100,00 | 0 | |||||
| 2026-02-17 | 13F | Fred Alger Management, Llc | 352.109 | 106,27 | 75.084 | 121,24 | ||||
| 2026-02-17 | 13F | Two Sigma Advisers, Lp | 47.400 | 44,07 | 10.108 | 54,54 | ||||
| 2026-02-13 | 13F | Siren, L.L.C. | 235.862 | 0,00 | 50.295 | 7,26 | ||||
| 2026-02-13 | 13F | Squarepoint Ops LLC | Call | 3.900 | 832 | |||||
| 2026-02-12 | 13F | Jane Street Group, Llc | Call | 73.600 | 0,00 | 15.694 | 7,26 | |||
| 2025-11-12 | 13F | Group One Trading, L.p. | 0 | -100,00 | 0 | -100,00 | ||||
| 2026-02-12 | 13F | Jane Street Group, Llc | 21.225 | 4.526 | ||||||
| 2026-02-12 | 13F | Jane Street Group, Llc | Put | 9.200 | -33,81 | 1.962 | -29,03 | |||
| 2026-02-13 | 13F | Stifel Financial Corp | 20.198 | -0,86 | 4.307 | 6,35 | ||||
| 2026-02-11 | 13F | Jpmorgan Chase & Co | Call | 35.000 | -53,40 | 7.463 | -50,01 | |||
| 2026-02-12 | 13F | Hrt Financial Lp | 1.122 | 0 | ||||||
| 2026-02-11 | 13F | Jpmorgan Chase & Co | Put | 35.000 | -30,14 | 7.463 | -25,07 | |||
| 2026-02-12 | 13F | Ci Investments Inc. | 0 | -100,00 | 0 | |||||
| 2026-02-12 | 13F | Evolutionary Tree Capital Management, LLC | 12.281 | -19,96 | 2.619 | -14,16 | ||||
| 2026-02-11 | 13F | Jpmorgan Chase & Co | 507.240 | 73,48 | 108.164 | 86,07 | ||||
| 2026-02-11 | 13F | Westfield Capital Management Co Lp | 5.185.696 | -1,41 | 1.105.798 | 5,74 | ||||
| 2026-02-13 | 13F | State Street Corp | 67.949 | 10,42 | 14.489 | 18,43 | ||||
| 2026-02-17 | 13F | Shay Capital LLC | 6.000 | 1.279 | ||||||
| 2026-02-17 | 13F | Jones Financial Companies Lllp | 228 | 0,00 | 49 | 11,63 | ||||
| 2026-02-17 | 13F | ADAR1 Capital Management, LLC | 25.314 | -30,35 | 5.398 | -25,30 | ||||
| 2026-02-17 | 13F | Elequin Capital Lp | 51 | 11 | ||||||
| 2026-04-15 | 13F | Gf Fund Management Co. Ltd. | 1.379 | 14,34 | 315 | 22,57 | ||||
| 2026-02-13 | 13F | Marshall Wace, Llp | 30.055 | 6.409 | ||||||
| 2026-02-09 | 13F | Sectoral Asset Management Inc | 3.254 | -9,64 | 694 | -3,08 | ||||
| 2026-02-17 | 13F | Schonfeld Strategic Advisors LLC | 2.581 | -93,25 | 550 | -92,77 | ||||
| 2026-02-17 | 13F | Resolute Capital Asset Partners LLC | 88.627 | -46,50 | 18.899 | -42,62 | ||||
| 2026-01-23 | 13F | Altfest L J & Co Inc | 2.756 | 27,00 | 588 | 36,19 | ||||
| 2026-02-05 | 13F | Atria Investments Llc | 3.737 | -12,34 | 797 | -6,02 | ||||
| 2026-01-15 | 13F | Burns Matteson Capital Management, LLC | 1.429 | 10,43 | 305 | 18,29 | ||||
| 2026-02-13 | 13F | Squarepoint Ops LLC | 6.474 | 438,15 | 1.381 | 477,41 | ||||
| 2026-02-17 | 13F | Progeny 3, Inc. | 5.230 | 1.115 | ||||||
| 2026-02-17 | 13F | Quantedge Capital Pte Ltd | 9.200 | 29,58 | 1.962 | 38,98 | ||||
| 2026-02-17 | 13F | Janus Henderson Group Plc | 4.061.641 | -6,05 | 866.104 | 0,78 | ||||
| 2026-02-05 | 13F | DnB Asset Management AS | 5.977 | 52,83 | 1.275 | 63,96 | ||||
| 2026-02-06 | 13F | EverSource Wealth Advisors, LLC | 203 | -7,31 | 43 | 0,00 | ||||
| 2026-02-11 | 13F | Fox Run Management, L.l.c. | 4.496 | 169,87 | 959 | 189,43 | ||||
| 2026-04-24 | 13F | Bellevue Asset Management, Llc | 0 | -100,00 | 0 | |||||
| 2026-02-06 | 13F | Vestmark Advisory Solutions, Inc. | 5.806 | 1.238 | ||||||
| 2026-04-17 | 13F | CENTRAL TRUST Co | 2 | 0,00 | 0 | |||||
| 2026-04-06 | 13F | GAMMA Investing LLC | 957 | 12,59 | 219 | 20,44 | ||||
| 2026-02-17 | 13F | Northern Trust Corp | 32.854 | 111,18 | 7.006 | 126,55 | ||||
| 2025-11-14 | 13F | Algert Global Llc | 0 | -100,00 | 0 | |||||
| 2026-02-13 | 13F | BNP Paribas Asset Management Holding S.A. | 72.106 | -61,98 | 15 | -59,46 | ||||
| 2026-01-23 | 13F | Diversify Advisory Services, LLC | 2.881 | 8,43 | 593 | 10,86 | ||||
| 2026-02-13 | 13F | Schroder Investment Management Group | 73.310 | 119,55 | 15.633 | 135,49 | ||||
| 2026-02-11 | 13F | Group One Trading, L.p. | Put | 1.500 | -76,56 | 320 | -74,92 | |||
| 2026-04-23 | 13F | Oppenheimer Asset Management Inc. | 7.344 | 29,09 | 1.680 | 38,42 | ||||
| 2026-02-14 | 13F | Rockefeller Capital Management L.P. | 35 | -68,75 | 7 | -68,18 | ||||
| 2026-02-11 | 13F | Group One Trading, L.p. | Call | 18.400 | -14,81 | 3.924 | -8,64 | |||
| 2025-11-10 | 13F | MAI Capital Management | 0 | -100,00 | 0 | |||||
| 2026-01-26 | 13F | Cwm, Llc | 1.395 | 34.775,00 | 0 | |||||
| 2026-02-13 | 13F/A | Virtus ETF Advisers LLC | 0 | -100,00 | 0 | -100,00 | ||||
| 2025-11-06 | 13F | Compagnie Lombard Odier SCmA | 0 | -100,00 | 0 | -100,00 | ||||
| 2026-02-17 | 13F | Cetera Investment Advisers | 4.548 | 18,90 | 970 | 27,50 | ||||
| 2026-02-19 | 13F | Invesco Ltd. | 586.094 | 124.979 | 4.494,78 | |||||
| 2026-04-20 | 13F | Ronald Blue Trust, Inc. | 170 | -48,01 | 39 | -44,93 | ||||
| 2026-02-12 | 13F | Hollencrest Capital Management | 48 | 0,00 | 10 | 11,11 | ||||
| 2026-02-13 | 13F | Nicholas Investment Partners, LP | 6.265 | 45,36 | 1.336 | 55,96 | ||||
| 2026-02-13 | 13F | Greenline Wealth Management LLC | 504 | 107 | ||||||
| 2026-04-16 | 13F | Toth Financial Advisory Corp | 5.450 | 17,46 | 1.247 | 25,99 | ||||
| 2026-02-17 | 13F | Millennium Management Llc | Call | 2.500 | -89,13 | 533 | -88,34 | |||
| 2026-02-17 | 13F | Millennium Management Llc | 262.329 | 50,24 | 55.939 | 61,15 | ||||
| 2026-02-17 | 13F | StemPoint Capital LP | 14.842 | -2,03 | 3.165 | 5,08 | ||||
| 2026-02-12 | 13F | Sit Investment Associates Inc | 0 | -100,00 | 0 | |||||
| 2026-02-13 | 13F | Atika Capital Management LLC | 20.642 | -6,85 | 4.402 | -0,09 | ||||
| 2026-02-13 | 13F | Avidity Partners Management LP | 0 | -100,00 | 0 | |||||
| 2026-02-12 | 13F | Skopos Labs, Inc. | 2.217 | 66,19 | 468 | 76,23 | ||||
| 2026-02-10 | 13F | Envestnet Asset Management Inc | 16.338 | -34,55 | 3.484 | -29,81 | ||||
| 2026-02-10 | 13F | Goldman Sachs Group Inc | 596.703 | -8,62 | 127.241 | -1,99 | ||||
| 2026-02-10 | 13F | Zweig-DiMenna Associates LLC | 15.500 | 3.305 | ||||||
| 2026-02-17 | 13F | Two Sigma Securities, Llc | 0 | -100,00 | 0 | |||||
| 2026-02-17 | 13F | Advisory Services Network, LLC | 0 | -100,00 | 0 | |||||
| 2026-02-17 | 13F | Spyglass Capital Management Llc | 415.549 | 6,92 | 88.612 | 14,68 | ||||
| 2026-02-11 | 13F | J.Safra Asset Management Corp | 61 | 0,00 | 13 | 8,33 | ||||
| 2026-02-13 | 13F | Integrated Wealth Concepts LLC | 0 | -100,00 | 0 | -100,00 | ||||
| 2026-04-16 | 13F | Birch Financial Group, Llc | 1.059 | 0,86 | 242 | 8,52 | ||||
| 2026-04-24 | 13F | Severin Investments, LLC | 2.195 | -2,27 | 502 | 5,02 | ||||
| 2026-01-07 | 13F | Aventura Private Wealth, LLC | 74 | 29,82 | 16 | 36,36 | ||||
| 2026-02-17 | 13F | SummitTX Capital, L.P. | 970 | 207 | ||||||
| 2026-02-17 | 13F | Two Sigma Investments, Lp | 247.892 | 34,81 | 52.860 | 44,59 | ||||
| 2026-02-17 | 13F | Alliancebernstein L.p. | 288.592 | -23,23 | 61.539 | -17,65 | ||||
| 2026-02-17 | 13F | Graham Capital Management, L.P. | 1.071 | 228 | ||||||
| 2026-02-17 | 13F | Orbimed Advisors Llc | 171.977 | -10,38 | 36.672 | -3,88 | ||||
| 2026-04-10 | 13F | Henry James International Management Inc. | 14.784 | 9,87 | 3.382 | 17,85 | ||||
| 2026-02-17 | 13F | Royal Bank Of Canada | 2.534 | -64,75 | 541 | -62,14 | ||||
| 2026-04-24 | 13F | UMA Financial Services, Inc. | 10 | 0,00 | 2 | 0,00 | ||||
| 2025-11-14 | 13F | Soleus Capital Management, L.P. | 0 | -100,00 | 0 | -100,00 | ||||
| 2026-04-14 | 13F | Perpetual Ltd | 100.638 | 23.019 | ||||||
| 2026-02-11 | 13F | Capital International Sarl | 24.943 | -19,18 | 5.319 | -13,32 | ||||
| 2026-01-12 | 13F | National Wealth Management Group, LLC | 0 | -100,00 | 0 | |||||
| 2026-02-17 | 13F | Toronto Dominion Bank | Call | 19.300 | 4.089 | |||||
| 2026-01-26 | 13F | Private Trust Co Na | 0 | -100,00 | 0 | |||||
| 2026-02-12 | 13F | BRYN MAWR TRUST Co | 0 | -100,00 | 0 | -100,00 | ||||
| 2026-02-11 | 13F | Erste Asset Management GmbH | 20.300 | 4.284 | ||||||
| 2026-04-22 | 13F | Braun Stacey Associates Inc | 130.992 | 9,99 | 29.962 | 17,98 | ||||
| 2026-02-13 | 13F | Nan Fung Group Holdings Ltd | 13.600 | 0,00 | 2.900 | 7,29 | ||||
| 2026-02-06 | 13F | Pnc Financial Services Group, Inc. | 8.699 | 7,20 | 1.855 | 14,94 | ||||
| 2026-02-13 | 13F | JustInvest LLC | 1.458 | 0,14 | 311 | 7,27 | ||||
| 2026-02-13 | 13F | Rhumbline Advisers | 1.739 | 53,22 | 371 | 64,44 | ||||
| 2026-02-10 | 13F/A | Northwestern Mutual Wealth Management Co | 10 | 66,67 | 2 | 100,00 | ||||
| 2026-02-13 | 13F | Morgan Stanley | 617.968 | 51,92 | 131.776 | 62,95 | ||||
| 2026-02-13 | 13F | Biondo Investment Advisors, LLC | 1.000 | 213 | ||||||
| 2026-02-17 | 13F | Fmr Llc | 4.153.311 | -7,12 | 885.652 | -0,38 | ||||
| 2026-01-23 | 13F | Assetmark, Inc | 8.579 | 48,12 | 1.829 | 58,91 | ||||
| 2026-02-12 | 13F | Voya Investment Management Llc | 57.075 | -22,03 | 12.171 | -16,37 | ||||
| 2026-02-17 | 13F | Voloridge Investment Management, Llc | 216.173 | -7,77 | 46.097 | -1,08 | ||||
| 2026-01-16 | 13F | Standard Life Aberdeen plc | 221.677 | 348,50 | 47.270 | 381,07 | ||||
| 2026-02-17 | 13F | Millennium Management Llc | Put | 0 | -100,00 | 0 | -100,00 | |||
| 2026-02-09 | 13F/A | Fideuram - Intesa Sanpaolo Private Banking S.p.a. | 10.866 | 2.317 | ||||||
| 2026-02-13 | 13F | Walleye Capital LLC | Put | 2.800 | 833,33 | 597 | 911,86 | |||
| 2026-02-13 | 13F | Caitong International Asset Management Co., Ltd | 54 | 12 | ||||||
| 2026-02-13 | 13F | Walleye Capital LLC | 628 | 134 | ||||||
| 2026-02-13 | 13F | Walleye Capital LLC | Call | 4.600 | 318,18 | 981 | 349,54 | |||
| 2026-02-05 | 13F | Td Private Client Wealth Llc | 2 | -97,26 | 0 | -100,00 | ||||
| 2026-02-12 | 13F | Silverarc Capital Management, Llc | 49.228 | -8,08 | 10.497 | -1,41 | ||||
| 2026-02-12 | 13F | Steward Partners Investment Advisory, Llc | 7 | 0,00 | 1 | 0,00 | ||||
| 2026-02-13 | 13F | Chevy Chase Trust Holdings, Inc. | 56.695 | 12.090 | ||||||
| 2026-02-17 | 13F | SageView Advisory Group, LLC | 6 | 1 | ||||||
| 2026-02-03 | 13F | Washington Trust Advisors, Inc. | 0 | -100,00 | 0 | |||||
| 2026-02-12 | 13F | Skandinaviska Enskilda Banken AB (publ) | 38.990 | 35,54 | 8.314 | 45,38 | ||||
| 2026-02-03 | 13F | Diversify Wealth Management, Llc | 7.751 | 6,27 | 1.667 | 13,72 | ||||
| 2026-01-28 | 13F | Chicago Partners Investment Group LLC | 3.498 | 14,24 | 823 | 30,63 | ||||
| 2026-01-30 | 13F | Us Bancorp \de\ | 1.596 | -26,08 | 340 | -20,75 | ||||
| 2026-02-12 | 13F | Campbell & CO Investment Adviser LLC | 2.294 | -80,90 | 489 | -79,51 | ||||
| 2026-02-11 | 13F | Capital International Ltd /ca/ | 16.861 | -22,20 | 3.595 | -16,55 | ||||
| 2026-02-12 | 13F | New York State Common Retirement Fund | 182.234 | 7,26 | 38.860 | 15,05 | ||||
| 2026-02-02 | 13F | Principal Financial Group Inc | 1.026.407 | 29,32 | 218.871 | 38,71 | ||||
| 2026-01-28 | 13F | DekaBank Deutsche Girozentrale | 30.000 | 0,00 | 5 | -20,00 | ||||
| 2026-01-21 | 13F | New Wave Wealth Advisors Llc | 2.518 | 3,66 | 537 | 11,20 | ||||
| 2026-02-12 | 13F | Polen Capital Management Llc | 0 | -100,00 | 0 | |||||
| 2026-03-12 | 13F/A | Peak6 Llc | 2 | 0 | ||||||
| 2026-03-12 | 13F/A | Peak6 Llc | Put | 10.000 | 2.132 | |||||
| 2026-02-10 | 13F | State of Wyoming | 820 | 175 | ||||||
| 2026-02-13 | 13F | Headlands Technologies LLC | 11.564 | 2.466 | ||||||
| 2026-02-17 | 13F | Russell Investments Group, Ltd. | 34.910 | -15,80 | 7.444 | -9,68 | ||||
| 2026-01-23 | 13F | Rsm Us Wealth Management Llc | 1.418 | -0,42 | 297 | 4,59 | ||||
| 2026-02-12 | 13F | AlphaCentric Advisors LLC | 3.238 | 690 | ||||||
| 2025-11-14 | 13F | Caption Management, LLC | 0 | -100,00 | 0 | -100,00 | ||||
| 2026-04-07 | 13F | Farther Finance Advisors, LLC | 635 | 15,45 | 145 | 23,08 | ||||
| 2026-02-17 | 13F | Artia Global Partners LP | 17.740 | 44,93 | 3.783 | 55,45 | ||||
| 2026-04-08 | 13F | E Fund Management (Hong Kong) Co., Ltd. | 60 | 14 | ||||||
| 2026-04-13 | 13F | IFP Advisors, Inc | 12 | 71,43 | 3 | 100,00 | ||||
| 2026-02-09 | 13F | Hantz Financial Services, Inc. | 1.241 | 47,04 | 0 | |||||
| 2026-03-12 | 13F/A | Peak6 Llc | Call | 50.000 | 10.662 | |||||
| 2026-02-13 | 13F | Defilade Capital Management, L.P. | 85.694 | 18.273 | ||||||
| 2025-11-14 | 13F | Lombard Odier Asset Management (Europe) Ltd | 5.827 | |||||||
| 2026-02-17 | 13F | Sphera Funds Management Ltd. | 11.000 | 2.346 | ||||||
| 2026-02-17 | 13F | FIL Ltd | 478.641 | 4,20 | 102.065 | 11,77 | ||||
| 2026-02-17 | 13F | Persistent Asset Partners Ltd | 1.832 | -71,06 | 391 | -69,00 | ||||
| 2026-02-13 | 13F | Manufacturers Life Insurance Company, The | 0 | -100,00 | 0 | |||||
| 2026-02-17 | 13F | Point72 Asset Management, L.P. | Call | 0 | -100,00 | 0 | -100,00 | |||
| 2026-02-05 | 13F | Allworth Financial LP | 11 | -21,43 | 2 | 0,00 | ||||
| 2026-01-29 | 13F | Quent Capital, LLC | 38 | 0,00 | 8 | 14,29 | ||||
| 2026-02-13 | 13F | Verition Fund Management LLC | 7.420 | 1.582 | ||||||
| 2026-02-17 | 13F | Zimmer Partners, LP | 0 | -100,00 | 0 | |||||
| 2026-02-10 | 13F | Nomura Asset Management Co Ltd | 43.701 | 57,48 | 9.319 | 68,90 | ||||
| 2026-04-17 | 13F | Roxbury Financial LLC | 42 | 0,00 | 10 | 12,50 | ||||
| 2026-02-13 | 13F | Frazier Life Sciences Management, L.P. | 133.333 | 0,00 | 28.432 | 7,26 | ||||
| 2026-02-17 | 13F | Bank Of America Corp /de/ | 162.503 | 34.652 | 4.712,78 | |||||
| 2026-02-17 | 13F | Acuta Capital Partners, Llc | 0 | -100,00 | 0 | |||||
| 2026-02-12 | 13F | Sector Gamma As | 16.305 | -32,98 | 3.477 | -28,12 | ||||
| 2026-01-29 | 13F | IMC-Chicago, LLC | Call | 25.300 | 31,77 | 5.395 | 41,32 | |||
| 2026-02-13 | 13F | First Trust Advisors Lp | 12.230 | 75,69 | 2.608 | 88,50 | ||||
| 2026-02-13 | 13F | Truvestments Capital Llc | 0 | -100,00 | 0 | |||||
| 2026-01-16 | 13F | Tema Etfs Llc | 0 | -100,00 | 0 | |||||
| 2026-02-11 | 13F | Commonwealth Retirement Investments LLC | 50 | 11 | ||||||
| 2026-02-17 | 13F | Cape Investment Advisory, Inc. | 5 | 1 | ||||||
| 2026-02-17 | 13F | Perceptive Advisors Llc | 1.081.421 | -0,65 | 230.602 | 6,56 | ||||
| 2026-01-29 | 13F | Rakuten Securities, Inc. | 0 | -100,00 | 0 | |||||
| 2026-02-13 | 13F | Wells Fargo & Company/mn | 33.780 | 6,66 | 7.203 | 14,41 | ||||
| 2026-01-22 | 13F | Personal Cfo Solutions, Llc | 1.455 | 8,02 | 310 | 16,10 | ||||
| 2026-02-17 | 13F | Jain Global LLC | 216.526 | 502,10 | 46.172 | 545,85 | ||||
| 2026-02-17 | 13F | Css Llc/il | Call | 2.000 | 0,00 | 426 | 7,30 | |||
| 2026-02-17 | 13F | Wellington Management Group Llp | 1.762.721 | -2,01 | 375.883 | 5,10 | ||||
| 2026-01-29 | 13F | IMC-Chicago, LLC | 113.682 | 24.242 | ||||||
| 2026-01-29 | 13F | IMC-Chicago, LLC | Put | 12.400 | 2.644 | |||||
| 2026-02-17 | 13F | Css Llc/il | Put | 0 | -100,00 | 0 | -100,00 | |||
| 2026-02-13 | 13F | Rhenman & Partners Asset Management AB | 15.000 | 3.199 | ||||||
| 2026-02-17 | 13F | Susquehanna International Group, Llp | Put | 63.500 | 3,08 | 13.541 | 10,57 | |||
| 2026-02-17 | 13F | Avoro Capital Advisors LLC | Call | 50.000 | 625 | |||||
| 2026-02-11 | 13F | LPL Financial LLC | 14.131 | 43,40 | 3.013 | 53,80 | ||||
| 2026-02-17 | 13F | Susquehanna International Group, Llp | Call | 196.800 | 68,35 | 41.966 | 80,57 | |||
| 2026-04-08 | 13F | Icapital Wealth Llc | 1.451 | 0,00 | 332 | 7,44 | ||||
| 2026-02-17 | 13F | Susquehanna International Group, Llp | 470.951 | 100.426 | ||||||
| 2026-02-17 | 13F | Scientech Research LLC | 2.017 | 430 | ||||||
| 2026-02-05 | 13F | Cambridge Investment Research Advisors, Inc. | 1.115 | 6,19 | 0 | |||||
| 2026-02-17 | 13F | HighVista Strategies LLC | 3.660 | -48,32 | 780 | -44,56 | ||||
| 2026-02-09 | 13F | Hartland & Co., LLC | 2.677 | 227,66 | 571 | 251,85 | ||||
| 2025-11-14 | 13F | Adage Capital Partners Gp, L.l.c. | 0 | -100,00 | 0 | -100,00 | ||||
| 2026-02-11 | 13F | Deutsche Bank Ag\ | 296.818 | 326,71 | 63.293 | 357,68 | ||||
| 2026-02-13 | 13F | Walleye Trading LLC | Call | 21.900 | 32,73 | 4.670 | 42,35 | |||
| 2026-02-11 | 13F | Havemeyer Place LP | 1.352 | 288 | ||||||
| 2026-02-13 | 13F | Neuberger Berman Group LLC | 0 | -100,00 | 0 | |||||
| 2026-02-09 | 13F | Geode Capital Management, Llc | 68.855 | 1,19 | 14.683 | 8,53 | ||||
| 2026-02-13 | 13F | Walleye Trading LLC | Put | 8.600 | 7,50 | 1.834 | 15,28 | |||
| 2026-02-17 | 13F | Lighthouse Investment Partners, LLC | 12.719 | 2.712 | ||||||
| 2026-02-17 | 13F | Caption Management, LLC | Call | 230.000 | 117,80 | 49.045 | 133,61 | |||
| 2026-02-17 | 13F | Caption Management, LLC | Put | 102.500 | 587,92 | 21.857 | 637,91 | |||
| 2026-02-10 | 13F | Daiwa Securities Group Inc. | 3.104 | -15,84 | 1 | |||||
| 2026-02-09 | 13F | Legal & General Group Plc | 14.783 | 938,13 | 3.152 | 1.013,78 | ||||
| 2026-04-20 | 13F | LVW Advisors, LLC | 1.025 | -12,02 | 234 | -5,65 | ||||
| 2026-01-07 | 13F | Gilbert & Cook, Inc. | 8.637 | 26,98 | 1.842 | 36,17 | ||||
| 2026-02-12 | 13F | Ensign Peak Advisors, Inc | 69.560 | -1,65 | 14.833 | 5,49 | ||||
| 2026-02-17 | 13F | Bamco Inc /ny/ | 5.600 | 0,00 | 1.194 | 7,28 | ||||
| 2026-02-17 | 13F | Summit Partners Public Asset Management, Llc | 0 | -100,00 | 0 | |||||
| 2026-01-26 | 13F | KBC Group NV | 356 | 0,00 | 0 | |||||
| 2026-02-17 | 13F | Creative Planning | 6.791 | 2,57 | 1.448 | 10,03 | ||||
| 2026-02-17 | 13F | Guggenheim Capital Llc | 6.734 | 26,91 | 1.436 | 36,15 | ||||
| 2026-02-13 | 13F | Affinity Asset Advisors, LLC | 30.000 | 6.397 | ||||||
| 2026-02-10 | 13F | Bnp Paribas Arbitrage, Sa | 307.086 | 28,74 | 65.483 | 38,09 | ||||
| 2026-02-17 | 13F | Troluce Capital Advisors LLC | 0 | -100,00 | 0 | |||||
| 2026-02-13 | 13F | Lord, Abbett & Co. Llc | 120.197 | -20,62 | 26 | -16,67 | ||||
| 2026-02-10 | 13F | CIBC World Markets Inc. | 6.361 | 3,13 | 1.356 | 10,60 | ||||
| 2026-02-17 | 13F | Toronto Dominion Bank | 0 | -100,00 | 0 | |||||
| 2026-02-17 | 13F | Cinctive Capital Management LP | 0 | -100,00 | 0 | |||||
| 2026-02-13 | 13F | 1832 Asset Management L.P. | 110.000 | 0,00 | 23.456 | 7,26 | ||||
| 2026-02-13 | 13F | Macquarie Group Ltd | 0 | -100,00 | 0 | |||||
| 2026-02-11 | 13F | Franklin Resources Inc | 1.910.079 | 20,13 | 407.305 | 28,85 | ||||
| 2026-02-17 | 13F | Cormorant Asset Management, LP | 100.000 | 21.324 | ||||||
| 2026-02-17 | 13F | Oddo Bhf Asset Management Sas | 129.941 | 8,30 | 27.709 | 16,16 | ||||
| 2026-04-15 | 13F | Bayforest Capital Ltd | 198 | 45 | ||||||
| 2026-02-17 | 13F | T. Rowe Price Investment Management, Inc. | 1.080.224 | -59,49 | 230 | -56,60 | ||||
| 2026-02-06 | 13F | Larson Financial Group LLC | 24 | 380,00 | 5 | |||||
| 2026-02-10 | 13F | Goldman Sachs Group Inc | Call | 0 | -100,00 | 0 | -100,00 | |||
| 2026-02-13 | 13F | Barclays Plc | Call | 100 | 21 | |||||
| 2026-02-13 | 13F | Arrowstreet Capital, Limited Partnership | 0 | -100,00 | 0 | |||||
| 2026-02-13 | 13F | Barclays Plc | 11.244 | 4,28 | 2.398 | 11,85 | ||||
| 2026-02-17 | 13F | D. E. Shaw & Co., Inc. | 125.768 | 3.407,19 | 26.819 | 3.666,57 | ||||
| 2026-02-17 | 13F | Vestal Point Capital, LP | 175.000 | -70,83 | 37.317 | -68,72 | ||||
| 2026-02-06 | 13F | Csenge Advisory Group | 2.946 | 628 | ||||||
| 2026-02-12 | 13F | BlackRock, Inc. | 628.200 | 39,14 | 133.957 | 49,24 | ||||
| 2026-02-17 | 13F | Capital Fund Management S.a. | 16.371 | 3.491 | ||||||
| 2026-02-06 | 13F | Leonteq Securities AG | 169 | 2.012,50 | 36 | 3.500,00 | ||||
| 2026-02-17 | 13F | D. E. Shaw & Co., Inc. | Call | 5.700 | 14,00 | 1.215 | 22,23 | |||
| 2026-02-17 | 13F | Driehaus Capital Management Llc | 156.272 | -12,78 | 33.323 | -6,45 | ||||
| 2026-02-09 | 13F | Huntington National Bank | 1 | 0 | ||||||
| 2026-02-17 | 13F | DV Trading LLC | 1 | 0 | ||||||
| 2026-01-29 | 13F | Matisse Capital | 27.305 | 4,94 | 5.823 | 12,55 | ||||
| 2026-02-17 | 13F | Ra Capital Management, L.p. | 10.281.496 | 0,00 | 2.192.426 | 7,26 | ||||
| 2026-03-23 | 13F/A | Barclays Plc | Put | 0 | -100,00 | 0 | -100,00 | |||
| 2026-01-22 | 13F | Massachusetts Financial Services Co /ma/ | 1.886.393 | 0,19 | 402.254 | 7,46 | ||||
| 2026-04-17 | 13F | PSP Research LLC | 2.500 | -3,06 | 572 | 4,01 | ||||
| 2026-02-11 | 13F | Simplex Trading, Llc | Call | 37.100 | 7,54 | 7.911 | 131.750,00 | |||
| 2026-02-11 | 13F | Simplex Trading, Llc | Put | 900 | -60,87 | 192 | ||||
| 2026-02-13 | 13F | Citigroup Inc | Put | 20.000 | 4.265 | |||||
| 2026-02-17 | 13F | Citadel Advisors Llc | Put | 18.700 | 122,62 | 3.988 | 138,74 | |||
| 2026-02-13 | 13F | Citigroup Inc | 30.843 | 38,24 | 6.577 | 48,28 | ||||
| 2026-02-13 | 13F | Citigroup Inc | Call | 75.900 | 16.185 | |||||
| 2026-02-17 | 13F | Citadel Advisors Llc | Call | 60.700 | -35,29 | 12.944 | -30,59 | |||
| 2026-02-17 | 13F | Citadel Advisors Llc | 519.516 | 1.779,58 | 110.782 | 1.916,03 | ||||
| 2026-04-22 | 13F | Sterling Capital Management LLC | 14.929 | -39,82 | 3.415 | -35,46 | ||||
| 2026-01-27 | 13F | WealthCollab, LLC | 3 | 0,00 | 1 | |||||
| 2026-02-17 | 13F | Canada Pension Plan Investment Board | 71.516 | 169,56 | 15.250 | 189,15 | ||||
| 2025-11-14 | 13F | Wolverine Trading, Llc | Put | 0 | -100,00 | 0 | ||||
| 2026-02-10 | 13F | AdvisorShares Investments LLC | 5.716 | 2,84 | 1.219 | 10,33 | ||||
| 2026-02-17 | 13F | Raymond James Financial Inc | 6.662 | 103,79 | 1.421 | 118,80 | ||||
| 2026-02-17 | 13F | Farallon Capital Management Llc | 1.400 | 0,00 | 299 | 7,19 | ||||
| 2026-02-13 | 13F | SRS Capital Advisors, Inc. | 153 | 212,24 | 33 | 255,56 | ||||
| 2026-02-17 | 13F | Virtus Investment Advisers, Inc. | 3.100 | 19,23 | 661 | 28,10 | ||||
| 2026-02-13 | 13F | Sei Investments Co | 281.473 | 37,09 | 60.021 | 47,04 | ||||
| 2026-02-13 | 13F | Kilter Group LLC | 0 | -100,00 | 0 | |||||
| 2026-02-03 | 13F | Morse Asset Management, Inc | 6.489 | 1.384 | ||||||
| 2026-01-30 | 13F | Sigma Planning Corp | 4.784 | -37,09 | 1.020 | -32,50 | ||||
| 2026-02-17 | 13F | Eversept Partners, LP | 48.241 | 10.287 | ||||||
| 2026-02-13 | 13F | Quarry LP | 576 | -81,83 | 123 | -80,63 | ||||
| 2026-01-29 | 13F | Calamos Advisors LLC | 16.300 | 152,71 | 3.476 | 171,06 | ||||
| 2026-02-17 | 13F | Diadema Partners Lp | 6.840 | -75,19 | 1.459 | -73,40 | ||||
| 2026-02-17 | 13F | Aquatic Capital Management LLC | 0 | -100,00 | 0 | |||||
| 2026-01-06 | 13F | Sanctuary Advisors, LLC | 0 | -100,00 | 0 | -100,00 | ||||
| 2026-02-09 | 13F | Beck Bode, LLC | 81.087 | 17.291 | ||||||
| 2026-02-06 | 13F | Global Retirement Partners, LLC | 214 | 111,88 | 46 | 125,00 | ||||
| 2026-02-17 | 13F | Moore Capital Management, Lp | 125.000 | 38,89 | 26.655 | 48,98 | ||||
| 2026-02-11 | 13F | GW&K Investment Management, LLC | 226 | 0 | ||||||
| 2026-02-17 | 13F | Lazard Asset Management Llc | 39.135 | -6,22 | 8.345 | 0,59 | ||||
| 2026-02-17 | 13F | Brevan Howard Capital Management LP | 48.260 | 10.152 | ||||||
| 2026-02-17 | 13F | Lighthouse Investment Partners, LLC | Put | 0 | -100,00 | 0 | ||||
| 2026-02-17 | 13F | Ameriprise Financial Inc | 550.477 | 117.384 | 1.469,29 | |||||
| 2026-02-11 | 13F | Capital International Inc /ca/ | 9.065 | -13,46 | 1.933 | -7,16 | ||||
| 2026-04-21 | 13F | PharVision Advisers, LLC | 0 | -100,00 | 0 | |||||
| 2026-02-13 | 13F | Brown Advisory Inc | 24.544 | -3,11 | 5.234 | 3,91 | ||||
| 2026-02-17 | 13F | Mercer Global Advisors Inc /adv | 1.058 | 0,00 | 226 | 7,14 | ||||
| 2026-02-10 | 13F | Natixis Advisors, L.p. | 0 | -100,00 | 0 | |||||
| 2026-02-17 | 13F | Public Employees Retirement System Of Ohio | 5.784 | -54,85 | 1.233 | -51,57 | ||||
| 2026-02-13 | 13F | Victory Capital Management Inc | 43.190 | -79,33 | 9.210 | -77,83 | ||||
| 2026-02-11 | 13F | Parallel Advisors, LLC | 156 | 0,00 | 33 | 6,45 | ||||
| 2026-02-17 | 13F | Delaware Management Holdings, Inc. | 496.837 | 105.946 | ||||||
| 2026-02-17 | 13F | DAFNA Capital Management LLC | 28.177 | 6.008 | 10,40 | |||||
| 2026-02-11 | 13F | Vise Technologies, Inc. | 0 | -100,00 | 0 | |||||
| 2026-02-10 | 13F | Td Asset Management Inc | 234.012 | -21,03 | 49.901 | -15,30 | ||||
| 2026-02-17 | 13F | Engineers Gate Manager LP | 7.478 | -33,11 | 1.595 | -28,26 | ||||
| 2026-02-11 | 13F | Dearborn Partners Llc | 1.300 | 0,00 | 277 | 7,36 | ||||
| 2026-02-17 | 13F | Ally Bridge Group (NY) LLC | 0 | -100,00 | 0 | |||||
| 2026-01-20 | 13F | Harbor Capital Advisors, Inc. | 22.734 | -1,17 | 5 | 0,00 | ||||
| 2026-02-13 | 13F | Hudson Bay Capital Management LP | 0 | -100,00 | 0 | |||||
| 2026-02-17 | 13F | Parkman Healthcare Partners LLC | 0 | -100,00 | 0 | |||||
| 2026-04-09 | 13F | Nelson, Van Denburg & Campbell Wealth Management Group, LLC | 5.463 | -16,02 | 1.250 | -9,95 | ||||
| 2026-02-17 | 13F | Great Point Partners Llc | 0 | -100,00 | 0 | |||||
| 2026-02-17 | 13F | Catalio Capital Management, LP | 119.265 | -17,72 | 25.432 | -11,75 | ||||
| 2026-02-17 | 13F | Bellevue Group AG | 24.330 | -2,30 | 5.188 | 4,81 | ||||
| 2026-02-10 | 13F | Main Management ETF Advisors, LLC | 10.962 | 1,03 | 2 | 0,00 | ||||
| 2026-02-13 | 13F | Transamerica Financial Advisors, Inc. | 0 | -100,00 | 0 | |||||
| 2026-02-05 | 13F | Bessemer Group Inc | 18 | 0 | ||||||
| 2026-01-15 | 13F | Allspring Global Investments Holdings, LLC | 187.642 | -2,10 | 40.022 | 2,30 | ||||
| 2026-02-11 | 13F | MidWestOne Financial Group, Inc. | 3.067 | 654 | ||||||
| 2026-02-17 | 13F | XTX Topco Ltd | 4.459 | 951 | ||||||
| 2026-02-06 | 13F | Cullen/frost Bankers, Inc. | 47 | 4,44 | 10 | 25,00 | ||||
| 2026-02-13 | 13F | Mariner, LLC | 2.568 | 24,30 | 548 | 33,41 | ||||
| 2026-02-17 | 13F | Tri Locum Partners LP | 265.015 | 51,59 | 56.512 | 62,59 | ||||
| 2026-02-10 | 13F | Acadian Asset Management Llc | 5.291 | -56,77 | 1 | -50,00 | ||||
| 2026-02-11 | 13F | Allianz Asset Management GmbH | 5.948 | -28,54 | 1.268 | -23,34 | ||||
| 2026-01-29 | 13F | UBS Group AG | 308.190 | 57,88 | 65.718 | 69,34 | ||||
| 2026-01-26 | 13F | Mirae Asset Global Investments Co., Ltd. | 6.941 | 14,14 | 1.480 | 22,52 | ||||
| 2026-02-13 | 13F | Kennedy Capital Management, Inc. | 19.862 | 0,62 | 4.235 | 7,93 | ||||
| 2026-02-12 | 13F | Advisors Asset Management, Inc. | 12.394 | 16,83 | 2.643 | 25,27 | ||||
| 2026-02-17 | 13F | Rock Springs Capital Management LP | 203.500 | -5,13 | 43.394 | 1,76 | ||||
| 2026-02-17 | 13F | Woodline Partners LP | 102.461 | 0,00 | 21.849 | 7,26 | ||||
| 2025-11-13 | 13F | Jefferies Financial Group Inc. | Call | 0 | -100,00 | 0 | -100,00 | |||
| 2026-02-18 | 13F | Vident Advisory, LLC | 1.926 | -4,84 | 411 | 1,99 | ||||
| 2026-01-30 | 13F | Camden Capital, LLC | 1.170 | 5,69 | 249 | 13,18 | ||||
| 2026-02-12 | 13F | CIBC Private Wealth Group, LLC | 9.382 | 11,98 | 2.001 | 20,12 | ||||
| 2026-02-13 | 13F | Candriam Luxembourg S.C.A. | 186.940 | 4,46 | 39.865 | 12,05 | ||||
| 2026-02-03 | 13F | SBI Securities Co., Ltd. | 4 | 0,00 | 1 | |||||
| 2026-02-17 | 13F | Jump Financial, LLC | 27.600 | 106,93 | 5.885 | 121,99 | ||||
| 2026-02-06 | 13F | Legato Capital Management LLC | 2.023 | 15,80 | 431 | 24,21 | ||||
| 2025-12-01 | 13F | Groupama Asset Managment | 535 | 5,74 | ||||||
| 2026-02-11 | 13F | Capital Group Investment Management Pte. Ltd. | 2.906 | -25,14 | 620 | -19,71 | ||||
| 2026-02-12 | 13F | Loomis Sayles & Co L P | 112.240 | -26,83 | 23.934 | -21,52 | ||||
| 2026-01-29 | 13F | China Universal Asset Management Co., Ltd. | 10.004 | -6,22 | 2.133 | 0,61 | ||||
| 2026-02-17 | 13F | LMR Partners LLP | Call | 21.000 | 0,00 | 4.478 | 7,26 | |||
| 2026-04-13 | 13F | Whalen Wealth Management Inc. | 1.867 | 427 | ||||||
| 2026-02-17 | 13F | NEOS Investment Management LLC | 1.799 | -51,14 | 384 | -47,68 | ||||
| 2026-02-17 | 13F | Polar Capital Holdings Plc | 370.473 | -56,82 | 79.000 | -53,68 | ||||
| 2026-02-17 | 13F | Qube Research & Technologies Ltd | 193.464 | -33,33 | 41.254 | -28,49 | ||||
| 2025-11-14 | 13F | Integral Health Asset Management, LLC | 60.000 | 11.929 | ||||||
| 2026-02-13 | 13F | First Turn Management, LLC | 131.808 | -9,90 | 28.107 | -3,36 | ||||
| 2026-02-17 | 13F | Trexquant Investment LP | 59.025 | 113,97 | 12.586 | 129,50 | ||||
| 2026-02-20 | 13F | Dorsey Wright & Associates | 8.504 | 3,19 | 1.813 | 10,68 | ||||
| 2026-02-17 | 13F | Voleon Capital Management Lp | 69.389 | 117,34 | 14.797 | 133,12 | ||||
| 2026-02-11 | 13F | Capital International Investors | 3.063.943 | 0,11 | 653.355 | 7,37 | ||||
| 2026-02-11 | 13F | Arrowpoint Investment Partners (Singapore) Pte. Ltd. | 2.997 | 639 | ||||||
| 2026-04-17 | 13F | Bell Investment Advisors, Inc | 25 | -51,92 | 6 | -54,55 | ||||
| 2026-02-11 | 13F | Empowered Funds, LLC | 36.697 | 1,72 | 7.825 | 9,10 | ||||
| 2026-02-12 | 13F | Quadrant Capital Group Llc | 372 | 0,00 | 79 | 8,22 | ||||
| 2026-04-22 | 13F | Pictet Asset Management Holding SA | 251.833 | 243,01 | 56.907 | 267,33 | ||||
| 2026-02-17 | 13F | Balyasny Asset Management Llc | 24.079 | 5.135 | ||||||
| 2026-04-16 | 13F | SG Americas Securities, LLC | 120.790 | 28 | 8,00 | |||||
| 2026-02-13 | 13F | Smartleaf Asset Management LLC | 53 | 307,69 | 11 | 450,00 | ||||
| 2026-02-06 | 13F | ProShare Advisors LLC | 2.712 | 25,09 | 578 | 34,11 | ||||
| 2026-02-17 | 13F | Tower Research Capital LLC (TRC) | 488 | 81,41 | 104 | 96,23 | ||||
| 2026-01-27 | 13F | Zurcher Kantonalbank (Zurich Cantonalbank) | 56 | 0,00 | 12 | 0,00 | ||||
| 2026-02-17 | 13F/A | Beverly Hills Private Wealth, LLC | 958 | 204 | ||||||
| 2025-11-14 | 13F | Saturn V Capital Management LLC | 0 | -100,00 | 0 | |||||
| 2026-02-06 | 13F | Handelsbanken Fonder AB | 14.267 | 5,16 | 3 | 50,00 | ||||
| 2026-02-17 | 13F | Price T Rowe Associates Inc /md/ | 1.570.260 | -9,04 | 335 | -2,62 | ||||
| 2026-02-12 | 13F | Barometer Capital Management Inc. | 0 | -100,00 | 0 | |||||
| 2026-02-13 | 13F | First National Bank Of Omaha | 9.943 | 2.081 | ||||||
| 2026-02-17 | 13F | DZ BANK AG Deutsche Zentral Genossenschafts Bank, Frankfurt am Main | 48.097 | -10,48 | 10.256 | -3,99 | ||||
| 2026-02-17 | 13F | Readystate Asset Management Lp | 0 | -100,00 | 0 | |||||
| 2026-04-07 | 13F | Signaturefd, Llc | 700 | 1,45 | 160 | 8,84 | ||||
| 2026-02-17 | 13F | Artisan Partners Limited Partnership | 3.225.885 | -13,30 | 687.888 | -7,01 | ||||
| 2026-02-02 | 13F | Truist Financial Corp | 1.789 | 38,15 | 381 | 48,25 | ||||
| 2026-02-17 | 13F | Boothbay Fund Management, Llc | 0 | -100,00 | 0 | |||||
| 2026-02-03 | 13F | Legacy Wealth Managment, LLC/ID | 3 | 1 | ||||||
| 2026-02-12 | 13F | Nuveen, LLC | 9.098 | -1,14 | 1.940 | 6,07 | ||||
| 2025-11-14 | 13F | Walleye Trading LLC | 0 | -100,00 | 0 | -100,00 | ||||
| 2026-04-16 | 13F | ARS Investment Partners, LLC | 209.456 | 19,96 | 47.909 | 28,67 | ||||
| 2026-02-13 | 13F | Rice Hall James & Associates, Llc | 145.046 | -1,39 | 30.930 | 5,77 | ||||
| 2026-02-03 | 13F | Crossmark Global Holdings, Inc. | 7.393 | 51,06 | 1.576 | 62,14 | ||||
| 2025-11-14 | 13F | ExodusPoint Capital Management, LP | 24.723 | 49,43 | 4.915 | 245.650,00 | ||||
| 2026-02-17 | 13F | Q Global Advisors, LLC | 190.000 | 11,76 | 41 | 21,21 | ||||
| 2026-02-12 | 13F | Commonwealth Equity Services, Llc | 1.167 | 249 | ||||||
| 2026-02-13 | 13F | Ubs Asset Management Americas Inc | 25 | 5 | ||||||
| 2026-04-02 | 13F/A | Seven Fleet Capital Management LP | 5.670 | 1.209 | ||||||
| 2026-02-10 | 13F | Bank of New York Mellon Corp | 194.605 | -7,02 | 41.497 | -0,27 | ||||
| 2026-04-16 | 13F | Diversified Trust Co | 37.161 | -12,05 | 8.500 | -5,66 | ||||
| 2026-02-17 | 13F | Atom Investors LP | 15.478 | 65,88 | 3.301 | 77,90 | ||||
| 2026-01-27 | 13F | TD Waterhouse Canada Inc. | 0 | -100,00 | 0 | |||||
| 2026-02-02 | 13F | Fifth Third Bancorp | 209 | 0,00 | 45 | 7,32 | ||||
| 2026-02-12 | 13F | Principal Securities, Inc. | 0 | -100,00 | 0 | |||||
| 2025-11-14 | 13F | Binnacle Investments Inc | 3 | 0,00 | 1 | |||||
| 2026-02-18 | 13F | GWM Advisors LLC | 90 | 19 |
Other Listings
| US:ASND | 229,27 $ |