Grundlæggende statistik
| Institutionelle aktier (lange) | 51.812.900 - 72,07% (ex 13D/G) - change of -4,09MM shares -7,31% MRQ |
| Institutionel værdi (lang) | $ 1.893.085 USD ($1000) |
Institutionelt ejerskab og aktionærer
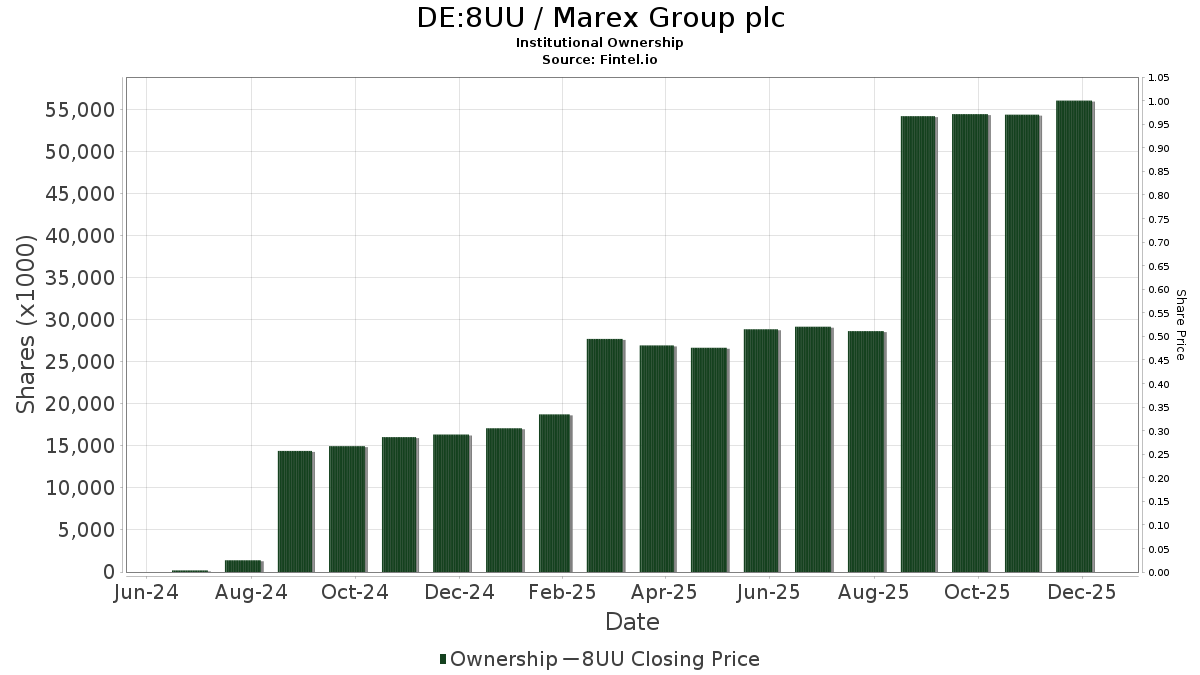
Marex Group plc (DE:8UU) har 198 institutionelle ejere og aktionærer, der har indsendt 13D/G- eller 13F-formularer til Securities Exchange Commission (SEC). Disse institutioner har i alt 51,812,900 aktier. Største aktionærer omfatter BlackRock, Inc., Capital International Investors, Loomis Sayles & Co L P, Grandeur Peak Global Advisors, LLC, Alliancebernstein L.p., William Blair Investment Management, Llc, Price T Rowe Associates Inc /md/, Jennison Associates Llc, Balyasny Asset Management Llc, and Granahan Investment Management Inc/ma .
Marex Group plc (DUSE:8UU) institutionel ejerskabsstruktur viser aktuelle positioner i virksomheden efter institutioner og fonde, samt seneste ændringer i positionsstørrelse. Større aktionærer kan omfatte individuelle investorer, investeringsforeninger, hedgefonde eller institutioner. Skema 13D angiver, at investoren besidder (eller besidder) mere end 5 % af virksomheden og har til hensigt (eller har til hensigt at) aktivt at forfølge en ændring i forretningsstrategi. Skema 13G indikerer en passiv investering på over 5%.
The share price as of April 24, 2026 is 43,80 / share. Previously, on April 28, 2025, the share price was 36,80 / share. This represents an increase of 19,02% over that period.
Fondens stemningsscore
Fund Sentiment Score (fka Ownership Accumulation Score) finder de aktier, der bliver mest købt af fonde. Det er resultatet af en sofistikeret, multi-faktor kvantitativ model, der identificerer virksomheder med de højeste niveauer af institutionel akkumulering. Scoringsmodellen bruger en kombination af den samlede stigning i oplyste ejere, ændringerne i porteføljeallokeringer i disse ejere og andre målinger. Tallet går fra 0 til 100, hvor højere tal indikerer et højere niveau af akkumulering for sine jævnaldrende, og 50 er gennemsnittet.
Opdateringsfrekvens: Dagligt
Se Ownership Explorer, som giver en liste over højest rangerende virksomheder.
AI+ Ask Fintel’s AI assistant about Marex Group plc.
Select a question to share a public post with an AI-crafted answer.
Thinking of good questions…
13F og NPORT arkivering
Detaljer om 13F-arkivering er gratis. Detaljer om NP-ansøgninger kræver et premium-medlemskab. Grønne rækker angiver nye positioner. Røde rækker angiver lukkede positioner. Klik på linket ikon for at se den fulde transaktionshistorik.
Opgrader
for at låse premium-data op og eksportere til Excel ![]() .
.
| Fil dato | Kilde | Investor | Type | Gennemsnitlig pris (Øst) |
Aktier | Δ Aktier (%) |
Rapporteret Værdi ($1000) |
Δ Værdi (%) |
Port Alloc (%) |
|
|---|---|---|---|---|---|---|---|---|---|---|
| 2026-01-20 | 13F | Harbor Capital Advisors, Inc. | 365 | -1,62 | 0 | |||||
| 2026-02-05 | 13F | Bessemer Group Inc | 3.260 | 0,00 | 0 | |||||
| 2026-02-11 | 13F | Zions Bancorporation, National Association /ut/ | 29 | 1 | ||||||
| 2025-11-12 | 13F | Monashee Investment Management LLC | 0 | -100,00 | 0 | |||||
| 2025-11-07 | 13F | State of New Jersey Common Pension Fund D | 0 | -100,00 | 0 | -100,00 | ||||
| 2026-02-11 | 13F | Janney Capital Management LLC | 10.056 | 1,76 | 0 | |||||
| 2026-02-12 | 13F | Steward Partners Investment Advisory, Llc | 2.243 | -3,53 | 86 | 10,26 | ||||
| 2026-04-09 | 13F | Moody National Bank Trust Division | 86.630 | -11,81 | 3.862 | 2,47 | ||||
| 2026-02-12 | 13F | Brinker Capital Investments, LLC | 23.508 | 152,64 | 902 | 188,78 | ||||
| 2026-04-24 | 13F | Strs Ohio | 19.700 | -15,09 | 878 | -1,24 | ||||
| 2025-11-13 | 13F | Limestone Investment Advisors LP | 0 | -100,00 | 0 | |||||
| 2026-02-06 | 13F | HighTower Advisors, LLC | 14.505 | 556 | ||||||
| 2026-02-10 | 13F | Natixis Advisors, L.p. | 12.141 | 0 | ||||||
| 2026-02-17 | 13F | Aster Capital Management (DIFC) Ltd | 1.135 | -48,60 | 44 | -41,89 | ||||
| 2026-04-22 | 13F | Stone House Investment Management, LLC | 501 | 29,79 | 22 | 57,14 | ||||
| 2026-01-23 | 13F | Rsm Us Wealth Management Llc | 10.168 | -2,87 | 394 | 12,25 | ||||
| 2026-02-13 | 13F | Alyeska Investment Group, L.P. | 152.375 | -56,76 | 5.845 | -50,66 | ||||
| 2026-02-17 | 13F | Qube Research & Technologies Ltd | 763.460 | -26,56 | 29.286 | -16,20 | ||||
| 2025-11-14 | 13F | Zimmer Partners, LP | 0 | -100,00 | 0 | |||||
| 2026-02-05 | 13F | Amalgamated Bank | 1.731 | 59,10 | 0 | |||||
| 2026-02-12 | 13F | Voya Investment Management Llc | 8.875 | 6,22 | 340 | 21,43 | ||||
| 2026-02-09 | 13F | Royce & Associates Lp | 1.260.709 | -11,15 | 48.361 | 1,38 | ||||
| 2026-02-17 | 13F | Fmr Llc | 1.334.798 | 76,47 | 51.203 | 101,35 | ||||
| 2026-02-06 | 13F | ProShare Advisors LLC | 10.072 | 9,38 | 386 | 24,92 | ||||
| 2026-02-17 | 13F | Westwood Holdings Group Inc | 564.236 | -5,45 | 21.644 | 7,87 | ||||
| 2026-01-23 | 13F | Assetmark, Inc | 46 | -97,34 | 2 | -98,28 | ||||
| 2026-02-14 | 13F | Rockefeller Capital Management L.P. | 1.180 | -7,81 | 45 | 4,65 | ||||
| 2026-02-13 | 13F | State Street Corp | 839.536 | 5,79 | 32.205 | 20,70 | ||||
| 2026-02-06 | 13F | Pnc Financial Services Group, Inc. | 37 | -24,49 | 1 | 0,00 | ||||
| 2026-02-17 | 13F | Mirabella Financial Services Llp | 5.265 | 202 | ||||||
| 2026-02-12 | 13F | Loomis Sayles & Co L P | 1.935.503 | 8,32 | 74.246 | 23,60 | ||||
| 2026-02-13 | 13F | Morgan Stanley | 554.490 | -30,05 | 21.270 | -20,19 | ||||
| 2026-01-23 | 13F | Robeco Institutional Asset Management B.V. | 0 | -100,00 | 0 | |||||
| 2026-02-17 | 13F | Bank Of America Corp /de/ | 286.692 | -26,50 | 10.998 | -16,13 | ||||
| 2026-01-15 | 13F | Nisa Investment Advisors, Llc | 280 | 0,00 | 11 | 11,11 | ||||
| 2026-02-10 | 13F | Quantbot Technologies LP | 36.535 | 40,44 | 1.401 | 60,30 | ||||
| 2026-02-13 | 13F | Caitong International Asset Management Co., Ltd | 460 | -31,14 | 18 | -22,73 | ||||
| 2026-02-13 | 13F | SRS Capital Advisors, Inc. | 0 | -100,00 | 0 | |||||
| 2026-02-13 | 13F | Barclays Plc | 85.867 | 7,34 | 3.294 | 22,46 | ||||
| 2026-04-13 | 13F | True Wealth Design, LLC | 6 | 0,00 | 0 | |||||
| 2026-02-13 | 13F | Squarepoint Ops LLC | 9.617 | -95,26 | 369 | -94,60 | ||||
| 2026-02-18 | 13F | Mackenzie Financial Corp | 54.067 | 87,17 | 2.093 | 115,55 | ||||
| 2026-01-29 | 13F | Calamos Advisors LLC | 83.206 | 3.192 | ||||||
| 2026-02-11 | 13F | Picton Mahoney Asset Management | 0 | -100,00 | 0 | |||||
| 2026-02-17 | 13F | Main Street Financial Solutions, LLC | 50.000 | 11,11 | 1.918 | 26,85 | ||||
| 2026-02-09 | 13F | Jefferies Financial Group Inc. | 0 | -100,00 | 0 | |||||
| 2026-02-13 | 13F | Manufacturers Life Insurance Company, The | 0 | -100,00 | 0 | |||||
| 2026-02-13 | 13F | Neuberger Berman Group LLC | 22.460 | 862 | ||||||
| 2026-01-27 | 13F | WealthCollab, LLC | 75 | 0,00 | 3 | 0,00 | ||||
| 2026-02-13 | 13F | Victory Capital Management Inc | 670.025 | 25.702 | ||||||
| 2026-02-17 | 13F | Trexquant Investment LP | 98.167 | -4,32 | 3.766 | 9,16 | ||||
| 2026-02-23 | 13F | Virtu Financial LLC | 7.647 | 0 | ||||||
| 2026-02-17 | 13F | Royal Bank Of Canada | 12.537 | -98,14 | 482 | -97,88 | ||||
| 2026-02-11 | 13F | Ameritas Investment Partners, Inc. | 4.498 | 0,00 | 173 | 13,91 | ||||
| 2025-11-14 | 13F | Hughes Financial Services, LLC | 0 | -100,00 | 0 | |||||
| 2026-02-12 | 13F | Quadrant Capital Group Llc | 876 | 307,44 | 34 | 371,43 | ||||
| 2026-04-22 | 13F | Sterling Capital Management LLC | 822 | -34,55 | 37 | -25,00 | ||||
| 2026-02-17 | 13F | Caption Management, LLC | Put | 0 | -100,00 | 0 | ||||
| 2025-12-01 | 13F/A | Polar Asset Management Partners Inc. | 0 | -100,00 | 0 | -100,00 | ||||
| 2026-01-29 | 13F | UBS Group AG | 110.094 | -67,04 | 4.223 | -62,39 | ||||
| 2026-02-17 | 13F | Twinbeech Capital Lp | 0 | -100,00 | 0 | |||||
| 2025-10-28 | 13F | Csenge Advisory Group | 0 | -100,00 | 0 | |||||
| 2026-02-13 | 13F | Pinnacle Wealth Planning Services, Inc. | 8 | 0 | ||||||
| 2026-02-10 | 13F | Globeflex Capital L P | 215.606 | 2,83 | 8.271 | 17,32 | ||||
| 2026-02-13 | 13F | Thornburg Investment Management Inc | 1.102.143 | 5,03 | 42.278 | 19,84 | ||||
| 2026-02-11 | 13F | Los Angeles Capital Management Llc | 21.079 | -58,11 | 637 | -62,39 | ||||
| 2025-11-12 | 13F | Simplex Trading, Llc | 0 | -100,00 | 0 | |||||
| 2026-02-11 | 13F | Fox Run Management, L.l.c. | 17.995 | 690 | ||||||
| 2025-11-14 | 13F | Fortress Investment Group LLC | 0 | -100,00 | 0 | |||||
| 2026-02-12 | 13F | MetLife Investment Management, LLC | 30.323 | -3,99 | 1.163 | 9,61 | ||||
| 2025-11-13 | 13F | Riggs Asset Managment Co. Inc. | 0 | -100,00 | 0 | |||||
| 2026-02-17 | 13F | Creative Planning | 157.610 | 30,62 | 6.046 | 49,04 | ||||
| 2026-04-13 | 13F | Massmutual Trust Co Fsb/adv | 82 | 0,00 | 4 | 0,00 | ||||
| 2026-02-11 | 13F | Parallel Advisors, LLC | 30 | 1 | ||||||
| 2026-02-13 | 13F | Peak6 Llc | 0 | -100,00 | 0 | |||||
| 2025-11-14 | 13F | Nbc Securities, Inc. | 0 | -100,00 | 0 | |||||
| 2026-01-30 | 13F | Bogart Wealth, LLC | 12 | 0,00 | 0 | |||||
| 2026-02-17 | 13F | Amundi | 7.489 | 287 | ||||||
| 2025-11-07 | 13F | Gsa Capital Partners Llp | 0 | -100,00 | 0 | |||||
| 2026-02-12 | 13F | CIBC Private Wealth Group, LLC | 23 | 0,00 | 1 | |||||
| 2026-01-30 | 13F | R Squared Ltd | 0 | -100,00 | 0 | |||||
| 2026-02-12 | 13F | Renaissance Technologies Llc | 220.787 | -57,12 | 8.469 | -51,07 | ||||
| 2026-02-11 | 13F | Deltroit Asset Management (UK) LLP | 474.773 | 18.212 | ||||||
| 2026-02-17 | 13F | Aqr Capital Management Llc | 25.221 | 199,96 | 967 | 242,91 | ||||
| 2026-02-17 | 13F | Ameriprise Financial Inc | 860.024 | -1,53 | 32.991 | 12,36 | ||||
| 2026-02-06 | 13F | EverSource Wealth Advisors, LLC | 905 | 45.150,00 | 35 | |||||
| 2026-02-02 | 13F | Montag A & Associates Inc | 0 | -100,00 | 0 | |||||
| 2026-02-17 | 13F | Susquehanna International Group, Llp | Put | 0 | -100,00 | 0 | -100,00 | |||
| 2026-02-13 | 13F | Entropy Technologies, LP | 0 | -100,00 | 0 | |||||
| 2026-04-20 | 13F | State of Alaska, Department of Revenue | 17.330 | 0,00 | 1 | |||||
| 2025-11-14 | 13F | Susquehanna International Group, Llp | 0 | -100,00 | 0 | -100,00 | ||||
| 2025-11-13 | 13F | Norges Bank | 0 | -100,00 | 0 | |||||
| 2025-11-14 | 13F | Sandia Investment Management LP | 0 | -100,00 | 0 | |||||
| 2025-11-14 | 13F | Wolverine Trading, Llc | Put | 7.700 | 262 | |||||
| 2026-04-24 | 13F | UMA Financial Services, Inc. | 6 | 0 | ||||||
| 2025-11-14 | 13F | Nomura Holdings Inc | 0 | -100,00 | 0 | |||||
| 2026-02-13 | 13F | Marshall Wace, Llp | 114.417 | 4.389 | ||||||
| 2026-02-17 | 13F | Mangrove Partners | 8.970 | 344 | ||||||
| 2026-02-13 | 13F | Sei Investments Co | 351.583 | 0,49 | 13.487 | 14,66 | ||||
| 2026-04-07 | 13F | Signaturefd, Llc | 216 | -21,17 | 10 | -10,00 | ||||
| 2026-02-13 | 13F | Verition Fund Management LLC | 18.000 | 5,26 | 690 | 20,21 | ||||
| 2026-02-13 | 13F | Neo Ivy Capital Management | 3.438 | 132 | ||||||
| 2026-02-17 | 13F | Glenmede Trust Co Na | 326.415 | 2.024,41 | 12.521 | 2.210,15 | ||||
| 2026-02-06 | 13F | Covestor Ltd | 56 | 0 | ||||||
| 2026-02-09 | 13F | Harbour Investments, Inc. | 0 | -100,00 | 0 | |||||
| 2026-04-16 | 13F | SG Americas Securities, LLC | 184.519 | 1.217,43 | 8 | |||||
| 2026-02-17 | 13F | Jones Financial Companies Lllp | 320 | -42,86 | 12 | -36,84 | ||||
| 2026-02-13 | 13F | Rhumbline Advisers | 65.244 | -8,32 | 2.503 | 4,60 | ||||
| 2026-02-12 | 13F | Counterpoint Mutual Funds LLC | 13.116 | -11,14 | 503 | 1,41 | ||||
| 2026-02-02 | 13F | Sparta 24 Ltd. | 32.581 | 1.250 | ||||||
| 2026-02-13 | 13F | Walleye Capital LLC | 10.876 | -88,73 | 417 | -87,15 | ||||
| 2026-02-12 | 13F | Jane Street Group, Llc | 12.787 | -78,94 | 491 | -75,99 | ||||
| 2025-11-12 | 13F | Nomura Asset Management Co Ltd | 0 | 0 | ||||||
| 2026-02-17 | 13F | PDT Partners, LLC | 0 | -100,00 | 0 | |||||
| 2026-02-13 | 13F | FJ Capital Management LLC | 81.199 | -15,14 | 3.115 | -3,17 | ||||
| 2026-02-17 | 13F | Northern Trust Corp | 275.919 | -10,10 | 10.584 | 2,58 | ||||
| 2025-11-13 | 13F | Quadrature Capital Ltd | 0 | -100,00 | 0 | -100,00 | ||||
| 2026-02-03 | 13F | SBI Securities Co., Ltd. | 299 | 14,12 | 11 | 37,50 | ||||
| 2026-02-17 | 13F | Adage Capital Partners Gp, L.l.c. | 1.305.455 | -2,03 | 50.077 | 11,78 | ||||
| 2026-04-24 | 13F | Root Financial Partners, LLC | 122 | 5 | ||||||
| 2026-02-17 | 13F | Quantinno Capital Management LP | 12.544 | 481 | ||||||
| 2026-01-30 | 13F | Jennison Associates Llc | 1.475.255 | 1,48 | 56.591 | 15,78 | ||||
| 2026-02-17 | 13F | Millennium Management Llc | Call | 0 | -100,00 | 0 | ||||
| 2026-02-17 | 13F | Cinctive Capital Management LP | 50.000 | -44,44 | 1.918 | -36,60 | ||||
| 2026-02-17 | 13F | Voloridge Investment Management, Llc | 422.471 | -37,34 | 16.206 | -28,51 | ||||
| 2026-02-17 | 13F | PharVision Advisers, LLC | 0 | -100,00 | 0 | -100,00 | ||||
| 2026-01-26 | 13F | Cwm, Llc | 3.008 | 145,35 | 0 | |||||
| 2026-02-17 | 13F | Public Employees Retirement System Of Ohio | 38.204 | 1.466 | ||||||
| 2026-02-02 | 13F | Fifth Third Bancorp | 638 | 24 | ||||||
| 2026-02-17 | 13F | Two Sigma Investments, Lp | 903.123 | -3,33 | 34.644 | 10,30 | ||||
| 2025-11-14 | 13F | Occudo Quantitative Strategies Lp | 0 | -100,00 | 0 | |||||
| 2026-02-12 | 13F | Riverwater Partners LLC | 0 | -100,00 | 0 | |||||
| 2025-11-10 | 13F | Options Solutions, Llc | 0 | -100,00 | 0 | |||||
| 2026-04-20 | 13F | Yorktown Management & Research Co Inc | 5.900 | 0,00 | 263 | 16,37 | ||||
| 2026-02-17 | 13F | Dauntless Investment Group, LLC | 22.000 | 844 | ||||||
| 2026-02-13 | 13F | Y-Intercept (Hong Kong) Ltd | 44.349 | -27,72 | 1.701 | -17,51 | ||||
| 2026-02-11 | 13F | Jpmorgan Chase & Co | 223.489 | -70,00 | 8.573 | -65,77 | ||||
| 2025-11-14 | 13F | Driehaus Capital Management Llc | 0 | -100,00 | 0 | |||||
| 2026-02-17 | 13F | Artisan Partners Limited Partnership | 904.957 | 68,52 | 34.714 | 92,28 | ||||
| 2025-11-14 | 13F | EAM Global Investors LLC | 0 | -100,00 | 0 | |||||
| 2026-02-10 | 13F | CIBC World Markets Inc. | 15.331 | 45,58 | 588 | 66,10 | ||||
| 2026-02-13 | 13F | Quarry LP | 0 | -100,00 | 0 | |||||
| 2026-02-17 | 13F | Engineers Gate Manager LP | 22.586 | -77,31 | 866 | -74,12 | ||||
| 2025-11-12 | 13F | Napa Wealth Management | 0 | -100,00 | 0 | |||||
| 2026-02-13 | 13F | Dynamic Technology Lab Private Ltd | 8.530 | 24,38 | 327 | 41,56 | ||||
| 2026-02-17 | 13F | Lazard Asset Management Llc | 6.116 | 235 | ||||||
| 2026-02-12 | 13F | Principal Securities, Inc. | 0 | -100,00 | 0 | |||||
| 2026-02-10 | 13F | Seven Grand Managers, Llc | 250.000 | 0,00 | 9.590 | 14,10 | ||||
| 2026-02-17 | 13F | Caption Management, LLC | Call | 0 | -100,00 | 0 | ||||
| 2026-02-17 | 13F | D. E. Shaw & Co., Inc. | 12.068 | 463 | ||||||
| 2026-02-17 | 13F | Samlyn Capital, Llc | 1.141.911 | 43,06 | 43.804 | 63,22 | ||||
| 2025-11-14 | 13F | Longaeva Partners L.P. | 0 | -100,00 | 0 | |||||
| 2026-02-13 | 13F | Grandeur Peak Global Advisors, LLC | 1.779.743 | 1,48 | 68.271 | 15,78 | ||||
| 2025-11-14 | 13F | Ghisallo Capital Management LLC | 0 | -100,00 | 0 | -100,00 | ||||
| 2026-02-13 | 13F | Gen-Wealth Partners Inc | 0 | -100,00 | 0 | |||||
| 2026-02-13 | 13F | Umb Bank N A/mo | 18 | 0,00 | 1 | |||||
| 2026-02-11 | 13F | Deutsche Bank Ag\ | 496.560 | 1.105,30 | 19.048 | 1.275,31 | ||||
| 2026-02-17 | 13F | Advisor Group Holdings, Inc. | 1.059 | 9,85 | 41 | 25,00 | ||||
| 2025-11-13 | 13F | Magnetar Financial LLC | 0 | -100,00 | 0 | |||||
| 2025-10-30 | 13F | Rakuten Investment Management, Inc. | 0 | -100,00 | 0 | |||||
| 2026-02-10 | 13F | Envestnet Asset Management Inc | 38.559 | -44,34 | 1.479 | -36,47 | ||||
| 2026-01-15 | 13F | Allspring Global Investments Holdings, LLC | 814.733 | -0,07 | 30.911 | 23,69 | ||||
| 2026-02-14 | 13F | Militia Capital Partners, LP | 40.000 | 11,11 | 1.534 | 26,78 | ||||
| 2026-01-30 | 13F | Us Bancorp \de\ | 5.390 | 13,57 | 207 | 29,56 | ||||
| 2026-01-26 | 13F | Transcendent Capital Group LLC | 6.661 | 256 | ||||||
| 2026-01-29 | 13F | Sanctuary Advisors, LLC | 25.264 | 969 | ||||||
| 2026-02-13 | 13F | Healthcare Of Ontario Pension Plan Trust Fund | 1.114.349 | 3,74 | 42.746 | 18,36 | ||||
| 2026-02-13 | 13F | Smartleaf Asset Management LLC | 582 | 23 | ||||||
| 2026-04-22 | 13F | Janney Montgomery Scott LLC | 9.983 | 0 | ||||||
| 2026-02-06 | 13F | Larson Financial Group LLC | 1.108 | 1.251,22 | 43 | 2.000,00 | ||||
| 2026-02-11 | 13F | Winton Capital Group Ltd | 0 | -100,00 | 0 | |||||
| 2026-02-17 | 13F | Portolan Capital Management, LLC | 418.745 | 16.063 | ||||||
| 2026-02-17 | 13F | Numerai GP LLC | 0 | -100,00 | 0 | |||||
| 2025-11-12 | 13F | LPL Financial LLC | 0 | -100,00 | 0 | |||||
| 2025-11-14 | 13F | EAM Investors, LLC | 0 | -100,00 | 0 | |||||
| 2026-02-17 | 13F/A | Laurion Capital Management LP | 20.710 | 794 | ||||||
| 2026-02-13 | 13F | Charles Schwab Investment Management Inc | 147.491 | -7,74 | 5.658 | 5,27 | ||||
| 2026-02-12 | 13F | Hrt Financial Lp | 24.606 | 1 | ||||||
| 2026-02-17 | 13F | North Reef Capital Management LP | 190.000 | 264,05 | 7.288 | 315,51 | ||||
| 2025-11-14 | 13F | Aigen Investment Management, Lp | 0 | -100,00 | 0 | |||||
| 2025-11-14 | 13F | Wolverine Trading, Llc | Call | 63.900 | 2.178 | |||||
| 2026-02-09 | 13F/A | Swedbank AB | 213.413 | 8.187 | ||||||
| 2026-02-17 | 13F | State Of Wisconsin Investment Board | 159.527 | 7,89 | 6.119 | 23,12 | ||||
| 2026-02-06 | 13F | Global Retirement Partners, LLC | 34 | 1 | ||||||
| 2026-02-17 | 13F | Fred Alger Management, Llc | 12.766 | 2,95 | 490 | 17,55 | ||||
| 2026-02-10 | 13F | Bank of New York Mellon Corp | 435.772 | 34,40 | 16.716 | 53,34 | ||||
| 2026-02-13 | 13F | Wells Fargo & Company/mn | 63.901 | 66,37 | 2.451 | 89,85 | ||||
| 2026-02-17 | 13F | Russell Investments Group, Ltd. | 310.452 | 32,61 | 11.909 | 51,31 | ||||
| 2025-11-14 | 13F | Scientech Research LLC | 0 | -100,00 | 0 | -100,00 | ||||
| 2026-02-13 | 13F | Lord, Abbett & Co. Llc | 227.255 | 2,35 | 9 | 14,29 | ||||
| 2026-02-17 | 13F | Wellington Management Group Llp | 759.836 | 65,88 | 29.147 | 89,27 | ||||
| 2026-02-03 | 13F | Navellier & Associates Inc | 0 | -100,00 | 0 | -100,00 | ||||
| 2026-02-02 | 13F | Principal Financial Group Inc | 240.432 | -64,40 | 9.223 | -59,39 | ||||
| 2026-02-12 | 13F | BRYN MAWR TRUST Co | 284 | 11 | ||||||
| 2026-02-17 | 13F | Man Group plc | 0 | -100,00 | 0 | |||||
| 2026-02-17 | 13F | Algert Global Llc | 312.351 | 14,99 | 12 | 22,22 | ||||
| 2026-01-29 | 13F | Verdence Capital Advisors LLC | 6.363 | -18,85 | 244 | 1,24 | ||||
| 2026-01-27 | 13F | Proffitt & Goodson Inc | 0 | -100,00 | 0 | |||||
| 2026-01-23 | 13F | Sumitomo Mitsui Trust Holdings, Inc. | 0 | -100,00 | 0 | |||||
| 2026-02-17 | 13F | Millennium Management Llc | 82.779 | -75,33 | 3.175 | -71,86 | ||||
| 2026-02-17 | 13F | Engle Capital Management, L.P. | 190.900 | -42,17 | 7.323 | -34,02 | ||||
| 2026-02-05 | 13F | Allworth Financial LP | 55 | -37,50 | 2 | 0,00 | ||||
| 2026-02-12 | 13F | BlackRock, Inc. | 3.966.534 | 6,75 | 152.156 | 21,80 | ||||
| 2026-02-17 | 13F | Graham Capital Management, L.P. | 0 | -100,00 | 0 | |||||
| 2026-02-13 | 13F | Ubs Asset Management Americas Inc | 127 | 5 | ||||||
| 2026-02-12 | 13F | Nuveen, LLC | 381.008 | 4,17 | 14.615 | 18,86 | ||||
| 2026-02-13 | 13F | Mariner, LLC | 62.188 | 174,97 | 2.386 | 213,82 | ||||
| 2026-02-17 | 13F | Tower Research Capital LLC (TRC) | 3.239 | 112,12 | 124 | 143,14 | ||||
| 2026-02-17 | 13F | MIRAE ASSET GLOBAL ETFS HOLDINGS Ltd. | 25.614 | 2,40 | 983 | 16,90 | ||||
| 2026-04-06 | 13F | GAMMA Investing LLC | 341 | 105,42 | 15 | 150,00 | ||||
| 2026-02-13 | 13F | Boston Partners | 50.139 | 1.923 | ||||||
| 2026-02-06 | 13F | GPS Wealth Strategies Group, LLC | 0 | -100,00 | 0 | |||||
| 2026-04-07 | 13F | Farther Finance Advisors, LLC | 2.588 | 15,43 | 111 | 29,07 | ||||
| 2026-02-09 | 13F | Legal & General Group Plc | 99.901 | 58,07 | 3.832 | 80,50 | ||||
| 2026-02-17 | 13F | Credit Agricole S A | 0 | -100,00 | 0 | |||||
| 2026-02-17 | 13F | Praetorian PR LLC | 500.000 | 25,00 | 19.180 | 42,62 | ||||
| 2026-02-17 | 13F | Citadel Advisors Llc | Put | 19.800 | 28,57 | 760 | 46,81 | |||
| 2026-02-17 | 13F | Aquatic Capital Management LLC | 0 | -100,00 | 0 | |||||
| 2026-02-19 | 13F | Invesco Ltd. | 1.294.978 | 6,78 | 49.675 | 21,84 | ||||
| 2026-02-09 | 13F | Geode Capital Management, Llc | 709.724 | 1,28 | 27.225 | 15,56 | ||||
| 2026-02-10 | 13F | Rothschild Investment Llc | 19 | 1 | ||||||
| 2026-02-17 | 13F | Jain Global LLC | 9.881 | -87,49 | 379 | -85,73 | ||||
| 2026-02-11 | 13F | Capital International Investors | 3.488.093 | 0,00 | 133.803 | 14,10 | ||||
| 2026-02-09 | 13F | William Blair Investment Management, Llc | 1.738.927 | 371,96 | 66.705 | 438,51 | ||||
| 2026-02-10 | 13F | Bnp Paribas Arbitrage, Sa | 251.535 | -45,95 | 9.649 | -38,34 | ||||
| 2026-02-17 | 13F | Schonfeld Strategic Advisors LLC | 0 | -100,00 | 0 | |||||
| 2026-02-09 | 13F | Annis Gardner Whiting Capital Advisors, LLC | 0 | -100,00 | 0 | |||||
| 2026-02-17 | 13F | Advisory Services Network, LLC | 0 | -100,00 | 0 | |||||
| 2026-02-17 | 13F | Capstone Investment Advisors, Llc | 0 | -100,00 | 0 | -100,00 | ||||
| 2026-04-09 | 13F | Park Place Capital Corp | 321 | -15,08 | 14 | 0,00 | ||||
| 2026-02-12 | 13F | Marex Group plc | 103.500 | 69,20 | 3.970 | 93,09 | ||||
| 2026-02-17 | 13F | Ophir Asset Management Pty Ltd | 1.087.160 | 41.703 | ||||||
| 2026-04-20 | 13F | Moody Aldrich Partners Llc | 139.793 | -0,95 | 6.232 | 15,09 | ||||
| 2026-02-12 | 13F | New York State Common Retirement Fund | 163.281 | 86,27 | 6.263 | 112,52 | ||||
| 2026-02-17 | 13F | Alliancebernstein L.p. | 1.750.252 | 12,27 | 67.140 | 28,10 | ||||
| 2026-02-17 | 13F | Cantor Fitzgerald, L. P. | 0 | -100,00 | 0 | -100,00 | ||||
| 2026-02-13 | 13F | MAI Capital Management | 51 | 2 | ||||||
| 2026-02-13 | 13F | Citigroup Inc | 2.364 | -37,84 | 91 | -29,13 | ||||
| 2025-11-13 | 13F | Hoey Investments, Inc | 0 | -100,00 | 0 | |||||
| 2026-02-17 | 13F | Citadel Advisors Llc | 90.059 | -82,95 | 3.455 | -80,55 | ||||
| 2026-02-17 | 13F | Citadel Advisors Llc | Call | 8.900 | -18,35 | 341 | -6,83 | |||
| 2025-11-14 | 13F | Freestone Grove Partners LP | 0 | -100,00 | 0 | -100,00 | ||||
| 2025-11-12 | 13F | Group One Trading, L.p. | 0 | -100,00 | 0 | -100,00 | ||||
| 2026-02-13 | 13F | Police & Firemen's Retirement System of New Jersey | 14.281 | -2,30 | 548 | 11,41 | ||||
| 2026-02-17 | 13F | Raymond James Financial Inc | 71.907 | 13,43 | 2.758 | 29,42 | ||||
| 2026-02-11 | 13F | Renaissance Group Llc | 194.680 | -7,74 | 7.468 | 5,26 | ||||
| 2026-02-17 | 13F | Corsair Capital Management, L.p. | 13.060 | -12,54 | 501 | -0,40 | ||||
| 2025-11-14 | 13F | Petrus Trust Company, LTA | 0 | -100,00 | 0 | |||||
| 2026-04-24 | 13F | Keybank National Association/oh | 8.862 | 12,73 | 395 | 31,23 | ||||
| 2026-02-17 | 13F | Point72 Asset Management, L.P. | 0 | -100,00 | 0 | |||||
| 2026-02-17 | 13F | Susquehanna International Group, Llp | Call | 27.300 | -47,20 | 1.047 | -39,76 | |||
| 2026-02-04 | 13F | Ameritas Advisory Services, LLC | 0 | -100,00 | 0 | |||||
| 2026-02-17 | 13F | Two Sigma Advisers, Lp | 679.600 | -15,46 | 26.069 | -3,54 | ||||
| 2025-11-14 | 13F | Soros Fund Management Llc | 0 | -100,00 | 0 | |||||
| 2025-11-12 | 13F | Polen Capital Management Llc | 0 | -100,00 | 0 | |||||
| 2026-02-05 | 13F | Td Private Client Wealth Llc | 13 | 0 | ||||||
| 2026-02-17 | 13F | Epacria Capital Partners, Llc | 16.607 | 637 | ||||||
| 2026-02-18 | 13F | State of Tennessee, Treasury Department | 0 | -100,00 | 0 | |||||
| 2026-04-17 | 13F | Bell Investment Advisors, Inc | 21 | -82,05 | 1 | -100,00 | ||||
| 2026-02-17 | 13F | Jump Financial, LLC | 7.515 | -93,19 | 288 | -92,24 | ||||
| 2026-02-11 | 13F | Franklin Resources Inc | 60.419 | 32,94 | 2.318 | 51,64 | ||||
| 2025-12-09 | 13F/A | Tudor Investment Corp Et Al | 0 | -100,00 | 0 | |||||
| 2026-02-12 | 13F | Federation des caisses Desjardins du Quebec | 0 | -100,00 | 0 | |||||
| 2026-04-13 | 13F | IFP Advisors, Inc | 18 | 0,00 | 1 | |||||
| 2026-02-10 | 13F/A | Northwestern Mutual Wealth Management Co | 64 | -34,02 | 2 | -33,33 | ||||
| 2026-01-29 | 13F | Vanguard Group Inc | 399.956 | -14,62 | 15.342 | -2,58 | ||||
| 2026-02-17 | 13F | Balyasny Asset Management Llc | 1.396.390 | 16,21 | 53.566 | 32,60 | ||||
| 2025-11-14 | 13F | Cubist Systematic Strategies, LLC | 342.574 | 1,74 | 11.517 | -13,34 | ||||
| 2025-11-04 | 13F | Wcm Investment Management, Llc | 0 | -100,00 | 0 | -100,00 | ||||
| 2025-11-13 | 13F | Glenmede Investment Management, LP | 345.739 | 1.490,70 | 11.624 | 1.256,24 | ||||
| 2026-02-17 | 13F | California State Teachers Retirement System | 3.392 | -0,26 | 130 | 14,04 | ||||
| 2026-04-17 | 13F | Brown, Lisle/cummings, Inc. | 56 | 2 | ||||||
| 2026-01-29 | 13F | Teachers Retirement System Of The State Of Kentucky | 72.497 | 84,78 | 3 | 100,00 | ||||
| 2026-02-12 | 13F | Federated Hermes, Inc. | 74.574 | 68,07 | 2.861 | 91,82 | ||||
| 2026-02-17 | 13F | Dark Forest Capital Management Lp | 0 | -100,00 | 0 | |||||
| 2026-02-10 | 13F | Clear Harbor Asset Management, LLC | 9.577 | -0,52 | 367 | 13,62 | ||||
| 2026-02-13 | 13F | Kilter Group LLC | 0 | -100,00 | 0 | |||||
| 2026-02-17 | 13F | Granahan Investment Management Inc/ma | 1.376.993 | 30,53 | 52.821 | 48,93 | ||||
| 2026-02-17 | 13F | Burkehill Global Management, LP | 0 | -100,00 | 0 | |||||
| 2026-04-21 | 13F | Wasatch Advisors Inc | 171.109 | 452,11 | 7.628 | 542,09 | ||||
| 2026-02-10 | 13F | Goldman Sachs Group Inc | 244.620 | -42,41 | 9.384 | -34,29 | ||||
| 2026-02-17 | 13F | Price T Rowe Associates Inc /md/ | 1.548.637 | 27,86 | 59 | 47,50 | ||||
| 2026-02-10 | 13F | Daiwa Securities Group Inc. | 0 | -100,00 | 0 | |||||
| 2026-02-10 | 13F | Intech Investment Management Llc | 16.498 | 11,14 | 633 | 26,65 |
Other Listings
| US:MRX | 52,80 $ |