Grundlæggende statistik
| Institutionelle aktier (lange) | 17.550.767 - 49,06% (ex 13D/G) - change of -0,94MM shares -5,10% MRQ |
| Institutionel værdi (lang) | $ 513.506 USD ($1000) |
Institutionelt ejerskab og aktionærer
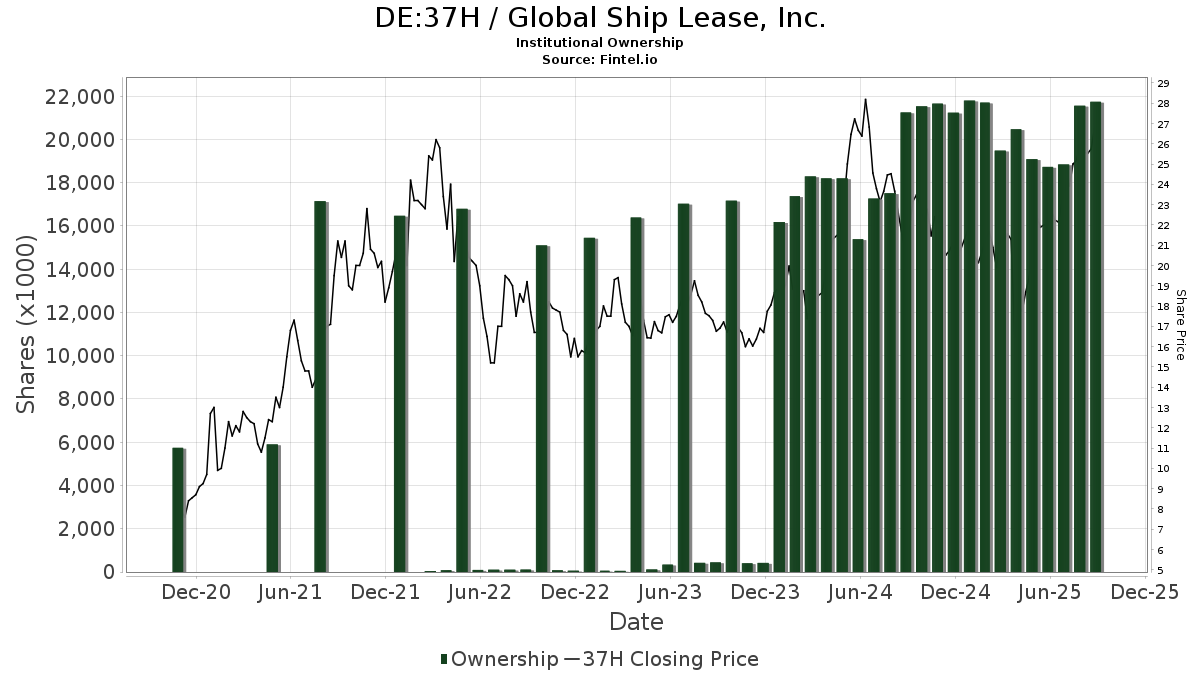
Global Ship Lease, Inc. (DE:37H) har 208 institutionelle ejere og aktionærer, der har indsendt 13D/G- eller 13F-formularer til Securities Exchange Commission (SEC). Disse institutioner har i alt 17,550,767 aktier. Største aktionærer omfatter Donald Smith & Co., Inc., Acadian Asset Management Llc, Punch & Associates Investment Management, Inc., Renaissance Technologies Llc, Two Sigma Investments, Lp, Two Sigma Advisers, Lp, MIRAE ASSET GLOBAL ETFS HOLDINGS Ltd., DIV - Global X SuperDividend U.S. ETF, Qube Research & Technologies Ltd, and CSM Advisors, LLC .
Global Ship Lease, Inc. (DB:37H) institutionel ejerskabsstruktur viser aktuelle positioner i virksomheden efter institutioner og fonde, samt seneste ændringer i positionsstørrelse. Større aktionærer kan omfatte individuelle investorer, investeringsforeninger, hedgefonde eller institutioner. Skema 13D angiver, at investoren besidder (eller besidder) mere end 5 % af virksomheden og har til hensigt (eller har til hensigt at) aktivt at forfølge en ændring i forretningsstrategi. Skema 13G indikerer en passiv investering på over 5%.
The share price as of March 6, 2026 is 33,08 / share. Previously, on March 10, 2025, the share price was 21,52 / share. This represents an increase of 53,72% over that period.
Fondens stemningsscore
Fund Sentiment Score (fka Ownership Accumulation Score) finder de aktier, der bliver mest købt af fonde. Det er resultatet af en sofistikeret, multi-faktor kvantitativ model, der identificerer virksomheder med de højeste niveauer af institutionel akkumulering. Scoringsmodellen bruger en kombination af den samlede stigning i oplyste ejere, ændringerne i porteføljeallokeringer i disse ejere og andre målinger. Tallet går fra 0 til 100, hvor højere tal indikerer et højere niveau af akkumulering for sine jævnaldrende, og 50 er gennemsnittet.
Opdateringsfrekvens: Dagligt
Se Ownership Explorer, som giver en liste over højest rangerende virksomheder.
AI+ Ask Fintel’s AI assistant about Global Ship Lease, Inc..
Select a question to share a public post with an AI-crafted answer.
Thinking of good questions…
13F og NPORT arkivering
Detaljer om 13F-arkivering er gratis. Detaljer om NP-ansøgninger kræver et premium-medlemskab. Grønne rækker angiver nye positioner. Røde rækker angiver lukkede positioner. Klik på linket ikon for at se den fulde transaktionshistorik.
Opgrader
for at låse premium-data op og eksportere til Excel ![]() .
.
| Fil dato | Kilde | Investor | Type | Gennemsnitlig pris (Øst) |
Aktier | Δ Aktier (%) |
Rapporteret Værdi ($1000) |
Δ Værdi (%) |
Port Alloc (%) |
|
|---|---|---|---|---|---|---|---|---|---|---|
| 2026-02-13 | 13F | Walleye Trading LLC | 0 | -100,00 | 0 | -100,00 | ||||
| 2025-09-26 | NP | ESCQX - Embark Small Cap Equity Fund Retirement Class | 412.131 | -23,43 | 11.754 | 1,47 | ||||
| 2026-01-26 | 13F | Provenance Wealth Advisors, LLC | 9.040 | 0,00 | 317 | 14,08 | ||||
| 2026-02-03 | 13F | SBI Securities Co., Ltd. | 8.941 | 310,33 | 313 | 374,24 | ||||
| 2026-02-17 | 13F | Creative Planning | 16.492 | 21,88 | 578 | 39,04 | ||||
| 2025-10-15 | 13F | Cwm, Llc | 0 | -100,00 | 0 | |||||
| 2026-02-11 | 13F | Group One Trading, L.p. | Call | 11.000 | 50,68 | 385 | 71,88 | |||
| 2026-02-11 | 13F | Group One Trading, L.p. | Put | 500 | -88,37 | 18 | -87,12 | |||
| 2026-02-17 | 13F | Susquehanna International Group, Llp | 0 | -100,00 | 0 | |||||
| 2026-02-11 | 13F | Group One Trading, L.p. | 238 | -94,29 | 8 | -93,75 | ||||
| 2026-02-12 | 13F | Barnett & Company, Inc. | 25.345 | 0,86 | 888 | 15,18 | ||||
| 2026-02-10 | 13F | Commonwealth Of Pennsylvania Public School Empls Retrmt Sys | 34.244 | 0,00 | 1.200 | 14,08 | ||||
| 2026-01-23 | 13F | Penn Mutual Asset Management, LLC | 0 | -100,00 | 0 | |||||
| 2026-02-14 | 13F | BluePath Capital Management, LLC | 35.877 | -35,20 | 1.257 | -26,02 | ||||
| 2026-01-09 | 13F | SG Americas Securities, LLC | 56.817 | 100,12 | 2 | |||||
| 2026-02-17 | 13F | D. E. Shaw & Co., Inc. | Put | 9.100 | 319 | |||||
| 2026-02-17 | 13F | Petrus Trust Company, LTA | 0 | -100,00 | 0 | |||||
| 2026-02-17 | 13F | D. E. Shaw & Co., Inc. | Call | 18.800 | 659 | |||||
| 2026-02-17 | 13F | Ameriprise Financial Inc | 101.190 | -0,89 | 3.547 | 13,18 | ||||
| 2026-02-17 | 13F | D. E. Shaw & Co., Inc. | 71.757 | 2.514 | ||||||
| 2026-02-06 | 13F | HighTower Advisors, LLC | 6.224 | 218 | ||||||
| 2026-02-10 | 13F/A | Northwestern Mutual Wealth Management Co | 833 | 29 | ||||||
| 2026-02-12 | 13F | BlackRock, Inc. | 217.709 | 2,48 | 7.629 | 16,98 | ||||
| 2026-02-17 | 13F | Jones Financial Companies Lllp | 20.994 | 16,73 | 736 | 28,27 | ||||
| 2026-02-11 | 13F | Winton Capital Group Ltd | 27.079 | 949 | ||||||
| 2026-02-17 | 13F | Numerai GP LLC | 25.421 | 891 | ||||||
| 2025-09-24 | NP | Innovator ETFs Trust - Innovator U.S. Small Cap Managed Floor ETF | 189 | 6,18 | 5 | 66,67 | ||||
| 2026-01-14 | 13F | Exchange Traded Concepts, Llc | 7.387 | -14,72 | 259 | -2,64 | ||||
| 2026-02-12 | 13F | Triumph Capital Management | 1.700 | 106,06 | 60 | 136,00 | ||||
| 2026-02-12 | 13F | Campbell & CO Investment Adviser LLC | 9.233 | 9,24 | 324 | 24,71 | ||||
| 2025-11-12 | 13F | CIBC Bancorp USA Inc. | 22.525 | 692 | ||||||
| 2026-02-17 | 13F | Grantham, Mayo, Van Otterloo & Co. LLC | 20.700 | 725 | ||||||
| 2026-02-13 | 13F | Y-Intercept (Hong Kong) Ltd | 66.213 | 456,41 | 2.320 | 535,62 | ||||
| 2026-02-18 | 13F | State of Tennessee, Treasury Department | 61.554 | -9,23 | 2.311 | 11,00 | ||||
| 2026-02-17 | 13F | Quadrature Capital Ltd | 0 | -100,00 | 0 | |||||
| 2025-11-20 | 13F | Wbi Investments, Inc. | 0 | -100,00 | 0 | -100,00 | ||||
| 2026-02-17 | 13F | Magnetar Financial LLC | 17.487 | 613 | ||||||
| 2026-02-05 | 13F | Plante Moran Financial Advisors, LLC | 375 | 13 | ||||||
| 2026-02-11 | 13F | Franklin Resources Inc | 15.742 | -0,54 | 552 | 13,61 | ||||
| 2026-01-30 | 13F | Archer Investment Corp | 11 | 0,00 | 0 | |||||
| 2026-02-03 | 13F | Strengthening Families & Communities, LLC | 1.563 | 55 | ||||||
| 2026-02-13 | 13F | Integrity Investment Advisors, LLC | 8.218 | 1,72 | 288 | 15,73 | ||||
| 2026-02-10 | 13F | Quantbot Technologies LP | 42.247 | -15,24 | 1.480 | -3,27 | ||||
| 2026-02-13 | 13F | SRS Capital Advisors, Inc. | 308 | 0,00 | 11 | 11,11 | ||||
| 2026-01-29 | 13F | IMC-Chicago, LLC | Call | 19.100 | 78,50 | 669 | 103,96 | |||
| 2025-11-14 | 13F | Corton Capital Inc. | 7.126 | -34,90 | 219 | -24,31 | ||||
| 2026-02-17 | 13F | Lonestar Capital Management LLC | 160.000 | -44,44 | 5.606 | -36,59 | ||||
| 2026-01-14 | 13F | Redhawk Wealth Advisors, Inc. | 48.372 | -9,80 | 1.695 | 2,92 | ||||
| 2026-02-17 | 13F | Lazard Asset Management Llc | 178.068 | -9,36 | 6.240 | 3,45 | ||||
| 2026-02-17 | 13F | Russell Investments Group, Ltd. | 1.673 | 73,91 | 59 | 100,00 | ||||
| 2026-02-17 | 13F | Schonfeld Strategic Advisors LLC | 0 | -100,00 | 0 | |||||
| 2026-01-29 | 13F | Nbc Securities, Inc. | Call | 0 | -100,00 | 0 | ||||
| 2026-02-17 | 13F | Public Employees Retirement System Of Ohio | 92.091 | -0,13 | 3.227 | 13,99 | ||||
| 2025-10-27 | 13F | Kiker Wealth Management, LLC | 0 | -100,00 | 0 | -100,00 | ||||
| 2026-02-03 | 13F | Ballentine Partners, LLC | 0 | -100,00 | 0 | |||||
| 2025-09-26 | NP | ETTOX - E*TRADE No Fee Total Market Index Fund | 19 | 0,00 | 1 | |||||
| 2026-02-17 | 13F | Aquatic Capital Management LLC | 4.063 | 142 | ||||||
| 2026-02-17 | 13F | Boothbay Fund Management, Llc | 10.927 | 383 | ||||||
| 2026-02-18 | 13F | GWM Advisors LLC | 20.973 | 4,85 | 735 | 19,54 | ||||
| 2026-02-13 | 13F | JustInvest LLC | 11.269 | -1,97 | 395 | 11,93 | ||||
| 2026-02-17 | 13F | TCG Advisory Services, LLC | 11.558 | 405 | ||||||
| 2026-02-09 | 13F | Royal Palms Capital LLC | 104.595 | 3.665 | ||||||
| 2026-02-13 | 13F | Mariner, LLC | 0 | -100,00 | 0 | |||||
| 2026-02-17 | 13F | Credit Agricole S A | 34.291 | 1.202 | ||||||
| 2026-01-27 | 13F | Evergreen Capital Management Llc | 7.885 | 14,51 | 276 | 30,81 | ||||
| 2026-02-10 | 13F | Acadian Asset Management Llc | 1.472.519 | 2,60 | 52 | 15,91 | ||||
| 2026-02-17 | 13F | Engineers Gate Manager LP | 18.817 | -2,21 | 659 | 11,69 | ||||
| 2026-02-17 | 13F | Parvin Asset Management, LLC | 17.870 | 626 | ||||||
| 2026-01-16 | 13F | Ronald Blue Trust, Inc. | 2.242 | 0,04 | 79 | 14,71 | ||||
| 2025-09-29 | NP | PRFZ - Invesco FTSE RAFI US 1500 Small-Mid ETF This fund is a listed as child fund of Invesco Ltd. and if that institution has disclosed ownership in this security, then these positions will not be double counted when calculating total shares and total value | 65.201 | -11,14 | 1.860 | 17,73 | ||||
| 2026-02-13 | 13F | Sei Investments Co | 132.271 | 56,14 | 4.635 | 78,23 | ||||
| 2026-02-13 | 13F | Morgan Stanley | 422.760 | 9,71 | 14.814 | 25,23 | ||||
| 2025-11-13 | 13F | Marshall Wace, Llp | 173.101 | -39,75 | 5.314 | -29,69 | ||||
| 2026-02-27 | 13F | Strategic Investment Solutions, Inc. /IL | 100 | 0,00 | 4 | 0,00 | ||||
| 2026-02-06 | 13F | Pnc Financial Services Group, Inc. | 256 | 9 | ||||||
| 2026-02-13 | 13F | Citigroup Inc | 3.982 | -9,02 | 140 | 3,73 | ||||
| 2026-02-13 | 13F | Smartleaf Asset Management LLC | 341 | 12 | ||||||
| 2026-02-12 | 13F | Pinnacle Holdings, LLC | 2.512 | -1,84 | 88 | 12,82 | ||||
| 2026-02-09 | 13F | Harbour Investments, Inc. | 73 | 69,77 | 3 | 100,00 | ||||
| 2026-02-17 | 13F | Tower Research Capital LLC (TRC) | 0 | -100,00 | 0 | |||||
| 2026-02-12 | 13F | Hrt Financial Lp | 30.773 | -25,42 | 1 | 0,00 | ||||
| 2026-01-30 | 13F | Us Bancorp \de\ | 2.637 | 0,00 | 92 | 15,00 | ||||
| 2026-02-17 | 13F | Raymond James Financial Inc | 27.364 | 140,22 | 959 | 174,50 | ||||
| 2026-02-13 | 13F | Parkside Financial Bank & Trust | 431 | 1.336,67 | 15 | |||||
| 2026-02-06 | 13F | Larson Financial Group LLC | 226 | 8 | ||||||
| 2026-02-11 | 13F | Vermillion Wealth Management, Inc. | 380 | 0,00 | 13 | 18,18 | ||||
| 2026-02-17 | 13F | Mercer Global Advisors Inc /adv | 10.238 | 0,00 | 359 | 14,01 | ||||
| 2025-09-23 | NP | NTKLX - Voya Multi-Manager International Small Cap Fund Class A | 6.026 | 0,00 | 172 | 32,56 | ||||
| 2026-02-17 | 13F | Advisory Services Network, LLC | 6.241 | 0,52 | 219 | 14,74 | ||||
| 2026-02-20 | 13F | Sunbelt Securities, Inc. | 79 | 0,00 | 3 | 0,00 | ||||
| 2025-10-22 | 13F | Crews Bank & Trust | 0 | -100,00 | 0 | -100,00 | ||||
| 2026-01-23 | 13F | Farther Finance Advisors, LLC | 2.760 | 3,25 | 97 | 17,07 | ||||
| 2026-02-17 | 13F | XTX Topco Ltd | 0 | -100,00 | 0 | |||||
| 2025-10-23 | 13F | Spire Wealth Management | 0 | -100,00 | 0 | -100,00 | ||||
| 2026-02-24 | 13F | DGS Capital Management, LLC | 46.459 | 19,13 | 1.628 | 35,92 | ||||
| 2026-02-10 | 13F | Goldman Sachs Group Inc | 170.769 | 407,40 | 5.984 | 479,19 | ||||
| 2026-02-11 | 13F | LPL Financial LLC | 244.741 | -3,30 | 8.576 | 10,37 | ||||
| 2026-02-12 | 13F | Commonwealth Equity Services, Llc | 30.317 | -37,64 | 1.062 | 106.100,00 | ||||
| 2026-03-04 | 13F | SHP Wealth Management | 1.000 | 35 | ||||||
| 2025-11-12 | 13F | Huntington National Bank | 0 | -100,00 | 0 | |||||
| 2026-02-13 | 13F | Charles Schwab Investment Management Inc | 236.994 | 25,30 | 8.304 | 43,02 | ||||
| 2026-02-10 | 13F | Crescent Grove Advisors, LLC | 149.471 | 12,49 | 5.237 | 28,39 | ||||
| 2026-02-12 | 13F | Counterpoint Mutual Funds LLC | 14.402 | 21,04 | 505 | 38,08 | ||||
| 2026-02-17 | 13F | Qube Research & Technologies Ltd | 604.604 | 6,55 | 21.185 | 21,61 | ||||
| 2026-02-13 | 13F | State Street Corp | 331.619 | 4,80 | 11.620 | 19,61 | ||||
| 2026-02-17 | 13F | Fairscale Capital, LLC | 5.749 | 54,54 | 201 | 76,32 | ||||
| 2026-02-04 | 13F | Ameritas Advisory Services, LLC | 0 | -100,00 | 0 | |||||
| 2026-02-06 | 13F | Vestmark Advisory Solutions, Inc. | 7.169 | 251 | ||||||
| 2026-01-29 | 13F | UBS Group AG | 49.544 | -3,55 | 1.736 | 10,15 | ||||
| 2026-01-23 | 13F | LOM Asset Management Ltd | 1.400 | 49 | ||||||
| 2025-11-14 | 13F | Whitefort Capital Management, LP | 0 | -100,00 | 0 | -100,00 | ||||
| 2026-02-11 | 13F | Hilton Head Capital Partners, LLC | 1.000 | 35 | ||||||
| 2025-11-14 | 13F | Wolverine Trading, Llc | 21.089 | 652 | ||||||
| 2026-02-19 | 13F | CI Private Wealth, LLC | 16.606 | 11,49 | 525 | 14,66 | ||||
| 2025-11-14 | 13F | Wolverine Trading, Llc | Call | 21.700 | 671 | |||||
| 2025-11-14 | 13F | Wolverine Trading, Llc | Put | 24.600 | 761 | |||||
| 2026-02-13 | 13F | Walleye Trading LLC | Put | 900 | 50,00 | 32 | 72,22 | |||
| 2026-02-13 | 13F | Walleye Trading LLC | Call | 12.000 | 1.400,00 | 420 | 1.650,00 | |||
| 2026-02-12 | 13F | Principal Securities, Inc. | 0 | -100,00 | 0 | |||||
| 2026-01-30 | 13F | State of New Jersey Common Pension Fund D | 14.844 | 0,00 | 520 | 14,29 | ||||
| 2026-02-10 | 13F | Tidemark, LLC | 584 | 0,00 | 20 | 17,65 | ||||
| 2026-02-17 | 13F | Royal Bank Of Canada | 26.633 | 2,76 | 933 | 17,36 | ||||
| 2026-02-13 | 13F | Resources Investment Advisors, LLC. | 0 | -100,00 | 0 | |||||
| 2026-01-21 | 13F | Capital Advisory Group Advisory Services, LLC | 51.902 | 2,00 | 1.819 | 16,39 | ||||
| 2026-02-05 | 13F | Leuthold Group, Llc | 7.473 | 0,08 | 262 | 13,97 | ||||
| 2026-02-17 | 13F | Advisor Group Holdings, Inc. | 52.183 | -10,71 | 1.829 | 1,67 | ||||
| 2026-01-20 | 13F | AdvisorNet Financial, Inc | 385 | 13 | ||||||
| 2026-01-22 | 13F | Apollon Wealth Management, LLC | 0 | -100,00 | 0 | |||||
| 2026-02-02 | 13F | New England Capital Financial Advisors LLC | 528 | 1,73 | 18 | 20,00 | ||||
| 2026-01-27 | 13F | WealthCollab, LLC | 1.240 | 0,00 | 43 | 13,16 | ||||
| 2026-01-20 | 13F | Harbor Capital Advisors, Inc. | 122.702 | -15,53 | 4 | 0,00 | ||||
| 2026-02-05 | 13F | Td Private Client Wealth Llc | 609 | -6,31 | 21 | 10,53 | ||||
| 2026-02-14 | 13F | Rockefeller Capital Management L.P. | 2.810 | -46,27 | 98 | -38,75 | ||||
| 2026-02-13 | 13F | Transamerica Financial Advisors, Inc. | 13 | 0 | ||||||
| 2026-02-11 | 13F | Janney Montgomery Scott LLC | 95.407 | 14,50 | 3 | 50,00 | ||||
| 2026-02-19 | 13F | Invesco Ltd. | 52.687 | -10,80 | 1.846 | 1,82 | ||||
| 2026-02-17 | 13F | Jump Financial, LLC | 108.371 | 188,99 | 3.797 | 229,89 | ||||
| 2026-01-28 | 13F | Quaker Wealth Management, LLC | 250 | 0,00 | 9 | 14,29 | ||||
| 2025-11-17 | 13F | PharVision Advisers, LLC | 0 | -100,00 | 0 | -100,00 | ||||
| 2026-02-13 | 13F | Virtus ETF Advisers LLC | 5.437 | 46,95 | 191 | 68,14 | ||||
| 2026-02-13 | 13F | Aigen Investment Management, Lp | 6.425 | 225 | ||||||
| 2026-02-17 | 13F | Tudor Investment Corp Et Al | Call | 6.100 | 214 | |||||
| 2026-02-17 | 13F | Tudor Investment Corp Et Al | 212.680 | -2,41 | 7.452 | 11,39 | ||||
| 2026-02-12 | 13F | Renaissance Technologies Llc | 693.350 | -17,32 | 24.295 | -5,63 | ||||
| 2026-02-12 | 13F | EntryPoint Capital, LLC | 6.607 | 0,00 | 232 | 14,36 | ||||
| 2026-01-30 | 13F | Sigma Planning Corp | 18.892 | -1,35 | 662 | 12,61 | ||||
| 2026-02-17 | 13F | Bank Of America Corp /de/ | 27.265 | 11,00 | 955 | 26,66 | ||||
| 2026-02-02 | 13F | Oppenheimer & Co Inc | 10.024 | 351 | ||||||
| 2026-02-05 | 13F | Isthmus Partners, Llc | 116.609 | -0,13 | 4.086 | 136.066,67 | ||||
| 2026-01-23 | 13F | Assetmark, Inc | 1.804 | 8,61 | 63 | 26,00 | ||||
| 2026-02-12 | 13F | Marex Group plc | 105.139 | 505,57 | 3.684 | 591,18 | ||||
| 2026-01-28 | 13F | CAPROCK Group, Inc. | 7.226 | -0,15 | 253 | 14,48 | ||||
| 2026-02-18 | 13F | Vident Advisory, LLC | 32.016 | -10,49 | 1.122 | 2,09 | ||||
| 2026-02-13 | 13F | Verition Fund Management LLC | 48.854 | -31,95 | 1.712 | -22,37 | ||||
| 2026-01-12 | 13F | CVA Family Office, LLC | 103 | 0,00 | 4 | 0,00 | ||||
| 2026-02-13 | 13F | Squarepoint Ops LLC | 9.702 | -29,57 | 340 | -19,67 | ||||
| 2026-02-13 | 13F | Wells Fargo & Company/mn | 12.522 | 12,30 | 439 | 28,07 | ||||
| 2026-01-20 | 13F | Signaturefd, Llc | 1.718 | 4,69 | 60 | 20,00 | ||||
| 2025-10-28 | 13F | BRYN MAWR TRUST Co | 596 | 0,00 | 18 | 20,00 | ||||
| 2026-02-17 | 13F | Two Sigma Advisers, Lp | 631.200 | -11,52 | 22.117 | 0,99 | ||||
| 2026-02-10 | 13F | Envestnet Asset Management Inc | 9.992 | -18,00 | 350 | -6,42 | ||||
| 2026-01-05 | 13F | Commons Capital, Llc | 86.000 | 0,00 | 3.013 | 14,13 | ||||
| 2026-01-29 | 13F | IMC-Chicago, LLC | Put | 0 | -100,00 | 0 | -100,00 | |||
| 2026-02-13 | 13F | Quarry LP | 138 | -45,02 | 5 | -42,86 | ||||
| 2026-01-27 | 13F | TD Waterhouse Canada Inc. | 2.000 | -38,46 | 70 | -29,29 | ||||
| 2026-02-13 | 13F | Caitong International Asset Management Co., Ltd | 383 | 61,60 | 13 | 85,71 | ||||
| 2026-02-11 | 13F | CSM Advisors, LLC | 446.060 | 3,04 | 16 | 15,38 | ||||
| 2026-02-13 | 13F | Visionary Wealth Advisors | 13.432 | 471 | ||||||
| 2026-01-15 | 13F | Highline Wealth Partners Llc | 6.800 | -28,80 | 238 | -18,77 | ||||
| 2026-02-17 | 13F | Millennium Management Llc | 315.841 | 42,59 | 11.067 | 62,75 | ||||
| 2026-02-06 | 13F | Global Retirement Partners, LLC | 1.153 | 0,00 | 40 | 14,29 | ||||
| 2026-02-11 | 13F | Fox Run Management, L.l.c. | 8.206 | 288 | ||||||
| 2026-02-17 | 13F | Trexquant Investment LP | 114.593 | 125,95 | 4.015 | 157,87 | ||||
| 2025-11-12 | 13F | Barclays Plc | 0 | -100,00 | 0 | -100,00 | ||||
| 2026-02-10 | 13F | State of Wyoming | 18.856 | -25,69 | 661 | -15,17 | ||||
| 2026-02-10 | 13F | Bnp Paribas Arbitrage, Sa | 1 | 0,00 | 0 | |||||
| 2026-02-17 | 13F | Punch & Associates Investment Management, Inc. | 971.790 | -11,45 | 34.052 | 1,07 | ||||
| 2026-02-18 | 13F | Garton & Associates Financial Advisors LLC | 5.993 | 210 | ||||||
| 2026-01-29 | 13F | Sanctuary Advisors, LLC | 0 | -100,00 | 0 | -100,00 | ||||
| 2026-02-10 | 13F | Moors & Cabot, Inc. | 82.250 | -1,67 | 2.882 | 12,23 | ||||
| 2026-02-11 | 13F | Jpmorgan Chase & Co | 90.712 | -46,11 | 3.179 | -38,49 | ||||
| 2026-01-15 | 13F | Founders Capital Management | 1.000 | 0,00 | 35 | 16,67 | ||||
| 2026-02-17 | 13F | Point72 Asset Management, L.P. | 218.076 | 1.374,38 | 7.641 | 1.583,04 | ||||
| 2026-01-30 | 13F | ARGA Investment Management, LP | 53.602 | 0,00 | 1.878 | 14,16 | ||||
| 2026-01-28 | 13F | Kingswood Wealth Advisors, Llc | 7.774 | 272 | ||||||
| 2026-02-12 | 13F | Wealthspire Advisors, LLC | 0 | -100,00 | 0 | |||||
| 2026-01-21 | 13F | Flagship Harbor Advisors, Llc | 77 | 3 | ||||||
| 2026-02-17 | 13F | MIRAE ASSET GLOBAL ETFS HOLDINGS Ltd. | 616.262 | 1,46 | 21.594 | 15,80 | ||||
| 2026-02-13 | 13F | Toroso Investments, LLC | 14.365 | -18,08 | 503 | -6,51 | ||||
| 2026-01-23 | 13F | Avion Wealth | 700 | -46,15 | 0 | |||||
| 2026-01-13 | 13F | Kathmere Capital Management, LLC | 7.892 | 15,28 | 277 | 31,43 | ||||
| 2026-02-06 | 13F | Gsa Capital Partners Llp | 50.016 | 39,70 | 2 | 0,00 | ||||
| 2026-02-13 | 13F | MAI Capital Management | 1.545 | 0,00 | 54 | 14,89 | ||||
| 2026-02-17 | 13F | Verdad Advisers, LP | 24.533 | 860 | ||||||
| 2025-11-13 | 13F | Total Investment Management Inc | 0 | -100,00 | 0 | |||||
| 2026-01-28 | 13F | U S Global Investors Inc | 5.834 | -1,22 | 204 | 12,71 | ||||
| 2025-11-14 | 13F | Cubist Systematic Strategies, LLC | 153.465 | 4.711 | ||||||
| 2026-02-12 | 13F | Jane Street Group, Llc | 16.566 | -47,68 | 580 | -40,33 | ||||
| 2026-02-12 | 13F | Jane Street Group, Llc | Put | 12.100 | 424 | |||||
| 2026-02-13 | 13F | Walleye Capital LLC | Put | 2.100 | -74,07 | 74 | -70,56 | |||
| 2026-02-11 | 13F | Deutsche Bank Ag\ | 77.350 | 2.710 | ||||||
| 2026-02-12 | 13F | Jane Street Group, Llc | Call | 49.800 | 33,16 | 1.745 | 51,92 | |||
| 2026-02-13 | 13F | Walleye Capital LLC | 4.063 | 1.983,59 | 142 | 2.740,00 | ||||
| 2026-01-29 | 13F | Nbc Securities, Inc. | 456 | 2,70 | 18 | 30,77 | ||||
| 2026-02-13 | 13F | Walleye Capital LLC | Call | 8.600 | 115,00 | 301 | 146,72 | |||
| 2025-11-14 | 13F | Point72 Europe (London) LLP | 361 | 11 | ||||||
| 2026-02-10 | 13F | Root Financial Partners, LLC | 300 | 0,00 | 11 | 11,11 | ||||
| 2026-02-09 | 13F | Prospera Financial Services Inc | 11.125 | 0,47 | 390 | 14,75 | ||||
| 2026-02-09 | 13F | Jefferies Financial Group Inc. | 13.787 | 0,00 | 483 | 14,18 | ||||
| 2026-02-12 | 13F | Steward Partners Investment Advisory, Llc | 2.124 | 0,00 | 74 | 13,85 | ||||
| 2026-02-13 | 13F | Rhumbline Advisers | 70 | -57,83 | 2 | -60,00 | ||||
| 2026-01-23 | 13F | Valley National Advisers Inc | 103 | 0,00 | 0 | |||||
| 2026-01-29 | 13F | UMA Financial Services, Inc. | 27 | 0,00 | 1 | |||||
| 2026-02-17 | 13F | Two Sigma Investments, Lp | 686.135 | 9,47 | 24.042 | 24,95 | ||||
| 2026-02-17 | 13F | Citadel Advisors Llc | Put | 111.800 | 128,63 | 3.917 | 160,96 | |||
| 2026-02-17 | 13F | Voloridge Investment Management, Llc | 207.092 | 17,99 | 7.257 | 34,67 | ||||
| 2026-02-10 | 13F | JTC Employer Solutions Trusteee Ltd | 363.258 | 0,00 | 13 | 9,09 | ||||
| 2026-02-11 | 13F | O'shaughnessy Asset Management, Llc | 74.335 | -14,03 | 2.605 | -1,88 | ||||
| 2026-02-17 | 13F | Susquehanna International Group, Llp | Call | 124.200 | 45,77 | 4.352 | 66,39 | |||
| 2026-02-03 | 13F | Wulff, Hansen & Co. | 6.805 | 238 | ||||||
| 2026-02-11 | 13F | Strategic Advocates LLC | 650 | 0,00 | 23 | 15,79 | ||||
| 2026-02-17 | 13F | Citadel Advisors Llc | Call | 90.100 | -39,24 | 3.157 | -30,65 | |||
| 2026-02-13 | 13F | Marnell Management LLC | 6.515 | 228 | ||||||
| 2026-02-17 | 13F | Citadel Advisors Llc | 86.746 | -55,94 | 3.040 | -49,72 | ||||
| 2026-02-17 | 13F | Balyasny Asset Management Llc | 28.506 | 82,88 | 999 | 108,79 | ||||
| 2026-02-17 | 13F | Susquehanna International Group, Llp | Put | 40.200 | -59,68 | 1.409 | -53,99 | |||
| 2026-02-06 | 13F | GPS Wealth Strategies Group, LLC | 0 | -100,00 | 0 | |||||
| 2026-02-05 | 13F | Allworth Financial LP | 2.470 | -0,20 | 87 | 14,67 | ||||
| 2026-02-12 | 13F | New York State Common Retirement Fund | 50.122 | 0,00 | 1.756 | 14,17 | ||||
| 2026-02-12 | 13F | CIBC Private Wealth Group, LLC | 1 | 0 | ||||||
| 2026-02-05 | 13F | Intrua Financial, LLC | 8.300 | 0,00 | 291 | 14,17 | ||||
| 2026-02-11 | 13F | Simplex Trading, Llc | 8.005 | -47,46 | 280 | |||||
| 2026-02-11 | 13F | Simplex Trading, Llc | Call | 7.900 | -21,00 | 277 | ||||
| 2025-09-29 | NP | DIV - Global X SuperDividend U.S. ETF This fund is a listed as child fund of Mirae Asset Global Investments Co., Ltd. and if that institution has disclosed ownership in this security, then these positions will not be double counted when calculating total shares and total value | 611.026 | 3,28 | 17.426 | 36,88 | ||||
| 2026-02-11 | 13F | Simplex Trading, Llc | Put | 29.800 | -9,70 | 1.044 | 104.300,00 | |||
| 2026-01-23 | 13F | State of Alaska, Department of Revenue | 1.987 | 0,00 | 0 | |||||
| 2026-02-06 | 13F | EverSource Wealth Advisors, LLC | 1.057 | 6,88 | 37 | 23,33 | ||||
| 2025-11-10 | 13F | Novem Group | 0 | -100,00 | 0 | -100,00 | ||||
| 2026-02-12 | 13F | Brown Brothers Harriman & Co | 0 | -100,00 | 0 | |||||
| 2026-02-13 | 13F | Kestra Advisory Services, LLC | 0 | -100,00 | 0 | |||||
| 2026-02-05 | 13F | Cambridge Investment Research Advisors, Inc. | 8.073 | -5,06 | 0 | |||||
| 2026-02-12 | 13F | Quadrant Capital Group Llc | 13.223 | 21,26 | 463 | 38,62 | ||||
| 2026-02-17 | 13F | Man Group plc | 90.020 | 7,71 | 3.154 | 22,96 | ||||
| 2026-01-30 | 13F | Samalin Investment Counsel, LLC | 23.127 | 1,27 | 810 | 15,55 | ||||
| 2026-02-11 | 13F | Donald Smith & Co., Inc. | 2.088.499 | 73.181 | ||||||
| 2026-02-11 | 13F | Metis Global Partners, LLC | 21.377 | 0,00 | 749 | 14,18 | ||||
| 2025-11-14 | 13F/A | Skopos Labs, Inc. | 0 | -100,00 | 0 | -100,00 | ||||
| 2026-02-11 | 13F | Allianz Asset Management GmbH | 339.777 | 3,69 | 11.906 | 18,34 | ||||
| 2025-11-13 | 13F | Hsbc Holdings Plc | 0 | -100,00 | 0 | |||||
| 2025-09-24 | NP | SFSNX - Schwab Fundamental US Small Company Index Fund Institutional Shares | 23.052 | 88,60 | 657 | 149,81 | ||||
| 2026-01-20 | 13F | Ethos Financial Group, LLC | 14.807 | 0,00 | 519 | 14,10 | ||||
| 2026-02-17 | 13F/A | RBF Capital, LLC | 437.463 | 0,00 | 15.329 | 14,13 | ||||
| 2025-11-21 | 13F | Nebula Research & Development LLC | 0 | -100,00 | 0 | -100,00 | ||||
| 2025-09-18 | NP | JSML - Janus Henderson Small Cap Growth Alpha ETF | 0 | -100,00 | 0 | -100,00 | ||||
| 2026-01-26 | 13F | Lansing Street Advisors | 6.669 | 1,72 | 234 | 15,92 | ||||
| 2026-02-11 | 13F | Parallel Advisors, LLC | 9.850 | 0,23 | 345 | 14,62 | ||||
| 2026-02-17 | 13F | Quantedge Capital Pte Ltd | 0 | -100,00 | 0 | |||||
| 2026-02-04 | 13F | D'Orazio & Associates, Inc. | 6.951 | -0,17 | 244 | 14,08 | ||||
| 2025-09-26 | NP | OWSMX - Old Westbury Small & Mid Cap Strategies Fund | 50.792 | 1.449 | ||||||
| 2026-02-13 | 13F | Peak6 Llc | Call | 76.900 | 45,09 | 2.695 | 65,58 | |||
| 2026-02-13 | 13F | Peak6 Llc | Put | 1.100 | 39 | |||||
| 2025-10-16 | 13F | Kingstone Capital Partners Texas, LLC | 0 | -100,00 | 0 | -100,00 | ||||
| 2025-11-14 | 13F | ExodusPoint Capital Management, LP | 20.137 | 618 | ||||||
| 2026-01-29 | 13F | Kestra Private Wealth Services, Llc | 28.903 | 0,82 | 1.013 | 15,00 | ||||
| 2026-02-17 | 13F | Cantor Fitzgerald, L. P. | 0 | -100,00 | 0 |
Other Listings
| US:GSL | 38,81 $ |