Grundlæggende statistik
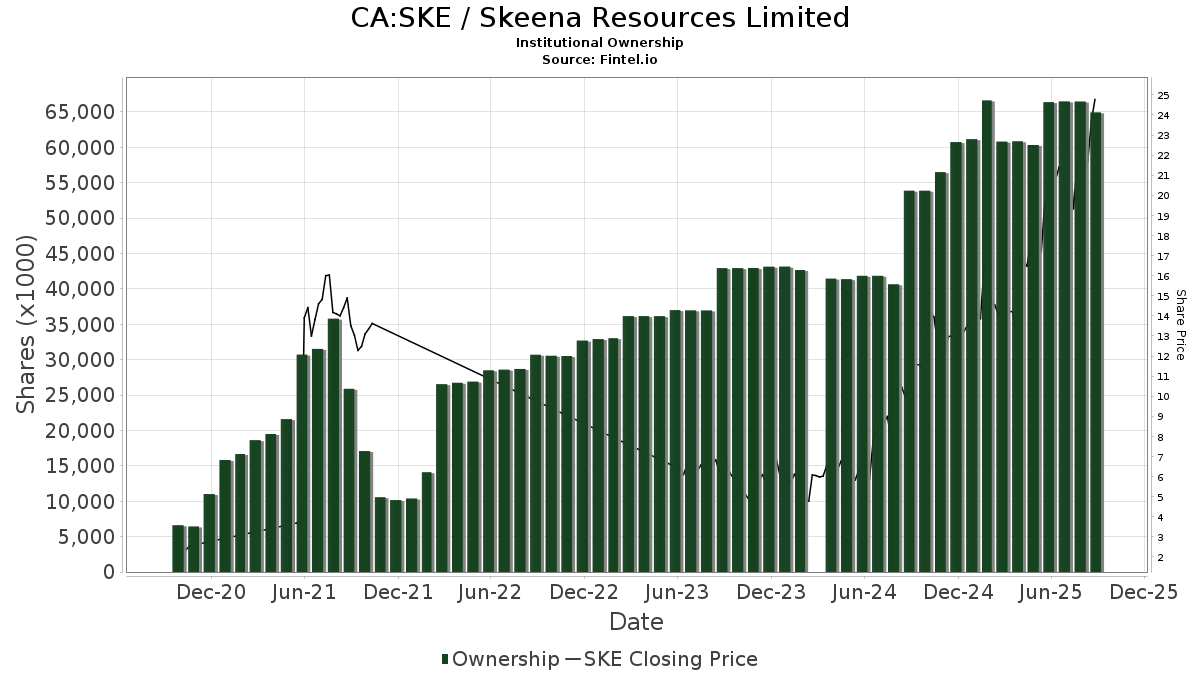
| Institutionelle aktier (lange) | 60.263.717 - 49,77% (ex 13D/G) - change of -4,45MM shares -6,45% MRQ |
| Institutionel værdi (lang) | $ 1.280.832 USD ($1000) |
Institutionelt ejerskab og aktionærer
Skeena Resources Limited (CA:SKE) har 152 institutionelle ejere og aktionærer, der har indsendt 13D/G- eller 13F-formularer til Securities Exchange Commission (SEC). Disse institutioner har i alt 60,263,717 aktier. Største aktionærer omfatter Helikon Investments Ltd, Van Eck Associates Corp, Orion Resource Partners LP, Vanguard Group Inc, Amundi, Franklin Resources Inc, Millennium Management Llc, Waratah Capital Advisors Ltd., Td Asset Management Inc, and FKRCX - Franklin Gold & Precious Metals Fund Class A .
Skeena Resources Limited (TSX:SKE) institutionel ejerskabsstruktur viser aktuelle positioner i virksomheden efter institutioner og fonde, samt seneste ændringer i positionsstørrelse. Større aktionærer kan omfatte individuelle investorer, investeringsforeninger, hedgefonde eller institutioner. Skema 13D angiver, at investoren besidder (eller besidder) mere end 5 % af virksomheden og har til hensigt (eller har til hensigt at) aktivt at forfølge en ændring i forretningsstrategi. Skema 13G indikerer en passiv investering på over 5%.
The share price as of February 25, 2026 is 49,78 / share. Previously, on February 27, 2025, the share price was 13,98 / share. This represents an increase of 256,08% over that period.
Fondens stemningsscore
Fund Sentiment Score (fka Ownership Accumulation Score) finder de aktier, der bliver mest købt af fonde. Det er resultatet af en sofistikeret, multi-faktor kvantitativ model, der identificerer virksomheder med de højeste niveauer af institutionel akkumulering. Scoringsmodellen bruger en kombination af den samlede stigning i oplyste ejere, ændringerne i porteføljeallokeringer i disse ejere og andre målinger. Tallet går fra 0 til 100, hvor højere tal indikerer et højere niveau af akkumulering for sine jævnaldrende, og 50 er gennemsnittet.
Opdateringsfrekvens: Dagligt
Se Ownership Explorer, som giver en liste over højest rangerende virksomheder.
AI+ Ask Fintel’s AI assistant about Skeena Resources Limited.
Select a question to share a public post with an AI-crafted answer.
Thinking of good questions…
13F og NPORT arkivering
Detaljer om 13F-arkivering er gratis. Detaljer om NP-ansøgninger kræver et premium-medlemskab. Grønne rækker angiver nye positioner. Røde rækker angiver lukkede positioner. Klik på linket ikon for at se den fulde transaktionshistorik.
Opgrader
for at låse premium-data op og eksportere til Excel ![]() .
.
| Fil dato | Kilde | Investor | Type | Gennemsnitlig pris (Øst) |
Aktier | Δ Aktier (%) |
Rapporteret Værdi ($1000) |
Δ Værdi (%) |
Port Alloc (%) |
|
|---|---|---|---|---|---|---|---|---|---|---|
| 2026-02-14 | 13F | Rockefeller Capital Management L.P. | 1.555 | 41,36 | 37 | 80,00 | ||||
| 2025-11-14 | 13F | XTX Topco Ltd | 0 | -100,00 | 0 | |||||
| 2026-01-30 | 13F | Kohmann Bosshard Financial Services, LLC | 5.000 | 119 | ||||||
| 2026-02-13 | 13F | Caitong International Asset Management Co., Ltd | 1.832 | 43 | ||||||
| 2026-02-11 | 13F | Franklin Resources Inc | 2.396.970 | 7,58 | 56.933 | 38,78 | ||||
| 2026-02-12 | 13F | Marex Group plc | 20.000 | -73,81 | 475 | -66,34 | ||||
| 2025-09-25 | NP | RPGAX - T. Rowe Price Global Allocation Fund, Inc. This fund is a listed as child fund of Price T Rowe Associates Inc /md/ and if that institution has disclosed ownership in this security, then these positions will not be double counted when calculating total shares and total value | 8.348 | -7,85 | 117 | 8,33 | ||||
| 2026-01-23 | 13F | Aspect Partners, LLC | 0 | -100,00 | 0 | |||||
| 2026-01-15 | 13F | Allspring Global Investments Holdings, LLC | 977.000 | 29,06 | 23.206 | 66,49 | ||||
| 2026-02-12 | 13F | Nuveen, LLC | 55.628 | 0,00 | 1.323 | 29,10 | ||||
| 2026-02-17 | 13F | DV Trading LLC | 9.000 | 214 | ||||||
| 2026-02-17 | 13F | Jones Financial Companies Lllp | 600 | 0,00 | 14 | 27,27 | ||||
| 2026-02-11 | 13F | Erste Asset Management GmbH | 26.800 | 637 | ||||||
| 2026-02-12 | 13F | Skopos Labs, Inc. | 16.694 | 397 | ||||||
| 2026-02-17 | 13F | Point72 Asset Management, L.P. | 20.491 | 61,50 | 486 | 108,58 | ||||
| 2026-02-10 | 13F | Goldman Sachs Group Inc | 137.735 | -81,91 | 3.268 | -76,71 | ||||
| 2025-11-14 | 13F | Ubs Asset Management Americas Inc | 0 | -100,00 | 0 | |||||
| 2026-01-29 | 13F | Pictet Asset Management Holding SA | 15.271 | 22,96 | 363 | 59,21 | ||||
| 2026-02-13 | 13F | Pathstone Holdings, LLC | 55.290 | 6,39 | 1.312 | 37,10 | ||||
| 2026-02-13 | 13F | Charles Schwab Investment Management Inc | 134.788 | 109,48 | 3.206 | 170,46 | ||||
| 2026-02-17 | 13F | Amundi | 2.536.138 | 1,91 | 60.183 | 33,31 | ||||
| 2026-02-12 | 13F | Sprott Inc. | 1.074.396 | -19,25 | 25.499 | 4,01 | ||||
| 2025-08-29 | NP | JOHN HANCOCK INVESTMENT TRUST - John Hancock Diversified Real Assets Fund Class NAV | 167.228 | -7,35 | 2.660 | 46,18 | ||||
| 2026-01-20 | 13F | Thurston, Springer, Miller, Herd & Titak, Inc. | 115 | 3 | ||||||
| 2026-01-30 | 13F | Kiker Wealth Management, LLC | 0 | -100,00 | 0 | |||||
| 2025-08-28 | NP | CSNR - Cohen & Steers Natural Resources Active ETF | 18.772 | 299 | ||||||
| 2026-02-11 | 13F | Jpmorgan Chase & Co | 1.210.102 | -17,56 | 28.716 | 6,15 | ||||
| 2026-02-13 | 13F | Southeast Asset Advisors Inc. | 10.000 | 237 | ||||||
| 2025-11-14 | 13F | Wolverine Trading, Llc | 38.282 | 712 | ||||||
| 2025-11-14 | 13F | Wolverine Trading, Llc | Call | 31.400 | 182,88 | 584 | 247,02 | |||
| 2026-02-17 | 13F | Private Advisor Group, LLC | 9.077 | 215 | ||||||
| 2025-11-14 | 13F | Wolverine Trading, Llc | Put | 49.500 | 920 | |||||
| 2026-02-13 | 13F | SRS Capital Advisors, Inc. | 1.150 | -23,33 | 27 | 0,00 | ||||
| 2025-09-29 | NP | GOEX - Global X Gold Explorers ETF This fund is a listed as child fund of Mirae Asset Global Investments Co., Ltd. and if that institution has disclosed ownership in this security, then these positions will not be double counted when calculating total shares and total value | 56.332 | 5,16 | 795 | 24,26 | ||||
| 2026-02-12 | 13F | BlackRock, Inc. | 0 | -100,00 | 0 | |||||
| 2026-02-13 | 13F | Public Sector Pension Investment Board | 45.617 | 1.083 | ||||||
| 2025-11-14 | 13F | Two Sigma Advisers, Lp | 0 | -100,00 | 0 | |||||
| 2026-02-17 | 13F | Alliancebernstein L.p. | 10.860 | 258 | ||||||
| 2025-11-14 | 13F | CI Private Wealth, LLC | 0 | -100,00 | 0 | |||||
| 2026-02-13 | 13F | Citigroup Inc | 35.844 | -9,67 | 852 | 16,71 | ||||
| 2025-11-07 | 13F | Shell Asset Management Co | 1.055 | -74,48 | 0 | |||||
| 2026-02-05 | 13F | Helikon Investments Ltd | 15.828.709 | -6,18 | 375.615 | 20,80 | ||||
| 2026-02-10 | 13F | CIBC World Markets Inc. | 57.483 | 51,41 | 1.365 | 95,28 | ||||
| 2026-01-28 | 13F | CAPROCK Group, Inc. | 124.566 | 2.956 | ||||||
| 2025-11-14 | 13F | Point72 Asia (Singapore) Pte. Ltd. | 0 | -100,00 | 0 | |||||
| 2026-02-12 | 13F | Bank Of Montreal /can/ | 786.924 | 16,30 | 18.691 | 50,02 | ||||
| 2025-09-25 | NP | VGTSX - Vanguard Total International Stock Index Fund Investor Shares | 79.602 | 1.120 | ||||||
| 2025-11-14 | 13F | Aigen Investment Management, Lp | 0 | -100,00 | 0 | |||||
| 2025-11-12 | 13F | Forge First Asset Management Inc. | 400.000 | 7.370 | ||||||
| 2025-11-13 | 13F | Eisler Capital Management Ltd. | 116.835 | 2.211 | ||||||
| 2026-02-09 | 13F | Geode Capital Management, Llc | 59.005 | 26,64 | 1.445 | 67,25 | ||||
| 2026-02-10 | 13F | Td Asset Management Inc | 1.510.392 | 1,72 | 35.921 | 31,33 | ||||
| 2026-02-17 | 13F | Two Sigma Investments, Lp | 21.200 | -42,11 | 503 | -25,37 | ||||
| 2026-02-13 | 13F | BRITISH COLUMBIA INVESTMENT MANAGEMENT Corp | 64.296 | -4,04 | 1.527 | 23,84 | ||||
| 2026-02-10 | 13F | CIBC Asset Management Inc | 106.111 | -0,00 | 2.522 | 29,22 | ||||
| 2026-02-17 | 13F | Gotham Asset Management, LLC | 92.820 | 2.203 | ||||||
| 2026-02-17 | 13F | DZ BANK AG Deutsche Zentral Genossenschafts Bank, Frankfurt am Main | 0 | -100,00 | 0 | |||||
| 2025-08-28 | NP | SSGVX - State Street Global Equity ex-U.S. Index Portfolio State Street Global All Cap Equity ex-U.S. Index Portfolio This fund is a listed as child fund of State Street Corp and if that institution has disclosed ownership in this security, then these positions will not be double counted when calculating total shares and total value | 21.300 | -27,55 | 338 | 14,19 | ||||
| 2025-08-28 | NP | GWX - SPDR(R) S&P(R) International Small Cap ETF | 34.979 | -1,57 | 555 | 55,03 | ||||
| 2026-02-09 | 13F | Legal & General Group Plc | 72.833 | 6,84 | 1.732 | 38,01 | ||||
| 2026-02-10 | 13F | BW Gestao de Investimentos Ltda. | 438.147 | 10.397 | ||||||
| 2026-01-27 | 13F | Zurcher Kantonalbank (Zurich Cantonalbank) | 14.498 | 0,00 | 345 | 28,84 | ||||
| 2026-02-13 | 13F | Hudson Bay Capital Management LP | 121.400 | 101,34 | 2.881 | 159,23 | ||||
| 2026-02-24 | 13F | Astoria Portfolio Advisors LLC. | 9.071 | 323 | ||||||
| 2025-09-26 | NP | SUNAMERICA SERIES TRUST - SA T. Rowe Price VCP Balanced Portfolio Class 3 | 14.444 | -8,97 | 203 | 7,41 | ||||
| 2026-02-17 | 13F | Tower Research Capital LLC (TRC) | 0 | -100,00 | 0 | |||||
| 2026-02-13 | 13F | Squarepoint Ops LLC | 29.315 | 696 | ||||||
| 2026-01-29 | 13F | UBS Group AG | 1.290.071 | 25,36 | 30.613 | 61,41 | ||||
| 2026-02-13 | 13F | Toroso Investments, LLC | 70.283 | 37,08 | 1.668 | 76,59 | ||||
| 2026-02-17 | 13F | Bank Of America Corp /de/ | 273.882 | -42,28 | 6.499 | -25,67 | ||||
| 2025-08-28 | NP | Amplify ETF Trust - Amplify Junior Silver Miners ETF | 1.405.919 | -23,41 | 22.317 | 20,60 | ||||
| 2026-02-10 | 13F/A | Northwestern Mutual Wealth Management Co | 5 | 0 | ||||||
| 2026-02-12 | 13F | Northwest & Ethical Investments L.P. | 10.524 | 30,51 | 250 | 68,24 | ||||
| 2026-02-17 | 13F | Orion Resource Partners LP | 2.775.640 | -19,50 | 65.928 | 3,85 | ||||
| 2025-11-14 | 13F | Balyasny Asset Management Llc | 0 | -100,00 | 0 | |||||
| 2026-02-09 | 13F | Murphy Pohlad Asset Management LLC | 8.700 | 206 | ||||||
| 2026-02-03 | 13F | SBI Securities Co., Ltd. | 610 | 3,39 | 14 | 40,00 | ||||
| 2026-02-13 | 13F | Arrowstreet Capital, Limited Partnership | 18.011 | 428 | ||||||
| 2025-08-27 | NP | Jnl Series Trust - Jnl/t. Rowe Price Managed Volatility Balanced Fund (a) | 6.860 | -6,01 | 109 | 49,32 | ||||
| 2026-02-13 | 13F | Alberta Investment Management Corp | 250.000 | 5.938 | ||||||
| 2026-02-18 | 13F | Mackenzie Financial Corp | 253.452 | 19,11 | 6.056 | 54,58 | ||||
| 2026-02-17 | 13F | Advisor Group Holdings, Inc. | 11.626 | -27,03 | 276 | 2,60 | ||||
| 2026-02-17 | 13F | PDT Partners, LLC | 22.487 | 0,00 | 534 | 28,74 | ||||
| 2026-02-17 | 13F | Toronto Dominion Bank | 122.899 | 1.031,88 | 2.919 | 1.366,83 | ||||
| 2025-11-14 | 13F | ExodusPoint Capital Management, LP | 0 | -100,00 | 0 | |||||
| 2025-09-25 | NP | WELLS FARGO MASTER TRUST - Wells Fargo Real Return Portfolio Real Return Portfolio | 7.000 | 0,00 | 99 | 18,07 | ||||
| 2026-02-13 | 13F | Dynamic Technology Lab Private Ltd | 0 | -100,00 | 0 | |||||
| 2026-02-17 | 13F | Aquatic Capital Management LLC | 39.517 | 11,98 | 938 | 44,15 | ||||
| 2026-02-17 | 13F | Russell Investments Group, Ltd. | 1.913 | 45 | ||||||
| 2026-01-07 | 13F | Harbor Investment Advisory, Llc | 533 | 0,00 | 13 | 33,33 | ||||
| 2026-02-10 | 13F | Jupiter Asset Management Ltd | 0 | -100,00 | 0 | |||||
| 2026-01-30 | 13F | Pekin Hardy Strauss, Inc. | 224.073 | 26,65 | 5.330 | 63,52 | ||||
| 2026-02-09 | 13F | Waratah Capital Advisors Ltd. | 1.526.799 | 24,34 | 36.231 | 60,10 | ||||
| 2026-01-16 | 13F | FNY Investment Advisers, LLC | 14.600 | 0 | ||||||
| 2026-02-12 | 13F | Howland Capital Management Llc | 22.080 | 0,00 | 524 | 28,82 | ||||
| 2026-01-16 | 13F | FNY Investment Advisers, LLC | Call | 90 | 0 | |||||
| 2026-02-17 | 13F | Jain Global LLC | 8.500 | -17,34 | 202 | 6,35 | ||||
| 2026-02-12 | 13F | Jane Street Group, Llc | 499.647 | -31,78 | 11.857 | -12,20 | ||||
| 2026-02-12 | 13F | Jane Street Group, Llc | Put | 87.900 | 18,62 | 2.086 | 52,64 | |||
| 2026-02-05 | 13F | Cardinal Point Capital Management, ULC | 15.000 | 0,00 | 357 | 28,99 | ||||
| 2026-02-10 | 13F | Quantbot Technologies LP | 121.303 | 79,24 | 2.879 | 130,79 | ||||
| 2026-02-12 | 13F | Jane Street Group, Llc | Call | 277.500 | 77,32 | 6.585 | 128,25 | |||
| 2026-02-17 | 13F | Susquehanna International Group, Llp | 293.455 | 245,52 | 6.964 | 344,92 | ||||
| 2026-02-17 | 13F | Susquehanna International Group, Llp | Put | 148.400 | 241,94 | 3.522 | 340,68 | |||
| 2026-02-13 | 13F | Morgan Stanley | 888.954 | 20,24 | 21.095 | 54,82 | ||||
| 2026-02-02 | 13F | Intact Investment Management Inc. | 157.200 | 81,31 | 3.734 | 133,90 | ||||
| 2026-02-17 | 13F | Captrust Financial Advisors | 8.600 | 204 | ||||||
| 2026-02-17 | 13F | Susquehanna International Group, Llp | Call | 540.700 | 624,80 | 12.831 | 833,77 | |||
| 2026-02-13 | 13F | Walleye Capital LLC | 42.936 | 1.019 | ||||||
| 2026-02-13 | 13F | Van Eck Associates Corp | 4.862.516 | 2,55 | 115 | 32,18 | ||||
| 2026-02-17 | 13F | Citadel Advisors Llc | Put | 313.100 | -25,98 | 7.430 | -4,70 | |||
| 2026-02-17 | 13F | Medici Capital Llc | 0 | -100,00 | 0 | |||||
| 2026-02-17 | 13F | Quadrature Capital Ltd | 49.100 | 1.165 | ||||||
| 2026-02-06 | 13F | Profund Advisors Llc | 12.438 | -12,16 | 295 | 13,46 | ||||
| 2026-02-13 | 13F | Kestra Advisory Services, LLC | 4.134 | 98 | ||||||
| 2026-02-13 | 13F | Barclays Plc | 101.729 | -30,10 | 2.414 | -9,99 | ||||
| 2026-02-13 | 13F | Fortitude Advisory Group L.L.C. | 59.000 | 8,08 | 1.400 | 39,17 | ||||
| 2026-02-13 | 13F | Hurley Capital, LLC | 0 | -100,00 | 0 | |||||
| 2026-01-28 | 13F | Eagle Global Advisors Llc | 0 | -100,00 | 0 | |||||
| 2026-01-07 | 13F | Aventura Private Wealth, LLC | 80 | 2 | ||||||
| 2026-02-17 | 13F | MIRAE ASSET GLOBAL ETFS HOLDINGS Ltd. | 69.572 | 9,74 | 1.655 | 41,73 | ||||
| 2026-02-12 | 13F | Swiss National Bank | 156.000 | 6,92 | 3.713 | 38,10 | ||||
| 2026-01-23 | 13F | Farther Finance Advisors, LLC | 152 | 4 | ||||||
| 2026-02-11 | 13F | Picton Mahoney Asset Management | 126.000 | 2.997 | ||||||
| 2026-02-06 | 13F | Gsa Capital Partners Llp | 21.182 | 0,00 | 1 | |||||
| 2026-02-17 | 13F | Royal Bank Of Canada | 1.236.448 | 14,07 | 29.341 | 46,87 | ||||
| 2026-02-13 | 13F | Cutler Capital Management, LLC | 13.805 | -4,79 | 328 | 22,47 | ||||
| 2026-02-17 | 13F | Raymond James Financial Inc | 125.847 | -12,38 | 2.986 | 12,85 | ||||
| 2026-01-29 | 13F | Vanguard Group Inc | 2.625.277 | 108,28 | 62.353 | 168,62 | ||||
| 2026-01-23 | 13F | Pinnacle Wealth Management Group, Inc. | 45.257 | 130,90 | 1.074 | 197,23 | ||||
| 2026-01-26 | 13F | Cwm, Llc | 565 | 0 | ||||||
| 2026-02-13 | 13F | Peak6 Llc | Call | 83.200 | 1.974 | |||||
| 2026-02-17 | 13F | D. E. Shaw & Co., Inc. | 79.118 | 160,26 | 1.879 | 236,14 | ||||
| 2026-01-20 | 13F | Corundum Trust Company, INC | 63.750 | 0,00 | 1.513 | 28,79 | ||||
| 2025-09-26 | NP | FTIHX - Fidelity Total International Index Fund This fund is a listed as child fund of Fmr Llc and if that institution has disclosed ownership in this security, then these positions will not be double counted when calculating total shares and total value | 38.479 | 0,00 | 542 | 17,86 | ||||
| 2026-02-11 | 13F | Group One Trading, L.p. | 14.391 | 341 | ||||||
| 2026-02-11 | 13F | Deutsche Bank Ag\ | 208.256 | 19,70 | 4.942 | 54,12 | ||||
| 2026-02-17 | 13F | Citadel Advisors Llc | Call | 35.600 | 180,31 | 845 | 260,68 | |||
| 2026-02-17 | 13F | Citadel Advisors Llc | 348.873 | 48,51 | 8.279 | 91,22 | ||||
| 2025-09-23 | NP | FKRCX - Franklin Gold & Precious Metals Fund Class A | 1.495.149 | -5,38 | 21.042 | 11,39 | ||||
| 2026-02-12 | 13F | Federation des caisses Desjardins du Quebec | 217.110 | -8,09 | 5.144 | 18,28 | ||||
| 2026-02-13 | 13F | National Bank Of Canada /fi/ | 246.400 | 65,36 | 5.844 | 113,09 | ||||
| 2026-02-10 | 13F | Bnp Paribas Arbitrage, Sa | 81.340 | -9,57 | 1.930 | 16,48 | ||||
| 2026-02-10 | 13F | PCJ Investment Counsel Ltd. | 142.470 | -2,34 | 3.384 | 26,00 | ||||
| 2026-02-17 | 13F | Edmond De Rothschild Holding S.a. | 149.656 | 0,02 | 3.563 | 29,38 | ||||
| 2026-01-14 | 13F | ORG Partners LLC | 202 | 1.920,00 | 5 | |||||
| 2026-02-17 | 13F | Susquehanna Advisors Group, Inc. | 0 | -100,00 | 0 | |||||
| 2026-02-12 | 13F | Groupe la Francaise | 325.000 | -8,32 | 7.717 | 18,09 | ||||
| 2025-08-28 | NP | SPGM - SPDR(R) Portfolio MSCI Global Stock Market ETF | 6.438 | 125,34 | 102 | 264,29 | ||||
| 2026-02-13 | 13F | Y-Intercept (Hong Kong) Ltd | 74.757 | 1.774 | ||||||
| 2026-01-21 | 13F | Flagship Harbor Advisors, Llc | 384 | 9 | ||||||
| 2026-02-17 | 13F | Brevan Howard Capital Management LP | 14.910 | 354 | ||||||
| 2026-01-27 | 13F | TD Waterhouse Canada Inc. | 254 | -97,58 | 6 | -96,87 | ||||
| 2026-02-17 | 13F | Millennium Management Llc | 2.202.510 | 44,64 | 52.309 | 86,51 | ||||
| 2026-02-18 | 13F/A | Empowered Funds, LLC | 10.417 | 247 | ||||||
| 2026-02-23 | 13F | Virtu Financial LLC | 13.839 | 0 | ||||||
| 2026-02-11 | 13F | LPL Financial LLC | 23.053 | -22,26 | 547 | 0,18 | ||||
| 2026-02-13 | 13F | Bornite Capital Management LP | 523.000 | 12.423 | ||||||
| 2025-11-14 | 13F | Cubist Systematic Strategies, LLC | 186.064 | 439,97 | 3.428 | 526,69 | ||||
| 2025-11-14 | 13F | Knoll Capital Management, LLC | 0 | -100,00 | 0 | |||||
| 2026-01-30 | 13F | Georgetown University | 9.500 | 226 | ||||||
| 2026-01-16 | 13F | FNY Investment Advisers, LLC | Put | 0 | -100,00 | 0 | ||||
| 2026-02-06 | 13F | Pnc Financial Services Group, Inc. | 2.390 | 0,00 | 57 | 27,27 | ||||
| 2026-02-17 | 13F | Advisory Services Network, LLC | 0 | -100,00 | 0 | |||||
| 2025-09-25 | NP | TLTD - FlexShares Morningstar Developed Markets ex-US Factor Tilt Index Fund | 1.023 | 14 | ||||||
| 2026-02-10 | 13F | Armor Advisors, L.l.c. | 90.400 | 2.145 | ||||||
| 2026-02-13 | 13F | Colony Group, LLC | 10.000 | 237 | ||||||
| 2026-01-20 | 13F | Toth Financial Advisory Corp | 300 | 0,00 | 7 | 40,00 | ||||
| 2026-02-10 | 13F | Connor, Clark & Lunn Investment Management Ltd. | 1.408.546 | -7,31 | 33.456 | 19,58 | ||||
| 2026-02-17 | 13F | Investment Management Corp of Ontario | 14.858 | 353 | ||||||
| 2025-09-25 | NP | VFSNX - Vanguard FTSE All-World ex-US Small-Cap Index Fund Institutional Shares | 18.212 | 256 | ||||||
| 2026-02-17 | 13F | Voloridge Investment Management, Llc | 85.220 | 2.022 | ||||||
| 2026-02-05 | 13F | Mesirow Financial Investment Management, Inc. | 10.000 | 237 | ||||||
| 2026-02-13 | 13F | Goehring & Rozencwajg Associates, LLC | 562.975 | -35,65 | 13.373 | -17,11 | ||||
| 2025-09-25 | NP | VT - Vanguard Total World Stock Index Fund ETF Shares | 3.690 | 52 | ||||||
| 2026-01-27 | 13F | Fiscal Wisdom Wealth Management, LLC | 166.806 | -25,78 | 3.966 | 4,40 | ||||
| 2026-01-28 | 13F | Ruffer LLP | 814.056 | -35,90 | 19.391 | -17,12 | ||||
| 2025-08-28 | NP | QCSTRX - Stock Account Class R1 | 60.350 | -15,20 | 960 | 33,75 | ||||
| 2026-02-18 | 13F | Grand Central Investment Group | 12.594 | 299 | ||||||
| 2026-02-06 | 13F | Leonteq Securities AG | 0 | -100,00 | 0 | |||||
| 2025-09-24 | NP | IDEV - iShares Core MSCI International Developed Markets ETF | 81.140 | -0,15 | 1.142 | 17,51 | ||||
| 2026-02-13 | 13F | Manufacturers Life Insurance Company, The | 0 | -100,00 | 0 | |||||
| 2026-02-18 | 13F | Vident Advisory, LLC | 0 | -100,00 | 0 | |||||
| 2026-02-17 | 13F | Fmr Llc | 1.480.400 | 62,61 | 35.162 | 109,72 | ||||
| 2025-11-14 | 13F | Shay Capital LLC | 0 | -100,00 | 0 | |||||
| 2026-02-11 | 13F | Simplex Trading, Llc | 84.099 | 409,17 | 1.996 | |||||
| 2026-02-17 | 13F | Public Employees Retirement System Of Ohio | 17.240 | 6,28 | 410 | 36,79 |