Grundlæggende statistik
| Institutionelle aktier (lange) | 104.877.552 - 66,62% (ex 13D/G) - change of 6,45MM shares 6,55% MRQ |
| Institutionel værdi (lang) | $ 1.434.531 USD ($1000) |
Institutionelt ejerskab og aktionærer
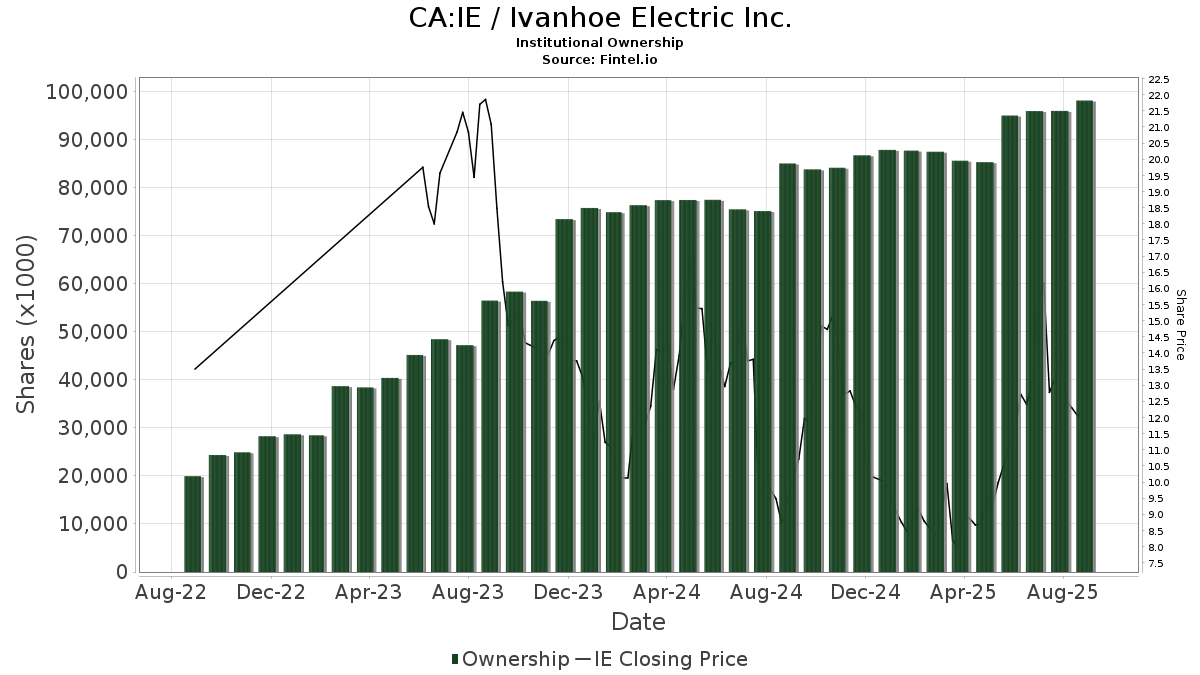
Ivanhoe Electric Inc. (CA:IE) har 184 institutionelle ejere og aktionærer, der har indsendt 13D/G- eller 13F-formularer til Securities Exchange Commission (SEC). Disse institutioner har i alt 104,877,552 aktier. Største aktionærer omfatter BlackRock, Inc., Price T Rowe Associates Inc /md/, Fmr Llc, Alyeska Investment Group, L.P., Vanguard Group Inc, State Street Corp, MIRAE ASSET GLOBAL ETFS HOLDINGS Ltd., SailingStone Capital Partners LLC, Primecap Management Co/ca/, and Wellington Management Group Llp .
Ivanhoe Electric Inc. (TSX:IE) institutionel ejerskabsstruktur viser aktuelle positioner i virksomheden efter institutioner og fonde, samt seneste ændringer i positionsstørrelse. Større aktionærer kan omfatte individuelle investorer, investeringsforeninger, hedgefonde eller institutioner. Skema 13D angiver, at investoren besidder (eller besidder) mere end 5 % af virksomheden og har til hensigt (eller har til hensigt at) aktivt at forfølge en ændring i forretningsstrategi. Skema 13G indikerer en passiv investering på over 5%.
The share price as of April 21, 2026 is 19,57 / share. Previously, on April 22, 2025, the share price was 8,47 / share. This represents an increase of 131,05% over that period.
Fondens stemningsscore
Fund Sentiment Score (fka Ownership Accumulation Score) finder de aktier, der bliver mest købt af fonde. Det er resultatet af en sofistikeret, multi-faktor kvantitativ model, der identificerer virksomheder med de højeste niveauer af institutionel akkumulering. Scoringsmodellen bruger en kombination af den samlede stigning i oplyste ejere, ændringerne i porteføljeallokeringer i disse ejere og andre målinger. Tallet går fra 0 til 100, hvor højere tal indikerer et højere niveau af akkumulering for sine jævnaldrende, og 50 er gennemsnittet.
Opdateringsfrekvens: Dagligt
Se Ownership Explorer, som giver en liste over højest rangerende virksomheder.
AI+ Ask Fintel’s AI assistant about Ivanhoe Electric Inc..
Select a question to share a public post with an AI-crafted answer.
Thinking of good questions…
13F og NPORT arkivering
Detaljer om 13F-arkivering er gratis. Detaljer om NP-ansøgninger kræver et premium-medlemskab. Grønne rækker angiver nye positioner. Røde rækker angiver lukkede positioner. Klik på linket ikon for at se den fulde transaktionshistorik.
Opgrader
for at låse premium-data op og eksportere til Excel ![]() .
.
| Fil dato | Kilde | Investor | Type | Gennemsnitlig pris (Øst) |
Aktier | Δ Aktier (%) |
Rapporteret Værdi ($1000) |
Δ Værdi (%) |
Port Alloc (%) |
|
|---|---|---|---|---|---|---|---|---|---|---|
| 2026-02-12 | 13F | MFN Partners Management, LP | 2.553.191 | 0,00 | 40.800 | 27,33 | ||||
| 2026-04-20 | 13F | Banque Cantonale Vaudoise | 22.700 | 13,50 | 268 | -16,25 | ||||
| 2025-10-27 | 13F | Kiker Wealth Management, LLC | 0 | -100,00 | 0 | |||||
| 2026-02-13 | 13F | Global Strategic Management Inc | 61.638 | 1 | ||||||
| 2026-01-28 | 13F | Arizona State Retirement System | 25.558 | 0,22 | 408 | 27,50 | ||||
| 2025-11-10 | 13F | Axq Capital, Lp | 0 | -100,00 | 0 | |||||
| 2026-02-13 | 13F | Kopernik Global Investors, LLC | 428.752 | -67,91 | 6.851 | -59,14 | ||||
| 2026-02-13 | 13F | Rhumbline Advisers | 120.124 | 0,76 | 1.920 | 28,28 | ||||
| 2025-11-14 | 13F | Skopos Labs, Inc. | 0 | -100,00 | 0 | |||||
| 2026-02-02 | 13F | Truist Financial Corp | 15.000 | 0,00 | 240 | 27,13 | ||||
| 2026-02-12 | 13F | Voya Investment Management Llc | 18.432 | 15,09 | 295 | 47,00 | ||||
| 2026-02-13 | 13F | Walleye Capital LLC | Call | 13.900 | -63,32 | 222 | -53,26 | |||
| 2026-02-13 | 13F | Formula Growth Ltd | 37.198 | -71,65 | 594 | -63,91 | ||||
| 2026-02-13 | 13F | Walleye Capital LLC | Put | 27.100 | 122,13 | 433 | 183,01 | |||
| 2026-02-13 | 13F | Walleye Capital LLC | 39.628 | 800,64 | 633 | 1.050,91 | ||||
| 2026-02-17 | 13F/A | Militia Capital Partners, LP | 0 | -100,00 | 0 | -100,00 | ||||
| 2026-02-17 | 13F | Brevan Howard Capital Management LP | 17.974 | -64,47 | 287 | -54,73 | ||||
| 2026-02-03 | 13F | Ballentine Partners, LLC | 0 | -100,00 | 0 | |||||
| 2026-02-17 | 13F | PDT Partners, LLC | 81.454 | -38,23 | 1.302 | -21,39 | ||||
| 2026-04-22 | 13F | Pictet Asset Management Holding SA | 15.550 | 0,00 | 184 | -26,21 | ||||
| 2026-02-11 | 13F | Simplex Trading, Llc | 52.761 | 101,39 | 843 | |||||
| 2026-02-13 | 13F | Goehring & Rozencwajg Associates, LLC | 1.787.897 | 5,34 | 28.571 | 34,14 | ||||
| 2026-02-12 | 13F | Sprott Inc. | 15.108 | 39,53 | 241 | 78,52 | ||||
| 2026-02-17 | 13F | Bank Of America Corp /de/ | 198.204 | 264,98 | 3.167 | 365,05 | ||||
| 2026-02-09 | 13F | Quest Partners LLC | 4.459 | -21,61 | 71 | 0,00 | ||||
| 2026-02-06 | 13F | Pnc Financial Services Group, Inc. | 594 | 14,89 | 9 | 50,00 | ||||
| 2026-04-15 | 13F | FNY Investment Advisers, LLC | 0 | -100,00 | 0 | |||||
| 2026-02-12 | 13F | Dimensional Fund Advisors Lp | 737.096 | -2,88 | 11.780 | 23,73 | ||||
| 2026-01-15 | 13F | Nisa Investment Advisors, Llc | 1.498 | 0,00 | 24 | 27,78 | ||||
| 2026-02-17 | 13F | Keebeck Alpha, LP | 0 | -100,00 | 0 | |||||
| 2026-02-11 | 13F | Parallel Advisors, LLC | 270 | -24,37 | 4 | 0,00 | ||||
| 2026-02-12 | 13F | Federation des caisses Desjardins du Quebec | 43.080 | 45,15 | 669 | 87,39 | ||||
| 2026-02-11 | 13F | Deutsche Bank Ag\ | 83.795 | 10,54 | 1.339 | 40,80 | ||||
| 2026-02-12 | 13F | DRW Securities, LLC | 100.000 | 1.598 | ||||||
| 2026-02-17 | 13F | Raffles Associates Lp | 573.077 | -11,57 | 9.158 | 12,59 | ||||
| 2026-02-17 | 13F | Parallax Volatility Advisers, L.P. | Call | 24.900 | 0,00 | 398 | 27,24 | |||
| 2026-04-15 | 13F | FNY Investment Advisers, LLC | Call | 300 | 0 | |||||
| 2026-02-11 | 13F | Invst, LLC | 224.893 | 0,00 | 3.594 | 27,32 | ||||
| 2025-11-07 | 13F | CenterBook Partners LP | 0 | -100,00 | 0 | |||||
| 2026-02-05 | 13F | Allworth Financial LP | 387 | 39,21 | 6 | 100,00 | ||||
| 2026-02-13 | 13F | Ubs Asset Management Americas Inc | 183.253 | -9,24 | 2.928 | 15,59 | ||||
| 2026-02-12 | 13F | New York State Common Retirement Fund | 33.555 | 38,92 | 536 | 76,90 | ||||
| 2026-02-17 | 13F | Aquatic Capital Management LLC | 15.966 | 255 | ||||||
| 2026-02-17 | 13F | Jump Financial, LLC | 11.195 | -45,42 | 179 | -30,74 | ||||
| 2026-02-17 | 13F | Dark Forest Capital Management Lp | 77.659 | 228,76 | 1.241 | 318,92 | ||||
| 2026-02-17 | 13F | D. E. Shaw & Co., Inc. | 494.005 | 374,12 | 7.894 | 503,98 | ||||
| 2026-02-12 | 13F | Alps Advisors Inc | 251.872 | 59,00 | 4.025 | 102,41 | ||||
| 2026-02-13 | 13F | Caxton Associates Llp | 25.329 | 405 | ||||||
| 2026-02-17 | 13F | Sig Brokerage, Lp | Put | 0 | -100,00 | 0 | ||||
| 2025-11-14 | 13F/A | Covalis Capital Llp | 0 | -100,00 | 0 | -100,00 | ||||
| 2026-02-13 | 13F | Centerpoint Advisors, LLC | 4.350 | -5,43 | 0 | |||||
| 2026-02-17 | 13F | MIRAE ASSET GLOBAL ETFS HOLDINGS Ltd. | 4.027.027 | 240,00 | 64.474 | 361,84 | ||||
| 2026-04-13 | 13F | Jackson Square Capital, Llc | 0 | -100,00 | 0 | |||||
| 2026-02-13 | 13F | Towarzystwo Funduszy Inwestycyjnych Pzu Sa | 0 | -100,00 | 0 | |||||
| 2025-11-14 | 13F | Strategic Wealth Partners, Ltd. | 4.080 | 51 | ||||||
| 2025-11-14 | 13F | Strategic Wealth Partners, Ltd. | Call | 8.400 | 105 | |||||
| 2026-02-13 | 13F | Alyeska Investment Group, L.P. | 7.552.332 | 259,52 | 120.686 | 357,79 | ||||
| 2026-02-12 | 13F | Nuveen, LLC | 177.982 | 15,30 | 2.844 | 46,82 | ||||
| 2026-02-13 | 13F | Bridgewater Associates, LP | 324.413 | 27,17 | 5.184 | 61,95 | ||||
| 2026-02-17 | 13F | Russell Investments Group, Ltd. | 70.093 | -65,66 | 1.120 | -56,27 | ||||
| 2026-01-26 | 13F | Cwm, Llc | 980 | 128,44 | 0 | |||||
| 2026-02-14 | 13F | Rockefeller Capital Management L.P. | 8.575 | 1,30 | 137 | 29,25 | ||||
| 2026-02-17 | 13F | Man Group plc | 0 | -100,00 | 0 | |||||
| 2026-01-29 | 13F | UMA Financial Services, Inc. | 136 | 0,00 | 2 | 100,00 | ||||
| 2026-02-17 | 13F | XTX Topco Ltd | 43.599 | 697 | ||||||
| 2025-11-13 | 13F | BW Gestao de Investimentos Ltda. | 0 | -100,00 | 0 | |||||
| 2026-02-17 | 13F | Advisory Services Network, LLC | 0 | -100,00 | 0 | |||||
| 2026-04-13 | 13F | IFP Advisors, Inc | 20 | -99,33 | 0 | -100,00 | ||||
| 2026-02-10 | 13F | Connor, Clark & Lunn Investment Management Ltd. | 1.118.400 | 2.778,99 | 17.886 | 3.657,35 | ||||
| 2026-02-17 | 13F | Creative Planning | 58.179 | 41,18 | 930 | 79,69 | ||||
| 2026-02-09 | 13F | Legal & General Group Plc | 1.214.463 | -31,35 | 19.407 | -12,59 | ||||
| 2026-02-17 | 13F | Parallax Volatility Advisers, L.P. | 0 | -100,00 | 0 | |||||
| 2026-02-17 | 13F | SailingStone Capital Partners LLC | 3.781.417 | -26,96 | 60.427 | -7,00 | ||||
| 2026-02-13 | 13F | Neuberger Berman Group LLC | 42.440 | 1,47 | 678 | 29,39 | ||||
| 2026-02-12 | 13F | Marex Group plc | 0 | -100,00 | 0 | -100,00 | ||||
| 2026-02-13 | 13F | Landscape Capital Management, L.l.c. | 12.282 | 196 | ||||||
| 2026-02-13 | 13F | BNP Paribas Asset Management Holding S.A. | 1.462 | 61,01 | 0 | |||||
| 2026-02-17 | 13F | Tower Research Capital LLC (TRC) | 7.867 | 70,80 | 126 | 119,30 | ||||
| 2026-02-13 | 13F | Maven Securities LTD | 20.000 | 320 | ||||||
| 2026-02-17 | 13F | potrero capital research llc | 588.590 | -57,50 | 9.406 | -45,89 | ||||
| 2026-04-06 | 13F | Versant Capital Management, Inc | 1.385 | 0,00 | 16 | -27,27 | ||||
| 2026-02-12 | 13F | Federated Hermes, Inc. | 203 | 3 | ||||||
| 2026-04-06 | 13F | GAMMA Investing LLC | 2.085 | 34,34 | 25 | 0,00 | ||||
| 2026-02-12 | 13F | EntryPoint Capital, LLC | 10.357 | 166 | ||||||
| 2026-01-30 | 13F | Us Bancorp \de\ | 3.578 | -7,52 | 57 | 18,75 | ||||
| 2026-02-13 | 13F | Toroso Investments, LLC | 59.292 | 11,56 | 947 | 41,98 | ||||
| 2026-02-17 | 13F | Janus Henderson Group Plc | 142.956 | 219,81 | 2.282 | 308,23 | ||||
| 2026-02-17 | 13F | Pentwater Capital Management LP | 0 | -100,00 | 0 | |||||
| 2026-02-10 | 13F | Intech Investment Management Llc | 33.329 | 15,69 | 533 | 47,37 | ||||
| 2026-02-17 | 13F | Massar Capital Management, LP | 84.224 | 1.346 | ||||||
| 2026-02-20 | 13F | Sunbelt Securities, Inc. | 500 | 8 | ||||||
| 2026-02-17 | 13F | Tannin Capital LLC | 48.328 | 772 | ||||||
| 2026-04-20 | 13F | Hilton Head Capital Partners, LLC | 500 | 0,00 | 6 | -28,57 | ||||
| 2026-02-17 | 13F | Balyasny Asset Management Llc | Call | 16.000 | 256 | |||||
| 2026-02-17 | 13F | Millennium Management Llc | 0 | -100,00 | 0 | |||||
| 2026-02-17 | 13F | Royal Bank Of Canada | 143.765 | -22,74 | 2.298 | -1,58 | ||||
| 2026-02-10 | 13F | Bank of New York Mellon Corp | 283.386 | 13,27 | 4.529 | 44,25 | ||||
| 2026-02-19 | 13F | Invesco Ltd. | 359.268 | 643,89 | 5.741 | 847,36 | ||||
| 2026-01-29 | 13F | Vanguard Group Inc | 6.579.446 | 24,39 | 105.140 | 58,39 | ||||
| 2026-02-05 | 13F | Cambridge Investment Research Advisors, Inc. | 54.624 | -13,12 | 1 | |||||
| 2026-02-10 | 13F | Quantbot Technologies LP | 3.099 | -79,52 | 50 | -74,07 | ||||
| 2026-01-30 | 13F | Jennison Associates Llc | 787.017 | 0,06 | 12.577 | 27,40 | ||||
| 2026-02-11 | 13F | Capital Wealth Planning, LLC | 12.700 | 203 | ||||||
| 2026-02-13 | 13F | Gts Securities Llc | 0 | -100,00 | 0 | |||||
| 2026-02-17 | 13F | Raymond James Financial Inc | 22.142 | 38,03 | 354 | 75,62 | ||||
| 2026-02-17 | 13F | Nomura Holdings Inc | Call | 750.000 | -26,47 | 11.985 | -6,37 | |||
| 2025-11-14 | 13F | Cubist Systematic Strategies, LLC | 44.674 | 561 | ||||||
| 2026-01-14 | 13F | Q Fund Management (Hong Kong) Ltd | 25.000 | 400 | ||||||
| 2026-02-17 | 13F | Nomura Holdings Inc | Put | 320.000 | 106,45 | 5.114 | 162,88 | |||
| 2026-02-05 | 13F | Abacus Wealth Partners, LLC | 20.069 | 321 | ||||||
| 2025-11-14 | 13F | Cinctive Capital Management LP | 0 | -100,00 | 0 | |||||
| 2026-01-28 | 13F | Eagle Global Advisors Llc | 12.400 | -24,85 | 198 | -4,35 | ||||
| 2026-01-29 | 13F | UBS Group AG | 171.029 | -40,79 | 2.733 | -24,61 | ||||
| 2026-04-16 | 13F | SG Americas Securities, LLC | 77.728 | -48,44 | 1 | -100,00 | ||||
| 2026-02-17 | 13F | State Of Wisconsin Investment Board | 0 | -100,00 | 0 | |||||
| 2026-04-07 | 13F | Farther Finance Advisors, LLC | 750 | 0,00 | 9 | -18,18 | ||||
| 2026-02-11 | 13F | Franklin Resources Inc | 758.257 | 30,18 | 12.117 | 65,75 | ||||
| 2026-02-11 | 13F | LPL Financial LLC | 165.255 | 11,38 | 2.641 | 41,78 | ||||
| 2026-02-17 | 13F | Citadel Advisors Llc | Put | 234.200 | 259,20 | 3.743 | 357,46 | |||
| 2026-04-20 | 13F | Kercheville Advisors, LLC | 0 | -100,00 | 0 | |||||
| 2026-02-17 | 13F | Citadel Advisors Llc | Call | 194.800 | -42,20 | 3.113 | -26,41 | |||
| 2026-02-17 | 13F | Jones Financial Companies Lllp | 1.113 | 12,08 | 18 | 54,55 | ||||
| 2026-02-17 | 13F | Susquehanna International Group, Llp | 63.965 | 1.022 | ||||||
| 2026-02-17 | 13F | Susquehanna International Group, Llp | Put | 378.000 | 147,87 | 6.040 | 215,73 | |||
| 2026-01-28 | 13F | Teacher Retirement System Of Texas | 0 | -100,00 | 0 | |||||
| 2026-01-28 | 13F | Klp Kapitalforvaltning As | 19.900 | -13,48 | 318 | 10,42 | ||||
| 2026-02-02 | 13F | Chung Wu Investment Group, LLC | 0 | -100,00 | 0 | |||||
| 2026-02-17 | 13F | Susquehanna International Group, Llp | Call | 194.400 | -54,60 | 3.107 | -42,19 | |||
| 2026-02-10 | 13F | Td Asset Management Inc | 353.040 | 5.653 | ||||||
| 2026-02-17 | 13F | Wellington Management Group Llp | 2.972.226 | 308,77 | 47.496 | 420,50 | ||||
| 2026-02-11 | 13F | Los Angeles Capital Management Llc | 618 | 9 | ||||||
| 2026-02-12 | 13F | BlackRock, Inc. | 13.913.700 | -4,00 | 222.341 | 22,23 | ||||
| 2026-02-13 | 13F | Mariner, LLC | 17.631 | -24,55 | 282 | -4,10 | ||||
| 2026-02-13 | 13F | Sei Investments Co | 19.852 | -49,79 | 317 | -36,09 | ||||
| 2026-02-18 | 13F/A | Empowered Funds, LLC | 16.746 | 268 | ||||||
| 2026-04-15 | 13F | Bayforest Capital Ltd | 227 | 3 | ||||||
| 2026-02-13 | 13F | Eschler Asset Management LLP | 0 | -100,00 | 0 | |||||
| 2026-02-17 | 13F | California State Teachers Retirement System | 89.510 | 22,88 | 1.430 | 56,46 | ||||
| 2026-02-11 | 13F | Vestcor Inc | 494.381 | -10,31 | 8 | 16,67 | ||||
| 2026-02-05 | 13F | O'Brien Greene & Co. Inc | 41.906 | 670 | ||||||
| 2026-02-13 | 13F | Wells Fargo & Company/mn | 121.282 | 114,94 | 1.938 | 173,73 | ||||
| 2026-02-09 | 13F | Harbour Investments, Inc. | 225 | 0,00 | 4 | 50,00 | ||||
| 2026-02-13 | 13F | Ripple Effect Asset Management LP | Call | 0 | -100,00 | 0 | -100,00 | |||
| 2026-02-10 | 13F | Hazlett, Burt & Watson, Inc. | 50 | 0,00 | 0 | |||||
| 2026-02-11 | 13F | Jpmorgan Chase & Co | 178.200 | 138,34 | 2.848 | 203,52 | ||||
| 2026-02-13 | 13F | Van Eck Associates Corp | 1.025.813 | 14,19 | 16 | 45,45 | ||||
| 2026-02-13 | 13F | Caitong International Asset Management Co., Ltd | 281 | 4 | ||||||
| 2026-02-06 | 13F | EverSource Wealth Advisors, LLC | 926 | 617,83 | 15 | 1.300,00 | ||||
| 2026-02-17 | 13F | Prelude Capital Management, Llc | 0 | -100,00 | 0 | |||||
| 2026-02-06 | 13F | HighTower Advisors, LLC | 11.849 | 189 | ||||||
| 2026-02-17 | 13F | Amundi | 13.373 | 214 | ||||||
| 2026-02-13 | 13F | SRS Capital Advisors, Inc. | 140 | 102,90 | 2 | |||||
| 2026-02-09 | 13F | Geode Capital Management, Llc | 2.477.773 | 17,46 | 39.602 | 49,57 | ||||
| 2026-04-13 | 13F | LexAurum Advisors, LLC | 37.850 | -53,30 | 447 | -56,05 | ||||
| 2026-02-17 | 13F | Sherbrooke Park Advisers Llc | 13.229 | 211 | ||||||
| 2026-02-12 | 13F | BRYN MAWR TRUST Co | 0 | -100,00 | 0 | -100,00 | ||||
| 2026-02-11 | 13F | Primecap Management Co/ca/ | 3.054.884 | 8,01 | 48.817 | 37,54 | ||||
| 2026-02-17 | 13F | Clear Street Markets Llc | 2.100 | -91,60 | 34 | -89,46 | ||||
| 2026-02-13 | 13F | Citigroup Inc | 7.918 | -11,78 | 127 | 12,50 | ||||
| 2026-02-17 | 13F | Graham Capital Management, L.P. | 0 | -100,00 | 0 | |||||
| 2026-02-13 | 13F | Manufacturers Life Insurance Company, The | 0 | -100,00 | 0 | |||||
| 2026-02-06 | 13F | ProShare Advisors LLC | 19.483 | 32,77 | 311 | 69,02 | ||||
| 2025-11-03 | 13F | TD Waterhouse Canada Inc. | 0 | -100,00 | 0 | |||||
| 2026-02-12 | 13F | Swiss National Bank | 183.300 | 9,69 | 2.929 | 39,68 | ||||
| 2026-03-12 | 13F/A | Peak6 Llc | Call | 895.100 | -55,16 | 14.304 | -42,91 | |||
| 2026-02-12 | 13F | MetLife Investment Management, LLC | 59.325 | 16,16 | 948 | 48,13 | ||||
| 2026-02-17 | 13F | Price T Rowe Associates Inc /md/ | 12.671.551 | 114,42 | 202 | 172,97 | ||||
| 2026-04-13 | 13F | Massmutual Trust Co Fsb/adv | 60 | 1 | ||||||
| 2026-02-17 | 13F | Adage Capital Partners Gp, L.l.c. | 0 | -100,00 | 0 | |||||
| 2026-02-13 | 13F | Inspire Advisors, LLC | 10.416 | 166 | ||||||
| 2026-02-10 | 13F | Bnp Paribas Arbitrage, Sa | 23.197 | 31,80 | 371 | 68,18 | ||||
| 2026-02-13 | 13F | Walleye Trading LLC | Call | 4.600 | -80,67 | 74 | -75,50 | |||
| 2026-02-13 | 13F | Walleye Trading LLC | 11.595 | 185 | ||||||
| 2026-02-13 | 13F | Morgan Stanley | 811.335 | -28,25 | 12.965 | -8,63 | ||||
| 2025-10-30 | 13F | Twin Peaks Wealth Advisors, LLC | 0 | -100,00 | 0 | |||||
| 2026-02-13 | 13F | Parkside Financial Bank & Trust | 85 | 0,00 | 1 | 0,00 | ||||
| 2026-02-13 | 13F | Walleye Trading LLC | Put | 73.900 | 1.439,58 | 1.181 | 1.866,67 | |||
| 2026-02-09 | 13F | Jefferies Financial Group Inc. | 0 | -100,00 | 0 | |||||
| 2026-02-17 | 13F | Voloridge Investment Management, Llc | 200.990 | 176,59 | 3.212 | 252,47 | ||||
| 2026-02-09 | 13F | Jefferies Financial Group Inc. | Put | 0 | -100,00 | 0 | ||||
| 2026-02-17 | 13F | Crawford Fund Management, LLC | Put | 55.000 | -52,99 | 879 | -40,19 | |||
| 2026-02-13 | 13F | Charles Schwab Investment Management Inc | 892.641 | 14,97 | 14.264 | 46,40 | ||||
| 2026-02-13 | 13F | Cordoba Advisory Partners LLC | 43.154 | 690 | ||||||
| 2026-02-13 | 13F | Ripple Effect Asset Management LP | 950.025 | 90,00 | 15.181 | 141,93 | ||||
| 2026-02-13 | 13F | Ripple Effect Asset Management LP | Put | 800.000 | 50,94 | 12.784 | 92,21 | |||
| 2026-02-13 | 13F | State Street Corp | 6.451.563 | 16,11 | 103.096 | 47,84 | ||||
| 2026-04-22 | 13F | Sterling Capital Management LLC | 1.104 | -24,28 | 13 | -43,48 | ||||
| 2026-02-13 | 13F | Entropy Technologies, LP | 0 | -100,00 | 0 | |||||
| 2026-02-17 | 13F | Cape Investment Advisory, Inc. | 100 | 2 | ||||||
| 2025-11-10 | 13F | Hartland & Co., LLC | 0 | -100,00 | 0 | |||||
| 2026-02-12 | 13F | Polen Capital Management Llc | 0 | -100,00 | 0 | |||||
| 2026-02-17 | 13F | Northern Trust Corp | 873.154 | 11,63 | 13.953 | 42,15 | ||||
| 2026-02-13 | 13F | JustInvest LLC | 10.422 | 167 | ||||||
| 2026-02-13 | 13F | Squarepoint Ops LLC | 0 | -100,00 | 0 | |||||
| 2026-02-17 | 13F | Advisor Group Holdings, Inc. | 1.133 | -3,16 | 18 | 50,00 | ||||
| 2026-02-17 | 13F | Moore Capital Management, Lp | 532.283 | -10,67 | 8.506 | 13,75 | ||||
| 2025-11-12 | 13F | HAP Trading, LLC | Call | 100.600 | 159 | |||||
| 2025-11-14 | 13F | Wolverine Trading, Llc | 14.766 | 174 | ||||||
| 2026-02-06 | 13F | Covestor Ltd | 13 | 0,00 | 0 | |||||
| 2026-02-12 | 13F | Quadrant Capital Group Llc | 1.142 | 0,00 | 18 | 28,57 | ||||
| 2025-11-14 | 13F | Wolverine Trading, Llc | Call | 51.300 | 603 | |||||
| 2026-02-11 | 13F | Winton Capital Group Ltd | 0 | -100,00 | 0 | |||||
| 2025-11-14 | 13F | Wolverine Trading, Llc | Put | 26.400 | 310 | |||||
| 2026-02-17 | 13F | Ghisallo Capital Management LLC | 100.000 | 1.598 | ||||||
| 2026-01-27 | 13F | Forum Financial Management, LP | 12.903 | 0,00 | 206 | 27,95 | ||||
| 2026-02-06 | 13F | Gsa Capital Partners Llp | 13.141 | 0 | ||||||
| 2026-02-12 | 13F | Grey Fox Wealth Advisors, LLC | 0 | -100,00 | 0 | |||||
| 2026-04-15 | 13F | Fortitude Family Office, LLC | 0 | -100,00 | 0 | |||||
| 2026-01-27 | 13F | Zurcher Kantonalbank (Zurich Cantonalbank) | 27.657 | 3,58 | 441 | 31,34 | ||||
| 2026-01-29 | 13F | Comerica Bank | 6.884 | -1,61 | 110 | 26,44 | ||||
| 2026-04-09 | 13F | Nelson, Van Denburg & Campbell Wealth Management Group, LLC | 13.273 | 0,00 | 157 | -26,42 | ||||
| 2025-11-12 | 13F | Aster Capital Management (DIFC) Ltd | 0 | -100,00 | 0 | |||||
| 2026-02-17 | 13F | Caption Management, LLC | Call | 72.900 | 1.165 | |||||
| 2026-02-17 | 13F | Driehaus Capital Management Llc | 2.103.189 | -0,20 | 33.609 | 27,08 | ||||
| 2026-02-05 | 13F | Amalgamated Bank | 3.349 | 16,08 | 0 | |||||
| 2026-02-10 | 13F | Goldman Sachs Group Inc | 742.691 | 76,97 | 11.868 | 125,37 | ||||
| 2026-02-17 | 13F | Caption Management, LLC | 189.800 | 5,44 | 3.033 | 34,26 | ||||
| 2026-01-28 | 13F | U S Global Investors Inc | 51.499 | 28,75 | 823 | 63,75 | ||||
| 2026-02-10 | 13F | Goldman Sachs Group Inc | Call | 356.300 | 5.694 | |||||
| 2026-02-17 | 13F | Aqr Capital Management Llc | 13.541 | 32,33 | 216 | 68,75 | ||||
| 2026-02-17 | 13F | Caption Management, LLC | Put | 423.600 | 9,29 | 6.769 | 39,17 | |||
| 2026-02-11 | 13F | Ameritas Investment Partners, Inc. | 8.653 | 138 | ||||||
| 2025-11-12 | 13F | Group One Trading, L.p. | 0 | -100,00 | 0 | -100,00 | ||||
| 2026-02-17 | 13F | Point72 Asset Management, L.P. | 0 | -100,00 | 0 | |||||
| 2026-02-13 | 13F | First Trust Advisors Lp | 500.585 | 7.999 | ||||||
| 2026-02-17 | 13F | Tudor Investment Corp Et Al | Call | 48.700 | 778 | |||||
| 2026-01-28 | 13F | Universal- Beteiligungs- und Servicegesellschaft mbH | 119.248 | 1,30 | 1.924 | 30,20 | ||||
| 2026-01-29 | 13F | Beirne Wealth Consulting Services, LLC | 0 | -100,00 | 0 | |||||
| 2026-04-07 | 13F | Signaturefd, Llc | 802 | 6,51 | 9 | -25,00 | ||||
| 2026-02-17 | 13F | Fmr Llc | 11.749.545 | 3,61 | 187.758 | 31,93 | ||||
| 2026-02-17 | 13F | Quantinno Capital Management LP | 67.202 | 82,25 | 1.074 | 132,25 | ||||
| 2026-02-13 | 13F | Wexford Capital Lp | 7.422 | 119 | ||||||
| 2026-02-12 | 13F | Jane Street Group, Llc | 113.497 | 110,95 | 1.814 | 168,59 | ||||
| 2026-01-30 | 13F | Pekin Hardy Strauss, Inc. | 25.220 | 403 | ||||||
| 2026-02-12 | 13F | Jane Street Group, Llc | Put | 172.400 | 61,73 | 2.755 | 105,98 | |||
| 2026-02-12 | 13F | Jane Street Group, Llc | Call | 197.200 | 78,14 | 3.151 | 126,85 | |||
| 2026-02-17 | 13F | Balyasny Asset Management Llc | 0 | -100,00 | 0 | |||||
| 2025-11-10 | 13F | Options Solutions, Llc | 0 | -100,00 | 0 | -100,00 | ||||
| 2026-01-29 | 13F | Teachers Retirement System Of The State Of Kentucky | 98.372 | 2 | ||||||
| 2026-01-21 | 13F/A | Euro Pacific Asset Management, LLC | 430.443 | -4,78 | 7 | 20,00 | ||||
| 2026-02-13 | 13F | Prudential Financial Inc | 0 | -100,00 | 0 | |||||
| 2026-02-13 | 13F | Barclays Plc | Call | 600.000 | 20,00 | 9.588 | 52,80 | |||
| 2026-02-13 | 13F | Barclays Plc | 179.730 | -37,66 | 2.872 | -20,62 | ||||
| 2026-02-12 | 13F | Cibc World Markets Corp | 0 | -100,00 | 0 | |||||
| 2026-02-17 | 13F | FIL Ltd | 1.500.000 | 23.970 | ||||||
| 2026-02-17 | 13F | Algert Global Llc | 149.132 | -36,24 | 2 | 0,00 | ||||
| 2026-04-13 | 13F | Mather Group, Llc. | 200 | 2 | ||||||
| 2026-02-17 | 13F | Alliancebernstein L.p. | 104.960 | 5,11 | 1.677 | 33,84 | ||||
| 2026-02-13 | 13F | Verition Fund Management LLC | 99.185 | 14,95 | 1.585 | 46,40 | ||||
| 2026-02-17 | 13F | Sig Brokerage, Lp | Call | 0 | -100,00 | 0 | ||||
| 2026-02-12 | 13F | Bank Of Montreal /can/ | Put | 15.000 | 240 | |||||
| 2026-02-10 | 13F | Rothschild Investment Llc | 316 | 1,94 | 5 | 66,67 | ||||
| 2026-02-12 | 13F | Bank Of Montreal /can/ | 383.495 | 16,73 | 6.128 | 48,67 | ||||
| 2026-02-13 | 13F | Police & Firemen's Retirement System of New Jersey | 28.388 | 17,22 | 454 | 49,50 | ||||
| 2026-01-26 | 13F | Main Street Group, LTD | 0 | -100,00 | 0 | |||||
| 2026-04-21 | 13F | Financial Consulate, Inc | 500 | 0,00 | 6 | -28,57 | ||||
| 2025-11-14 | 13F | Citadel Advisors Llc | 0 | -100,00 | 0 | -100,00 |
Other Listings
| US:IE | 14,38 $ |