Grundlæggende statistik
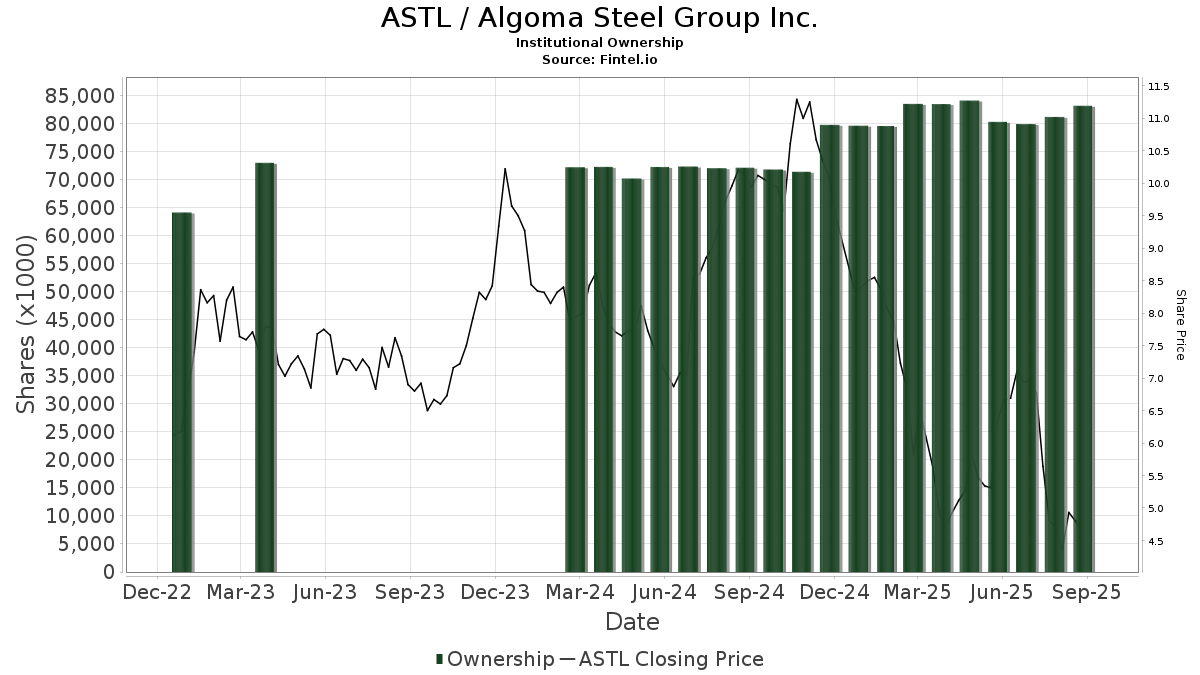
| Institutionelle aktier (lange) | 80.649.764 - 76,86% (ex 13D/G) - change of 0,42MM shares 0,52% MRQ |
| Institutionel værdi (lang) | $ 329.968 USD ($1000) |
Institutionelt ejerskab og aktionærer
Algoma Steel Group Inc. (US:ASTL) har 113 institutionelle ejere og aktionærer, der har indsendt 13D/G- eller 13F-formularer til Securities Exchange Commission (SEC). Disse institutioner har i alt 80,649,764 aktier. Største aktionærer omfatter Maple Rock Capital Partners Inc., MMCAP International Inc. SPC, BlackRock, Inc., Donald Smith & Co., Inc., Littlejohn & Co Llc, Scheer, Rowlett & Associates Investment Management Ltd., Goldentree Asset Management Lp, Connor, Clark & Lunn Investment Management Ltd., Fmr Llc, and Aegis Financial Corp .
Algoma Steel Group Inc. (NasdaqGM:ASTL) institutionel ejerskabsstruktur viser aktuelle positioner i virksomheden efter institutioner og fonde, samt seneste ændringer i positionsstørrelse. Større aktionærer kan omfatte individuelle investorer, investeringsforeninger, hedgefonde eller institutioner. Skema 13D angiver, at investoren besidder (eller besidder) mere end 5 % af virksomheden og har til hensigt (eller har til hensigt at) aktivt at forfølge en ændring i forretningsstrategi. Skema 13G indikerer en passiv investering på over 5%.
The share price as of April 24, 2026 is 4,52 / share. Previously, on April 25, 2025, the share price was 5,13 / share. This represents a decline of 11,89% over that period.
Fondens stemningsscore
Fund Sentiment Score (fka Ownership Accumulation Score) finder de aktier, der bliver mest købt af fonde. Det er resultatet af en sofistikeret, multi-faktor kvantitativ model, der identificerer virksomheder med de højeste niveauer af institutionel akkumulering. Scoringsmodellen bruger en kombination af den samlede stigning i oplyste ejere, ændringerne i porteføljeallokeringer i disse ejere og andre målinger. Tallet går fra 0 til 100, hvor højere tal indikerer et højere niveau af akkumulering for sine jævnaldrende, og 50 er gennemsnittet.
Opdateringsfrekvens: Dagligt
Se Ownership Explorer, som giver en liste over højest rangerende virksomheder.
AI+ Ask Fintel’s AI assistant about Algoma Steel Group Inc..
Select a question to share a public post with an AI-crafted answer.
Thinking of good questions…
Institutionel Put/Call-forhold
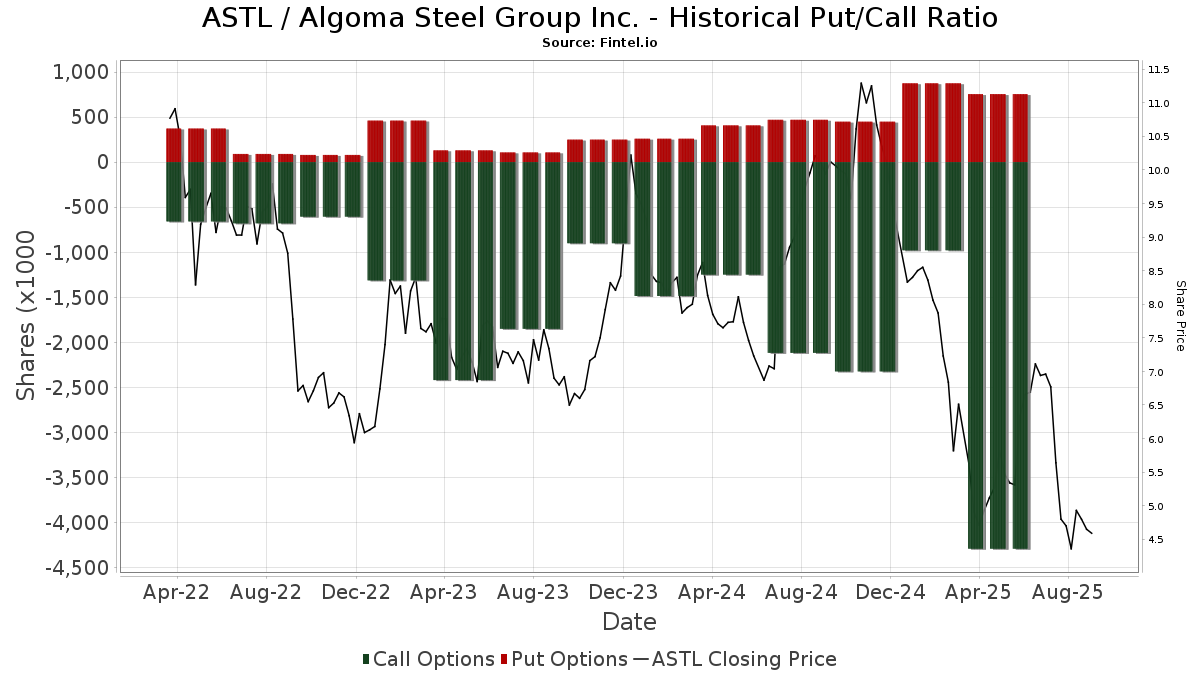
Ud over at indberette standardaktie- og gældsudstedelser skal institutter med mere end 100 mill. aktiver under forvaltning også oplyse deres put- og call-optionsbeholdninger. Da salgsoptioner generelt indikerer negativ stemning, og købsoptioner indikerer positiv stemning, kan vi få en fornemmelse af den overordnede institutionelle stemning ved at plotte forholdet mellem put og kald. Diagrammet til højre viser det historiske put/call-forhold for dette instrument.
Brug af Put/Call Ratio som en indikator for investorernes stemning overvinder en af de vigtigste mangler ved at bruge totalt institutionelt ejerskab, som er, at en betydelig mængde af aktiver under forvaltning investeres passivt for at spore indekser. Passivt forvaltede fonde køber typisk ikke optioner, så indikatoren for put/call-forholdet følger mere nøje følelsen af aktivt forvaltede fonde.
13D/G-arkivering
Vi præsenterer 13D/G ansøgninger separat fra 13F ansøgninger på grund af den forskellige behandling af SEC. 13D/G-ansøgninger kan indgives af grupper af investorer (med én ledende), hvorimod 13F-ansøgninger ikke kan. Dette resulterer i situationer, hvor en investor kan indsende en 13D/G, der rapporterer én værdi for de samlede aktier (der repræsenterer alle de aktier, der ejes af investorgruppen), men derefter indsender en 13F, der rapporterer en anden værdi for de samlede aktier (der udelukkende repræsenterer deres egne) ejendomsret). Det betyder, at aktieejerskab af 13D/G-arkiver og 13F-arkiveringer ofte ikke er direkte sammenlignelige, så vi præsenterer dem separat.
Bemærk: Fra den 16. maj 2021 viser vi ikke længere ejere, der ikke har indsendt en 13D/G inden for det seneste år. Tidligere viste vi den fulde historie af 13D/G-arkiver. Generelt skal enheder, der er forpligtet til at indgive 13D/G-ansøgninger, indgive mindst årligt, før de indsender en afsluttende ansøgning. Dog forlader fonde nogle gange positioner uden at indsende en afsluttende ansøgning (dvs. de afvikler), så visning af den fulde historie resulterede nogle gange i forvirring om det nuværende ejerskab. For at undgå forvirring viser vi nu kun 'aktuelle' ejere - det vil sige - ejere, der har anmeldt inden for det seneste år.
Upgrade to unlock premium data.
| Fil dato | Form | Investor | Forrige Aktier |
Seneste Aktier |
Δ Aktier (Procent) |
Ejendomsret (Procent) |
Δ Ejerskab (Procent) |
|
|---|---|---|---|---|---|---|---|---|
| 2026-02-17 | MMCAP International Inc. SPC | 10,532,553 | 11,487,861 | 9.07 | 10.90 | 9.00 | ||
| 2026-02-12 | DONALD SMITH & CO., INC. | 5,937,020 | 5,861,631 | -1.27 | 5.60 | -1.75 | ||
| 2025-11-07 | Maple Rock Capital Partners Inc. | 10,430,818 | 13,993,930 | 34.16 | 13.30 | 34.34 | ||
| 2025-09-23 | Zekelman Industries, Inc. | 5,229,988 | 3,229,998 | -38.24 | 3.08 | -38.65 | ||
| 2025-08-14 | Stoney Lonesome HF LP | 5,458,549 | 5,864,050 | 7.43 | 5.40 | 3.85 | ||
| 2025-04-29 | BlackRock, Inc. | 6,957,499 | 3,835,939 | -44.87 | 3.70 | -44.78 |
13F og NPORT arkivering
Detaljer om 13F-arkivering er gratis. Detaljer om NP-ansøgninger kræver et premium-medlemskab. Grønne rækker angiver nye positioner. Røde rækker angiver lukkede positioner. Klik på linket ikon for at se den fulde transaktionshistorik.
Opgrader
for at låse premium-data op og eksportere til Excel ![]() .
.
| Fil dato | Kilde | Investor | Type | Gennemsnitlig pris (Øst) |
Aktier | Δ Aktier (%) |
Rapporteret Værdi ($1000) |
Δ Værdi (%) |
Port Alloc (%) |
|
|---|---|---|---|---|---|---|---|---|---|---|
| 2026-02-13 | 13F | CDC Financial, Inc. | 1.580.749 | 6.481 | ||||||
| 2026-02-13 | 13F | Walleye Capital LLC | Put | 27.800 | -53,67 | 114 | -46,95 | |||
| 2026-02-13 | 13F | CDC Financial, Inc. | Call | 927.600 | 4.592 | |||||
| 2026-02-17 | 13F | Sig Brokerage, Lp | Put | 0 | -100,00 | 0 | ||||
| 2026-02-13 | 13F | Walleye Capital LLC | 537.234 | 92,59 | 2.203 | 122,20 | ||||
| 2026-02-13 | 13F | Walleye Capital LLC | Call | 70.500 | 121,70 | 289 | 155,75 | |||
| 2026-01-27 | 13F | Zurcher Kantonalbank (Zurich Cantonalbank) | 0 | -100,00 | 0 | |||||
| 2025-11-14 | 13F | Point72 Asia (Singapore) Pte. Ltd. | 3.600 | 13 | ||||||
| 2026-02-17 | 13F | Quadrature Capital Ltd | 1.018.100 | -33,42 | 4.195 | -22,86 | ||||
| 2025-11-13 | 13F | Eisler Capital Management Ltd. | 0 | -100,00 | 0 | -100,00 | ||||
| 2026-02-17 | 13F | AYAL Capital Advisors Ltd | 0 | -100,00 | 0 | |||||
| 2026-02-02 | 13F | Wolverine Asset Management Llc | Put | 105.600 | 0,00 | 433 | 15,20 | |||
| 2026-02-11 | 13F | Simplex Trading, Llc | 74.128 | 304 | ||||||
| 2026-02-11 | 13F | CLARET ASSET MANAGEMENT Corp | 30.375 | 0,00 | 0 | |||||
| 2026-02-17 | 13F | Trexquant Investment LP | 0 | -100,00 | 0 | |||||
| 2026-02-17 | 13F | Tower Research Capital LLC (TRC) | 2.337 | 221,46 | 10 | 350,00 | ||||
| 2026-02-11 | 13F | Donald Smith & Co., Inc. | 5.861.631 | -1,27 | 24.033 | 13,86 | ||||
| 2026-02-17 | 13F | Public Employees Retirement System Of Ohio | 0 | -100,00 | 0 | |||||
| 2026-02-17 | 13F | Solas Capital Management, LLC | 1.069.351 | -2,01 | 4.384 | 13,02 | ||||
| 2026-04-08 | 13F | Wealth Enhancement Advisory Services, Llc | 0 | -100,00 | 0 | |||||
| 2026-02-05 | 13F | Phoenix Holdings Ltd. | 35.714 | 0,00 | 146 | 15,87 | ||||
| 2026-02-13 | 13F | Bain Capital Credit, LP | 825.777 | -1,37 | 3.386 | 13,74 | ||||
| 2026-02-17 | 13F | Fmr Llc | 2.208.646 | -0,27 | 9.055 | 15,01 | ||||
| 2026-02-12 | 13F | Jane Street Group, Llc | 701.942 | -15,15 | 2.878 | -2,14 | ||||
| 2026-02-12 | 13F | Jane Street Group, Llc | Call | 204.000 | -7,36 | 836 | 6,91 | |||
| 2026-02-17 | 13F | Graham Capital Management, L.P. | 0 | -100,00 | 0 | |||||
| 2025-11-14 | 13F | Peak6 Llc | 0 | -100,00 | 0 | -100,00 | ||||
| 2026-02-17 | 13F | Two Sigma Securities, Llc | 10.274 | 42 | ||||||
| 2026-03-03 | 13F/A | Caitong International Asset Management Co., Ltd | 166 | -97,09 | 1 | -100,00 | ||||
| 2026-02-11 | 13F | Group One Trading, L.p. | 103.187 | 248,33 | 423 | 302,86 | ||||
| 2026-01-29 | 13F | Vanguard Group Inc | 0 | -100,00 | 0 | -100,00 | ||||
| 2025-11-14 | 13F | Peak6 Llc | Put | 0 | -100,00 | 0 | -100,00 | |||
| 2026-02-17 | 13F | Nomura Holdings Inc | 84.567 | 83,84 | 347 | 112,27 | ||||
| 2026-02-17 | 13F | Nomura Holdings Inc | Call | 39.900 | 164 | |||||
| 2026-02-17 | 13F | Russell Investments Group, Ltd. | 401.490 | 5,49 | 1.646 | 21,75 | ||||
| 2026-02-17 | 13F | Nomura Holdings Inc | Put | 133.800 | 549 | |||||
| 2026-01-08 | 13F | Ulland Investment Advisors, LLC | 1.000 | 0,00 | 0 | |||||
| 2026-02-11 | 13F | Heartland Advisors Inc | 0 | -100,00 | 0 | |||||
| 2026-02-17 | 13F | Susquehanna International Group, Llp | Put | 364.600 | 11,57 | 1.495 | 28,46 | |||
| 2026-02-17 | 13F | Lighthouse Investment Partners, LLC | 75.708 | 242,74 | 310 | 297,44 | ||||
| 2026-02-17 | 13F | Susquehanna International Group, Llp | Call | 209.000 | 39,52 | 857 | 60,60 | |||
| 2026-02-12 | 13F | Swiss National Bank | 0 | -100,00 | 0 | -100,00 | ||||
| 2026-02-17 | 13F | Susquehanna International Group, Llp | 64.380 | -56,26 | 264 | -49,71 | ||||
| 2026-01-16 | 13F | Empirical Financial Services, LLC d.b.a. Empirical Wealth Management | 21.773 | 0,00 | 89 | 15,58 | ||||
| 2025-11-14 | 13F | AYAL Capital Advisors Ltd | Call | 0 | -100,00 | 0 | -100,00 | |||
| 2026-02-13 | 13F | Verition Fund Management LLC | 1.248.802 | 5.120 | ||||||
| 2026-02-17 | 13F | Toronto Dominion Bank | 10.060 | -93,93 | 41 | 57,69 | ||||
| 2026-02-17 | 13F | Toronto Dominion Bank | Put | 10.000 | 41 | |||||
| 2026-02-17 | 13F | Aquatic Capital Management LLC | 8.809 | 36 | ||||||
| 2026-02-10 | 13F | CIBC World Markets Inc. | 32.425 | -51,10 | 133 | -43,83 | ||||
| 2026-02-17 | 13F | D. E. Shaw & Co., Inc. | 523.258 | -9,54 | 2.148 | 4,58 | ||||
| 2026-02-12 | 13F | Senvest Management, LLC | 85.789 | -68,81 | 352 | -64,07 | ||||
| 2026-02-17 | 13F | D. E. Shaw & Co., Inc. | Put | 19.200 | 79 | |||||
| 2026-02-10 | 13F | Quantbot Technologies LP | 127.847 | -32,21 | 524 | -21,79 | ||||
| 2025-10-28 | 13F | Campbell & CO Investment Adviser LLC | 0 | -100,00 | 0 | |||||
| 2026-02-13 | 13F | Contrarian Capital Management, L.l.c. | 0 | -100,00 | 0 | |||||
| 2026-02-17 | 13F | Prelude Capital Management, Llc | 0 | -100,00 | 0 | |||||
| 2026-02-06 | 13F | Gsa Capital Partners Llp | 42.489 | 0 | ||||||
| 2025-10-29 | 13F | AMH Equity Ltd | 0 | -100,00 | 0 | |||||
| 2025-11-13 | 13F | Wolf Hill Capital Management, LP | 0 | -100,00 | 0 | |||||
| 2026-02-12 | 13F | Aegis Financial Corp | 1.786.122 | 0,00 | 7.323 | 15,34 | ||||
| 2026-02-17 | 13F | Readystate Asset Management Lp | 640.324 | 0,00 | 2.625 | 15,33 | ||||
| 2026-02-11 | 13F | Littlejohn & Co Llc | 3.446.503 | 27,94 | 14.131 | 47,56 | ||||
| 2026-02-17 | 13F | Caption Management, LLC | Call | 224.500 | 0,00 | 920 | 15,29 | |||
| 2026-02-18 | 13F | GWM Advisors LLC | 28.299 | 0,00 | 116 | 16,00 | ||||
| 2026-02-17 | 13F | Caption Management, LLC | 7.456 | 31 | ||||||
| 2026-02-19 | 13F | CI Private Wealth, LLC | 15.000 | 0,00 | 62 | 15,09 | ||||
| 2026-02-17 | 13F | Caption Management, LLC | Put | 135.000 | 32,09 | 554 | 52,34 | |||
| 2026-02-17 | 13F | Royal Bank Of Canada | 145.596 | -72,68 | 597 | -68,50 | ||||
| 2026-02-11 | 13F | Deutsche Bank Ag\ | 0 | -100,00 | 0 | |||||
| 2026-02-09 | 13F | MMCAP International Inc. SPC | 11.487.861 | 42,20 | 47.111 | 64,03 | ||||
| 2026-02-17 | 13F | Two Sigma Advisers, Lp | 73.600 | 302 | ||||||
| 2026-02-13 | 13F | General American Investors Co Inc | 0 | -100,00 | 0 | |||||
| 2026-02-06 | 13F | Prescott Group Capital Management, L.l.c. | 231.219 | 948 | ||||||
| 2025-11-14 | 13F | Ubs Asset Management Americas Inc | 0 | -100,00 | 0 | -100,00 | ||||
| 2025-11-13 | 13F | Dynamic Technology Lab Private Ltd | 0 | -100,00 | 0 | |||||
| 2026-02-17 | 13F | Citadel Advisors Llc | Put | 244.200 | -17,89 | 1.001 | -5,30 | |||
| 2026-02-12 | 13F | Bank Of Montreal /can/ | 203.916 | 7,26 | 839 | 24,11 | ||||
| 2026-02-17 | 13F | Citadel Advisors Llc | 622.404 | 6,51 | 2.552 | 22,82 | ||||
| 2026-02-18 | 13F | Mackenzie Financial Corp | 94.776 | 74,34 | 384 | 99,48 | ||||
| 2026-02-13 | 13F | Squarepoint Ops LLC | 0 | -100,00 | 0 | |||||
| 2026-02-17 | 13F | Citadel Advisors Llc | Call | 114.700 | -39,12 | 470 | -29,75 | |||
| 2025-11-03 | 13F | TD Waterhouse Canada Inc. | 0 | -100,00 | 0 | -100,00 | ||||
| 2026-02-02 | 13F | Wolverine Asset Management Llc | 72.143 | 31,69 | 296 | 52,06 | ||||
| 2025-11-14 | 13F | Cubist Systematic Strategies, LLC | 464.682 | 1.651 | ||||||
| 2026-01-29 | 13F | Pictet Asset Management Holding SA | 0 | -100,00 | 0 | |||||
| 2026-02-17 | 13F | PDT Partners, LLC | 78.804 | 31,36 | 323 | 51,64 | ||||
| 2026-02-10 | 13F | Clear Harbor Asset Management, LLC | 26.000 | 107 | ||||||
| 2026-02-17 | 13F | SIG North Trading, ULC | 101.917 | -28,19 | 418 | -17,26 | ||||
| 2026-02-17 | 13F | Goldentree Asset Management Lp | 2.493.548 | 0,00 | 10.224 | 15,33 | ||||
| 2025-11-10 | 13F | Clayton Partners LLC | 0 | -100,00 | 0 | -100,00 | ||||
| 2026-04-21 | 13F | PharVision Advisers, LLC | 0 | -100,00 | 0 | |||||
| 2026-02-13 | 13F | Morgan Stanley | 1.040.539 | -19,47 | 4.266 | -7,12 | ||||
| 2026-01-29 | 13F | UBS Group AG | 944.764 | 64,74 | 3.874 | 90,04 | ||||
| 2026-02-12 | 13F | Federation des caisses Desjardins du Quebec | 17.860 | 101,58 | 73 | 135,48 | ||||
| 2026-02-11 | 13F | LPL Financial LLC | 62.194 | 5,60 | 255 | 21,53 | ||||
| 2025-11-10 | 13F | Towle & Co | 0 | -100,00 | 0 | -100,00 | ||||
| 2026-02-12 | 13F | Amitell Capital Pte Ltd | 0 | -100,00 | 0 | |||||
| 2026-02-17 | 13F | Bank Of America Corp /de/ | 522.357 | 92,04 | 2.142 | 121,64 | ||||
| 2025-10-31 | 13F | Intact Investment Management Inc. | 0 | -100,00 | 0 | |||||
| 2026-04-20 | 13F | Assenagon Asset Management S.A. | 99.107 | 409 | ||||||
| 2025-11-21 | 13F/A | Royal Bank Of Canada | Call | 0 | -100,00 | 0 | -100,00 | |||
| 2026-03-11 | 13F | Leonteq Securities AG | 0 | -100,00 | 0 | |||||
| 2026-02-13 | 13F | American Century Companies Inc | 69.172 | 79,09 | 285 | 107,30 | ||||
| 2026-02-13 | 13F | HITE Hedge Asset Management LLC | 0 | -100,00 | 0 | |||||
| 2026-02-17 | 13F | SIG North Trading, ULC | Put | 99.400 | -36,61 | 408 | -27,06 | |||
| 2026-02-17 | 13F | SIG North Trading, ULC | Call | 154.400 | 21,00 | 633 | 39,43 | |||
| 2025-11-12 | 13F | Robotti Robert | 0 | -100,00 | 0 | -100,00 | ||||
| 2026-02-09 | 13F | Legal & General Group Plc | 33.330 | -62,37 | 137 | -62,15 | ||||
| 2025-11-14 | 13F | Raymond James Financial Inc | 0 | -100,00 | 0 | |||||
| 2026-02-17 | 13F | Point72 Asset Management, L.P. | 0 | -100,00 | 0 | |||||
| 2026-02-12 | 13F | Renaissance Technologies Llc | 0 | -100,00 | 0 | |||||
| 2026-04-02 | 13F | Marex Group plc | 72.167 | 0,00 | 391 | -44,54 | ||||
| 2026-02-13 | 13F | Quarry LP | 2.426 | 10 | ||||||
| 2026-02-10 | 13F | Td Asset Management Inc | 1.687.420 | 1.351,72 | 6.955 | 1.588,11 | ||||
| 2026-02-13 | 13F | Walleye Trading LLC | 16.374 | 67 | ||||||
| 2026-02-11 | 13F | CenterBook Partners LP | 398.845 | 1.635 | ||||||
| 2026-02-13 | 13F | Walleye Trading LLC | Put | 13.700 | 37,00 | 56 | 60,00 | |||
| 2026-02-13 | 13F | Walleye Trading LLC | Call | 31.000 | 133,08 | 127 | 170,21 | |||
| 2026-02-17 | 13F | Alliancebernstein L.p. | 0 | -100,00 | 0 | |||||
| 2026-02-10 | 13F | Bnp Paribas Arbitrage, Sa | 114.101 | 0,09 | 468 | 15,31 | ||||
| 2026-02-13 | 13F | NewGen Asset Management Ltd | 0 | -100,00 | 0 | |||||
| 2026-02-13 | 13F | Boston Partners | 68.598 | 28,41 | 281 | 48,68 | ||||
| 2026-02-09 | 13F | Geode Capital Management, Llc | 63.813 | 0,00 | 262 | 15,49 | ||||
| 2025-11-13 | 13F | Arrowstreet Capital, Limited Partnership | 0 | -100,00 | 0 | -100,00 | ||||
| 2026-02-17 | 13F | Advisor Group Holdings, Inc. | 167 | 0,00 | 1 | |||||
| 2026-02-17 | 13F | Tcw Group Inc | 672.678 | 0,00 | 2.758 | 15,31 | ||||
| 2026-02-13 | 13F | LM Asset (IM) Inc. | 1.470.000 | 27,83 | 6.027 | 47,43 | ||||
| 2025-11-14 | 13F | Wolverine Trading, Llc | Call | 27.600 | 113 | |||||
| 2025-11-14 | 13F | Wolverine Trading, Llc | Put | 50.900 | 208 | |||||
| 2026-02-19 | 13F | Invesco Ltd. | 66.713 | 27,56 | 274 | 47,57 | ||||
| 2026-01-14 | 13F | Net Worth Advisory Group | 23.643 | -3,09 | 97 | 11,63 | ||||
| 2025-11-12 | 13F | Neuberger Berman Group LLC | 0 | -100,00 | 0 | |||||
| 2026-02-13 | 13F | Barclays Plc | 46.246 | 12.432,79 | 190 | 18.800,00 | ||||
| 2026-03-06 | 13F | Hsbc Holdings Plc | 38.754 | 243,66 | 159 | 305,13 | ||||
| 2026-02-17 | 13F | ExodusPoint Capital Management, LP | 0 | -100,00 | 0 | -100,00 | ||||
| 2026-02-17 | 13F | Oxford Asset Management Llp | 0 | -100,00 | 0 | -100,00 | ||||
| 2025-11-07 | 13F | Fifth Third Bancorp | 0 | -100,00 | 0 | |||||
| 2026-02-12 | 13F | BlackRock, Inc. | 8.501.903 | 15,94 | 34.858 | 33,71 | ||||
| 2026-02-10 | 13F | Connor, Clark & Lunn Investment Management Ltd. | 2.264.863 | 9.323 | ||||||
| 2025-11-14 | 13F | Squarepoint Ops LLC | Put | 0 | -100,00 | 0 | -100,00 | |||
| 2025-11-14 | 13F | Squarepoint Ops LLC | Call | 0 | -100,00 | 0 | -100,00 | |||
| 2026-02-11 | 13F | Allianz Asset Management GmbH | 21.822 | 90 | ||||||
| 2026-04-08 | 13F | Arlington Trust Co LLC | 100 | 0,00 | 0 | |||||
| 2025-11-14 | 13F | Thomist Capital Management, LP | Call | 0 | -100,00 | 0 | -100,00 | |||
| 2026-02-12 | 13F | Summit Financial, LLC | 110.333 | 0,00 | 452 | 15,31 | ||||
| 2026-02-10 | 13F | Acadian Asset Management Llc | 19.400 | -69,06 | 0 | |||||
| 2025-11-14 | 13F | Susquehanna Advisors Group, Inc. | 0 | -100,00 | 0 | |||||
| 2026-02-17 | 13F | Orion Resource Partners LP | 381.728 | 173,82 | 1.571 | 218,02 | ||||
| 2026-02-13 | 13F | Victory Capital Management Inc | 11.079 | 2,06 | 45 | 18,42 | ||||
| 2025-11-04 | 13F | Mutual Advisors, LLC | 0 | -100,00 | 0 | |||||
| 2026-02-13 | 13F | JustInvest LLC | 10.798 | 44 | ||||||
| 2026-02-13 | 13F | Invesco Senior Secured Management Inc /adv This fund is a listed as child fund of Invesco Ltd. and if that institution has disclosed ownership in this security, then these positions will not be double counted when calculating total shares and total value | 0 | -100,00 | 0 | |||||
| 2026-02-13 | 13F | Citigroup Inc | 7.120 | 109,54 | 29 | 141,67 | ||||
| 2025-11-13 | 13F | WealthCollab, LLC | 0 | -100,00 | 0 | -100,00 | ||||
| 2026-02-03 | 13F | SBI Securities Co., Ltd. | 101 | 94,23 | 0 | |||||
| 2025-11-13 | 13F | NewGen Equity Long/Short Fund | 246.097 | 1.026 | ||||||
| 2026-02-10 | 13F | Basepoint Wealth LLC | 51 | 0 | ||||||
| 2025-11-14 | 13F | Adage Capital Partners Gp, L.l.c. | 0 | -100,00 | 0 | -100,00 | ||||
| 2026-02-13 | 13F/A | Alberta Investment Management Corp | 0 | -100,00 | 0 | -100,00 | ||||
| 2026-02-17 | 13F | XTX Topco Ltd | 143.704 | 15,82 | 589 | 33,56 | ||||
| 2026-01-28 | 13F | DekaBank Deutsche Girozentrale | 21.188 | 0,00 | 0 | |||||
| 2025-11-14 | 13F | Skopos Labs, Inc. | 0 | -100,00 | 0 | -100,00 | ||||
| 2026-02-13 | 13F | Element Pointe Advisors, Llc | 10.000 | 41 | ||||||
| 2025-11-14 | 13F | Engineers Gate Manager LP | 0 | -100,00 | 0 | |||||
| 2026-02-10 | 13F | Goldman Sachs Group Inc | 155.250 | -27,94 | 637 | -16,86 | ||||
| 2025-11-07 | 13F | Shell Asset Management Co | 1.279 | -69,50 | 0 | |||||
| 2026-02-17 | 13F | Tudor Investment Corp Et Al | Call | 0 | -100,00 | 0 | -100,00 | |||
| 2026-02-12 | 13F | Nuveen, LLC | 0 | -100,00 | 0 | |||||
| 2026-02-13 | 13F | National Bank Of Canada /fi/ | 17.575 | 49,70 | 72 | 73,17 | ||||
| 2026-02-13 | 13F | Charles Schwab Investment Management Inc | 702.734 | 37,75 | 2.897 | 59,91 | ||||
| 2026-02-13 | 13F | Quinn Opportunity Partners LLC | 142.336 | 0,00 | 584 | 15,22 | ||||
| 2025-11-12 | 13F | Gamco Investors, Inc. Et Al | 0 | -100,00 | 0 | -100,00 | ||||
| 2025-11-26 | 13F/A | Jpmorgan Chase & Co | 0 | -100,00 | 0 | -100,00 | ||||
| 2026-04-15 | 13F | FNY Investment Advisers, LLC | 65.288 | -24,08 | 0 | |||||
| 2026-04-15 | 13F | FNY Investment Advisers, LLC | Call | 5.607 | 67,37 | 0 | ||||
| 2026-02-09 | 13F | Terril Brothers, Inc. | 58.000 | 39,76 | 238 | 61,22 | ||||
| 2026-02-13 | 13F | Centiva Capital, LP | 0 | -100,00 | 0 | |||||
| 2026-02-17 | 13F | Aristeia Capital Llc | 120.260 | -86,72 | 493 | 257,25 | ||||
| 2026-02-17 | 13F | Jump Financial, LLC | 14.201 | -96,03 | 58 | -95,44 | ||||
| 2026-02-17 | 13F | Ewing Morris & Co. Investment Partners Ltd. | 612.500 | 25,00 | 2.556 | 46,92 | ||||
| 2026-02-17 | 13F | FIL Ltd | 20.570 | 85 | ||||||
| 2026-02-17 | 13F | Keebeck Alpha, LP | 0 | -100,00 | 0 | |||||
| 2026-02-17 | 13F | Voleon Capital Management Lp | 40.086 | 164 | ||||||
| 2026-02-13 | 13F | Van Eck Associates Corp | 0 | -100,00 | 0 | |||||
| 2026-01-29 | 13F | IMC-Chicago, LLC | 0 | -100,00 | 0 | |||||
| 2026-02-13 | 13F | Jb Capital Partners Lp | 872.277 | -12,08 | 3.576 | 1,25 | ||||
| 2026-02-17 | 13F | EJF Capital LLC | 11.000 | 0,00 | 45 | 15,38 | ||||
| 2026-02-17 | 13F | Moore Capital Management, Lp | 0 | -100,00 | 0 | |||||
| 2026-02-10 | 13F | Scheer, Rowlett & Associates Investment Management Ltd. | 3.336.525 | -12,86 | 13.735 | 1,07 | ||||
| 2026-02-13 | 13F | Wells Fargo & Company/mn | 0 | -100,00 | 0 | |||||
| 2025-10-31 | 13F | Y-Intercept (Hong Kong) Ltd | 0 | -100,00 | 0 | |||||
| 2026-02-17 | 13F | J. Goldman & Co LP | Call | 0 | -100,00 | 0 | ||||
| 2026-02-06 | 13F | Pnc Financial Services Group, Inc. | 243 | 1 | ||||||
| 2026-02-17 | 13F | J. Goldman & Co LP | 0 | -100,00 | 0 | |||||
| 2026-02-06 | 13F | Larson Financial Group LLC | 11 | 0 | ||||||
| 2025-11-14 | 13F | Empyrean Capital Partners, LP | 0 | -100,00 | 0 | |||||
| 2026-02-12 | 13F | Dimensional Fund Advisors Lp | 383.587 | -23,29 | 1.573 | -11,73 | ||||
| 2026-02-17 | 13F | Maple Rock Capital Partners Inc. | 14.430.818 | 38,35 | 59.166 | 59,56 | ||||
| 2026-02-17 | 13F | Millennium Management Llc | Put | 112.400 | -41,18 | 461 | -32,25 | |||
| 2026-02-17 | 13F | Millennium Management Llc | 596.960 | -15,25 | 2.453 | -1,92 | ||||
| 2026-02-13 | 13F | Aviso Financial Inc. | 0 | -100,00 | 0 | |||||
| 2026-02-17 | 13F | Bracebridge Capital, LLC | 924.931 | 0,00 | 3.792 | 15,33 | ||||
| 2026-02-17 | 13F | PenderFund Capital Management Ltd. | 50.000 | 206 | ||||||
| 2025-12-01 | 13F/A | Polar Asset Management Partners Inc. | 0 | -100,00 | 0 | -100,00 | ||||
| 2025-11-14 | 13F | SummitTX Capital, L.P. | 0 | -100,00 | 0 |