Grundlæggende statistik
| Institutionelle aktier (lange) | 275.633.791 - 92,48% (ex 13D/G) - change of -53,36MM shares -16,22% MRQ |
| Institutionel værdi (lang) | $ 2.643.388 USD ($1000) |
Institutionelt ejerskab og aktionærer
ZoomInfo Technologies Inc. (US:ZI) har 361 institutionelle ejere og aktionærer, der har indsendt 13D/G- eller 13F-formularer til Securities Exchange Commission (SEC). Disse institutioner har i alt 275,633,791 aktier. Største aktionærer omfatter Vanguard Group Inc, BlackRock, Inc., Fmr Llc, Glenview Capital Management, Llc, Sachem Head Capital Management LP, Dimensional Fund Advisors Lp, Greenhouse Funds LLLP, Lsv Asset Management, RPD Fund Management LLC, and Jpmorgan Chase & Co .
ZoomInfo Technologies Inc. (NasdaqGS:ZI) institutionel ejerskabsstruktur viser aktuelle positioner i virksomheden efter institutioner og fonde, samt seneste ændringer i positionsstørrelse. Større aktionærer kan omfatte individuelle investorer, investeringsforeninger, hedgefonde eller institutioner. Skema 13D angiver, at investoren besidder (eller besidder) mere end 5 % af virksomheden og har til hensigt (eller har til hensigt at) aktivt at forfølge en ændring i forretningsstrategi. Skema 13G indikerer en passiv investering på over 5%.
The share price as of May 12, 2025 is 10,31 / share. Previously, on April 29, 2025, the share price was 8,70 / share. This represents an increase of 18,51% over that period.

Fondens stemningsscore
Fund Sentiment Score (fka Ownership Accumulation Score) finder de aktier, der bliver mest købt af fonde. Det er resultatet af en sofistikeret, multi-faktor kvantitativ model, der identificerer virksomheder med de højeste niveauer af institutionel akkumulering. Scoringsmodellen bruger en kombination af den samlede stigning i oplyste ejere, ændringerne i porteføljeallokeringer i disse ejere og andre målinger. Tallet går fra 0 til 100, hvor højere tal indikerer et højere niveau af akkumulering for sine jævnaldrende, og 50 er gennemsnittet.
Opdateringsfrekvens: Dagligt
Se Ownership Explorer, som giver en liste over højest rangerende virksomheder.
AI+ Ask Fintel’s AI assistant about ZoomInfo Technologies Inc..
Select a question to share a public post with an AI-crafted answer.
Thinking of good questions…
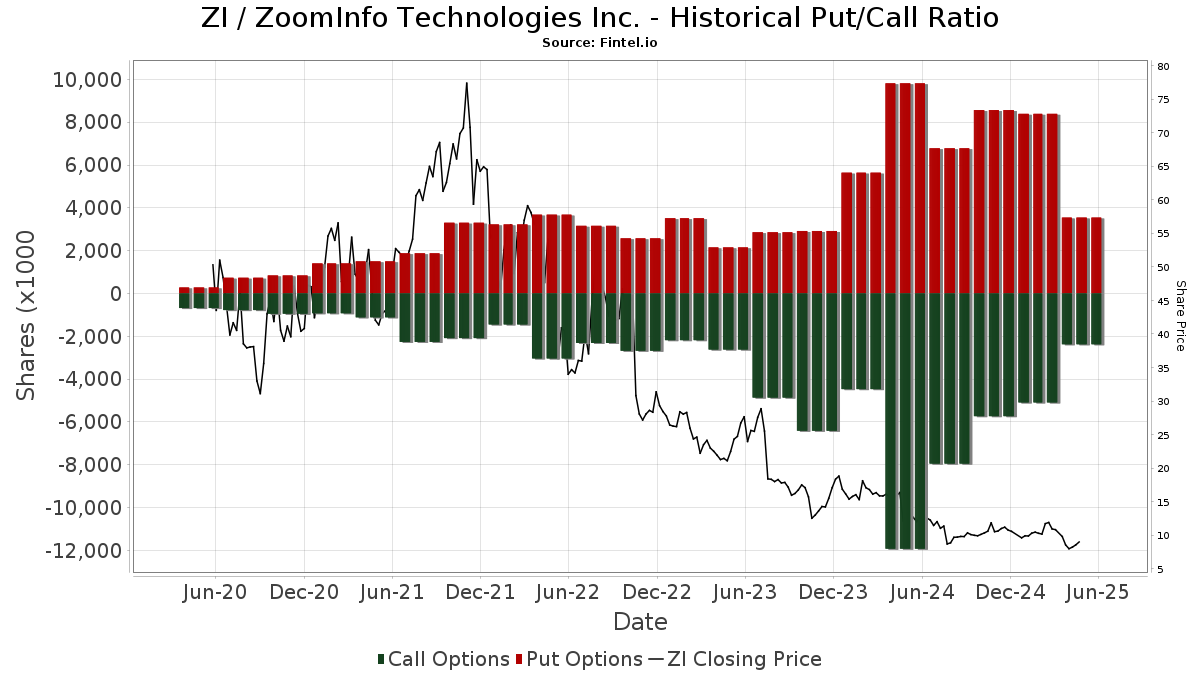
Institutionel Put/Call-forhold
Ud over at indberette standardaktie- og gældsudstedelser skal institutter med mere end 100 mill. aktiver under forvaltning også oplyse deres put- og call-optionsbeholdninger. Da salgsoptioner generelt indikerer negativ stemning, og købsoptioner indikerer positiv stemning, kan vi få en fornemmelse af den overordnede institutionelle stemning ved at plotte forholdet mellem put og kald. Diagrammet til højre viser det historiske put/call-forhold for dette instrument.
Brug af Put/Call Ratio som en indikator for investorernes stemning overvinder en af de vigtigste mangler ved at bruge totalt institutionelt ejerskab, som er, at en betydelig mængde af aktiver under forvaltning investeres passivt for at spore indekser. Passivt forvaltede fonde køber typisk ikke optioner, så indikatoren for put/call-forholdet følger mere nøje følelsen af aktivt forvaltede fonde.
13F og NPORT arkivering
Detaljer om 13F-arkivering er gratis. Detaljer om NP-ansøgninger kræver et premium-medlemskab. Grønne rækker angiver nye positioner. Røde rækker angiver lukkede positioner. Klik på linket ikon for at se den fulde transaktionshistorik.
Opgrader
for at låse premium-data op og eksportere til Excel ![]() .
.
| Fil dato | Kilde | Investor | Type | Gennemsnitlig pris (Øst) |
Aktier | Δ Aktier (%) |
Rapporteret Værdi ($1000) |
Δ Værdi (%) |
Port Alloc (%) |
|
|---|---|---|---|---|---|---|---|---|---|---|
| 2026-02-17 | 13F | Redwood Investment Management, Llc | 109.564 | 1 | ||||||
| 2025-11-04 | 13F | Guerra Advisors Inc | 65 | 1 | ||||||
| 2026-02-10 | 13F | Operose Advisors LLC | 217 | 0,00 | 2 | 0,00 | ||||
| 2026-04-23 | 13F | Farmers & Merchants Investments Inc | 240 | 0,00 | 1 | -50,00 | ||||
| 2026-02-12 | 13F | State Board Of Administration Of Florida Retirement System | 242.259 | 0,54 | 2.464 | -6,28 | ||||
| 2026-02-13 | 13F | Police & Firemen's Retirement System of New Jersey | 117.547 | -10,05 | 1.195 | -16,14 | ||||
| 2026-02-12 | 13F | Hrt Financial Lp | 47.780 | 0 | ||||||
| 2026-02-17 | 13F | Sender Co & Partners, Inc. | 0 | -100,00 | 0 | |||||
| 2026-02-12 | 13F | New York State Common Retirement Fund | 134.860 | 0,00 | 1.372 | -6,80 | ||||
| 2026-02-13 | 13F | Pinnacle Wealth Planning Services, Inc. | 242 | 2 | ||||||
| 2026-02-12 | 13F | Ensign Peak Advisors, Inc | 25.901 | -65,40 | 263 | -67,77 | ||||
| 2026-02-17 | 13F | Kemnay Advisory Services Inc. | 11.085 | 113 | ||||||
| 2025-11-13 | 13F | UBS Group AG | Call | 0 | -100,00 | 0 | -100,00 | |||
| 2026-02-13 | 13F | Great West Life Assurance Co /can/ | 160.923 | -19,56 | 2 | -50,00 | ||||
| 2026-04-08 | 13F | DiNuzzo Private Wealth, Inc. | 6 | -68,42 | 0 | |||||
| 2026-01-30 | 13F/A | M&t Bank Corp | 15.429 | 7,49 | 157 | 0,64 | ||||
| 2026-02-19 | 13F | Invesco Ltd. | 1.272.459 | 18,80 | 12.941 | 10,74 | ||||
| 2026-02-06 | 13F | Global Retirement Partners, LLC | 2.513 | 1.021,88 | 26 | 1.150,00 | ||||
| 2026-01-28 | 13F | Arizona State Retirement System | 76.096 | -7,97 | 774 | -14,30 | ||||
| 2026-02-17 | 13F | California State Teachers Retirement System | 254.191 | -4,06 | 2.585 | -10,55 | ||||
| 2026-04-15 | 13F | QTR Family Wealth, LLC | 11.226 | 65 | ||||||
| 2026-01-28 | 13F | CAPROCK Group, Inc. | 109.763 | -21,24 | 1.116 | -26,53 | ||||
| 2026-02-12 | 13F | Aristides Capital LLC | 0 | -100,00 | 0 | |||||
| 2026-02-13 | 13F | Bridgewater Associates, LP | 1.921.205 | 17,09 | 19.539 | 9,14 | ||||
| 2025-11-13 | 13F | Qsemble Capital Management, LP | 0 | -100,00 | 0 | |||||
| 2026-04-08 | 13F | NorthCrest Asset Manangement, LLC | 16.947 | 98 | ||||||
| 2026-02-17 | 13F | Css Llc/il | 10.040 | 102 | ||||||
| 2026-02-11 | 13F | Waddell & Associates, Llc | 12.472 | -8,80 | 127 | -15,44 | ||||
| 2026-02-02 | 13F | Danske Bank A/s | 1.800 | 18 | ||||||
| 2026-02-09 | 13F | Jefferies Financial Group Inc. | 0 | -100,00 | 0 | |||||
| 2026-02-18 | 13F | State of Tennessee, Treasury Department | 105.381 | -4,11 | 848 | -29,22 | ||||
| 2026-02-06 | 13F | Pnc Financial Services Group, Inc. | 15.190 | 10,80 | 154 | 3,36 | ||||
| 2026-02-10 | 13F | State of Wyoming | 80.320 | 78,35 | 817 | 66,19 | ||||
| 2026-02-06 | 13F | Covestor Ltd | 3.341 | 95,49 | 0 | |||||
| 2026-02-17 | 13F | Point72 Asset Management, L.P. | Call | 24.200 | 246 | |||||
| 2026-02-17 | 13F | Point72 Asset Management, L.P. | 1.026.214 | -75,26 | 10.437 | -76,94 | ||||
| 2026-02-13 | 13F | Pathstone Holdings, LLC | 0 | -100,00 | 0 | |||||
| 2025-11-14 | 13F | Clearfield Capital Management Lp | 0 | -100,00 | 0 | |||||
| 2026-02-05 | 13F | Mission Wealth Management, Lp | 34.802 | -4,96 | 354 | -11,53 | ||||
| 2026-02-10 | 13F | Norges Bank | 3.090.263 | 31.428 | ||||||
| 2026-02-13 | 13F | Caxton Associates Llp | 0 | -100,00 | 0 | |||||
| 2025-11-12 | 13F | Andra AP-fonden | 0 | -100,00 | 0 | |||||
| 2026-02-11 | 13F | Brand Asset Management Group, Inc. | 10.071 | 102 | ||||||
| 2025-11-13 | 13F | Blueshift Asset Management, LLC | 0 | -100,00 | 0 | -100,00 | ||||
| 2026-02-11 | 13F | Buckingham Strategic Partners | 16.226 | -59,78 | 165 | -61,54 | ||||
| 2026-02-13 | 13F | Schroder Investment Management Group | 200.768 | 5,69 | 2.014 | -8,71 | ||||
| 2026-01-28 | 13F | Klp Kapitalforvaltning As | 57.600 | -6,04 | 586 | -12,43 | ||||
| 2026-02-10 | 13F | Rothschild Investment Llc | 12 | 0,00 | 0 | |||||
| 2026-02-12 | 13F | Steward Partners Investment Advisory, Llc | 56 | -94,70 | 1 | -100,00 | ||||
| 2026-02-17 | 13F | Price T Rowe Associates Inc /md/ | 241.297 | -91,48 | 2 | -93,33 | ||||
| 2026-02-17 | 13F | Susquehanna International Group, Llp | 196.772 | -59,67 | 2.001 | -62,41 | ||||
| 2026-02-17 | 13F | Susquehanna International Group, Llp | Put | 97.500 | -90,55 | 992 | -91,20 | |||
| 2025-11-14 | 13F | Point72 Asia (Singapore) Pte. Ltd. | 0 | -100,00 | 0 | |||||
| 2026-02-17 | 13F | Susquehanna International Group, Llp | Call | 327.300 | -52,34 | 3.329 | -55,57 | |||
| 2026-02-04 | 13F | Plato Investment Management Ltd | 273 | 0,00 | 3 | 0,00 | ||||
| 2026-02-17 | 13F | Russell Investments Group, Ltd. | 22.399 | -12,78 | 228 | -18,93 | ||||
| 2026-02-17 | 13F | D. E. Shaw & Co., Inc. | 0 | -100,00 | 0 | |||||
| 2026-02-14 | 13F | Rockefeller Capital Management L.P. | 487 | -58,05 | 5 | -66,67 | ||||
| 2026-02-13 | 13F | Marshall Wace, Llp | 0 | -100,00 | 0 | |||||
| 2026-02-12 | 13F | SWAN Capital LLC | 100 | 0,00 | 1 | 0,00 | ||||
| 2026-02-11 | 13F | Simplex Trading, Llc | 0 | -100,00 | 0 | -100,00 | ||||
| 2026-04-24 | 13F | ProShare Advisors LLC | 0 | -100,00 | 0 | |||||
| 2026-02-06 | 13F | Bare Financial Services, Inc | 123 | 17,14 | 1 | 0,00 | ||||
| 2026-02-17 | 13F/A | RBF Capital, LLC | 30.000 | 0,00 | 305 | -6,73 | ||||
| 2026-01-28 | 13F | Teacher Retirement System Of Texas | 79.179 | -23,42 | 805 | -28,63 | ||||
| 2026-04-06 | 13F | Versant Capital Management, Inc | 21.006 | 374,60 | 126 | 177,78 | ||||
| 2026-02-13 | 13F | Mariner, LLC | 0 | -100,00 | 0 | |||||
| 2026-02-17 | 13F | Brevan Howard Capital Management LP | 80.916 | 75,30 | 823 | 63,42 | ||||
| 2026-02-17 | 13F | Bank Of America Corp /de/ | Call | 0 | -100,00 | 0 | ||||
| 2026-02-03 | 13F | Sequoia Financial Advisors, LLC | 20.288 | 65,54 | 206 | 54,89 | ||||
| 2026-04-14 | 13F | Bay Harbor Wealth Management, LLC | 3 | -57,14 | 0 | |||||
| 2025-11-14 | 13F | Axa S.a. | 0 | -100,00 | 0 | |||||
| 2025-11-12 | 13F | CIBC Bancorp USA Inc. | 496.712 | 5.419 | ||||||
| 2026-02-12 | 13F | Federated Hermes, Inc. | 657.776 | 1,74 | 6.690 | -5,16 | ||||
| 2026-01-27 | 13F | Zurcher Kantonalbank (Zurich Cantonalbank) | 83.414 | 22,19 | 848 | 13,98 | ||||
| 2026-01-29 | 13F | Cornerstone Investment Partners, LLC | 16.599 | 0,07 | 169 | -6,67 | ||||
| 2026-01-23 | 13F | Transcend Wealth Collective, Llc | 13.109 | -28,42 | 133 | -33,17 | ||||
| 2026-02-17 | 13F | State Of Wisconsin Investment Board | 144.785 | 2,75 | 1.472 | -4,23 | ||||
| 2025-11-12 | 13F | Headlands Technologies LLC | 0 | -100,00 | 0 | |||||
| 2026-04-24 | 13F | Retirement Systems of Alabama | 1.088.013 | -23,22 | 6.506 | -54,85 | ||||
| 2026-02-17 | 13F | Dragoneer Investment Group, LLC | 670.000 | 0,00 | 6.814 | -6,79 | ||||
| 2026-04-20 | 13F | Tanager Wealth Management LLP | 0 | -100,00 | 0 | |||||
| 2025-11-14 | 13F | WealthTrak Capital Management LLC | 0 | -100,00 | 0 | |||||
| 2026-02-13 | 13F | Ossiam | 94.429 | 0,00 | 960 | -6,80 | ||||
| 2026-02-17 | 13F | Bank Of America Corp /de/ | Put | 0 | -100,00 | 0 | ||||
| 2026-04-22 | 13F | Cornerstone Wealth Group, LLC | 11.951 | 74 | ||||||
| 2026-04-13 | 13F | Massmutual Trust Co Fsb/adv | 1.001 | 844,34 | 6 | 400,00 | ||||
| 2026-04-21 | 13F | Pallas Capital Advisors LLC | 10.778 | -74,80 | 64 | -85,25 | ||||
| 2026-02-13 | 13F | Stifel Financial Corp | 12.707 | -52,37 | 129 | -55,67 | ||||
| 2026-02-13 | 13F | Edgestream Partners, L.P. | 243.150 | 2.473 | ||||||
| 2026-02-10 | 13F | New Mexico Educational Retirement Board | 62.400 | 0,00 | 1 | |||||
| 2026-02-17 | 13F | Mercer Global Advisors Inc /adv | 48.799 | -32,78 | 496 | -37,37 | ||||
| 2026-04-16 | 13F | Evolve Private Wealth, Llc | 0 | -100,00 | 0 | |||||
| 2025-11-12 | 13F | Aster Capital Management (DIFC) Ltd | 0 | -100,00 | 0 | -100,00 | ||||
| 2026-02-09 | 13F | Ceera Investments, Llc | 0 | -100,00 | 0 | |||||
| 2026-02-13 | 13F | Manufacturers Life Insurance Company, The | 0 | -100,00 | 0 | |||||
| 2026-02-17 | 13F | Sherbrooke Park Advisers Llc | 10.203 | 104 | ||||||
| 2026-02-17 | 13F | Two Sigma Investments, Lp | 1.029.537 | -10,43 | 10.470 | -16,51 | ||||
| 2026-01-27 | 13F | Brighton Jones Llc | 0 | -100,00 | 0 | |||||
| 2026-02-06 | 13F | Evoke Wealth, Llc | 10.264 | -34,43 | 104 | -38,82 | ||||
| 2025-11-06 | 13F | Impax Asset Management Group plc | 0 | -100,00 | 0 | |||||
| 2026-02-13 | 13F | BNP Paribas Asset Management Holding S.A. | 465.782 | 5 | ||||||
| 2026-02-13 | 13F | State Street Corp | 8.593.974 | -2,22 | 87.401 | -8,85 | ||||
| 2026-01-14 | 13F | ORG Partners LLC | 42 | 0 | ||||||
| 2026-04-15 | 13F | FNY Investment Advisers, LLC | 0 | -100,00 | 0 | |||||
| 2026-02-17 | 13F | Caption Management, LLC | Put | 205.000 | 2.085 | |||||
| 2026-02-17 | 13F | Caption Management, LLC | 57.484 | -24,36 | 585 | -29,55 | ||||
| 2026-02-12 | 13F | Intrinsic Edge Capital Management LLC | 0 | -100,00 | 0 | |||||
| 2026-02-09 | 13F | Kazazian Asset Management, LLC | 55.809 | 0,00 | 568 | -6,74 | ||||
| 2026-02-17 | 13F | Maryland State Retirement & Pension System | 13.281 | 0,00 | 135 | -6,25 | ||||
| 2025-11-13 | 13F | GeoWealth Management, LLC | 0 | -100,00 | 0 | |||||
| 2026-04-06 | 13F | GAMMA Investing LLC | 8.519 | 85,44 | 51 | 8,70 | ||||
| 2026-02-02 | 13F | Fifth Third Bancorp | 2.866 | -2,12 | 29 | -6,45 | ||||
| 2026-02-13 | 13F | Ontario Teachers Pension Plan Board | 15.941 | 162 | ||||||
| 2026-02-17 | 13F | Gotham Asset Management, LLC | 160.585 | -17,11 | 1.633 | -22,72 | ||||
| 2026-02-13 | 13F | Ingalls & Snyder Llc | 437.192 | 19,72 | 4 | 33,33 | ||||
| 2026-02-17 | 13F | Citadel Advisors Llc | 2.165.427 | 2.559,05 | 22.022 | 2.379,95 | ||||
| 2025-11-14 | 13F | Full Sail Capital, LLC | 12.761 | 139 | ||||||
| 2026-02-17 | 13F | Citadel Advisors Llc | Put | 234.500 | -72,31 | 2.385 | -74,20 | |||
| 2026-01-23 | 13F | Bellevue Asset Management, Llc | 0 | -100,00 | 0 | |||||
| 2026-02-13 | 13F | Ingalls & Snyder Llc | Call | 25.500 | 0,00 | 0 | ||||
| 2026-02-17 | 13F | Citadel Advisors Llc | Call | 624.500 | 0,90 | 6.351 | -5,94 | |||
| 2026-02-12 | 13F | Jane Street Group, Llc | Call | 74.300 | 84,83 | 756 | 72,37 | |||
| 2026-02-12 | 13F | Jane Street Group, Llc | 491.283 | 1.642,45 | 4.996 | 1.527,36 | ||||
| 2026-02-12 | 13F | Jane Street Group, Llc | Put | 82.500 | -69,67 | 839 | -71,72 | |||
| 2026-02-17 | 13F | Bank Of America Corp /de/ | 1.048.565 | -38,67 | 10.664 | -42,83 | ||||
| 2026-02-12 | 13F | Swiss National Bank | 533.900 | -1,51 | 5.430 | -8,20 | ||||
| 2025-11-14 | 13F | Maverick Capital Ltd | 0 | -100,00 | 0 | -100,00 | ||||
| 2026-02-12 | 13F/A | Pinebridge Investments Llc | 19.753 | 201 | ||||||
| 2025-11-14 | 13F | Hood River Capital Management LLC | 0 | -100,00 | 0 | -100,00 | ||||
| 2026-02-13 | 13F | Cramer Rosenthal Mcglynn Llc | 3.317.575 | -7,81 | 33.740 | -14,06 | ||||
| 2026-02-06 | 13F | HighTower Advisors, LLC | 91.954 | -90,59 | 935 | -91,23 | ||||
| 2025-11-13 | 13F | Quantitative Investment Management, LLC | 0 | -100,00 | 0 | |||||
| 2026-02-11 | 13F | Deutsche Bank Ag\ | 2.157.576 | -52,24 | 21.943 | -55,48 | ||||
| 2026-02-13 | 13F | Morgan Stanley | 1.424.261 | -43,35 | 14.485 | -47,20 | ||||
| 2025-11-14 | 13F | Voloridge Investment Management, Llc | 0 | -100,00 | 0 | -100,00 | ||||
| 2026-02-04 | 13F | Securian Asset Management, Inc | 19.983 | -4,84 | 203 | -11,35 | ||||
| 2026-02-11 | 13F | BIT Capital GmbH | 2.005 | -93,01 | 20 | -93,59 | ||||
| 2026-02-13 | 13F | Walleye Capital LLC | Call | 70.300 | 104,96 | 715 | 90,91 | |||
| 2026-02-17 | 13F | Lombard Odier Asset Management (USA) Corp | 15.241 | -59,09 | 155 | -61,82 | ||||
| 2026-02-13 | 13F | Walleye Capital LLC | Put | 87.500 | 890 | |||||
| 2025-11-06 | 13F | Ameritas Advisory Services, LLC | 0 | -100,00 | 0 | -100,00 | ||||
| 2026-02-17 | 13F | Frontier Capital Management Co Llc | 0 | -100,00 | 0 | |||||
| 2026-02-13 | 13F | SRS Capital Advisors, Inc. | 4.058 | -98,57 | 41 | -98,68 | ||||
| 2026-04-20 | 13F | State of Alaska, Department of Revenue | 143.495 | 278,70 | 1 | |||||
| 2026-04-13 | 13F | Creative Financial Designs Inc /adv | 0 | -100,00 | 0 | |||||
| 2026-02-17 | 13F | Dark Forest Capital Management Lp | 0 | -100,00 | 0 | |||||
| 2026-04-22 | 13F | Sterling Capital Management LLC | 8.703 | -44,54 | 52 | -67,30 | ||||
| 2026-02-17 | 13F | Circumference Group LLC | Call | 0 | -100,00 | 0 | -100,00 | |||
| 2025-11-13 | 13F | Hel Ved Capital Management Ltd | 0 | -100,00 | 0 | |||||
| 2026-02-13 | 13F | Neo Ivy Capital Management | 0 | -100,00 | 0 | |||||
| 2026-02-09 | 13F | New Age Alpha Advisors, LLC | 16.923 | -53,34 | 172 | -56,46 | ||||
| 2026-02-17 | 13F | Vinva Investment Management Ltd | 79.231 | 1.186 | ||||||
| 2026-02-17 | 13F | Principal Street Partners, LLC | 84.210 | -91,38 | 856 | -91,96 | ||||
| 2026-02-05 | 13F | North Dakota State Investment Board | 10.402 | 106 | ||||||
| 2026-02-17 | 13F | Royal Bank Of Canada | 125.235 | -85,46 | 1.272 | -86,46 | ||||
| 2026-04-15 | 13F | Merit Financial Group, LLC | 16.706 | 27,31 | 100 | -25,56 | ||||
| 2025-11-13 | 13F | Fuller & Thaler Asset Management, Inc. | 0 | -100,00 | 0 | |||||
| 2026-02-17 | 13F | Public Employees Retirement System Of Ohio | 82.706 | -12,97 | 841 | -18,82 | ||||
| 2025-10-31 | 13F | Symphony Financial, Ltd. Co. | 0 | -100,00 | 0 | -100,00 | ||||
| 2026-02-13 | 13F | Arrowstreet Capital, Limited Partnership | 42.413 | -77,57 | 431 | -79,11 | ||||
| 2026-02-17 | 13F | Capital Fund Management S.a. | Put | 51.100 | -11,44 | 520 | -17,49 | |||
| 2026-02-17 | 13F | Capital Fund Management S.a. | Call | 77.400 | -47,81 | 787 | -51,33 | |||
| 2026-02-17 | 13F | Circumference Group LLC | 455.000 | 10,98 | 4.627 | 3,44 | ||||
| 2026-02-12 | 13F | Jasper Ridge Partners, L.P. | 23.858 | 0,00 | 243 | -6,92 | ||||
| 2026-02-13 | 13F | Walleye Capital LLC | 12.775 | 61,73 | 130 | 50,00 | ||||
| 2026-02-13 | 13F | Verition Fund Management LLC | Call | 231.300 | 107,82 | 2.352 | 93,74 | |||
| 2026-01-30 | 13F | Catalytic Wealth RIA, LLC | 0 | -100,00 | 0 | |||||
| 2025-11-12 | 13F | Intech Investment Management Llc | 0 | -100,00 | 0 | -100,00 | ||||
| 2026-02-13 | 13F | Verition Fund Management LLC | 70.100 | -29,35 | 713 | -34,20 | ||||
| 2026-04-27 | 13F | Ethic Inc. | 25.887 | 0,52 | 155 | -41,00 | ||||
| 2026-04-24 | 13F | Optas, LLC | 18.363 | 3,56 | 110 | -39,44 | ||||
| 2026-04-20 | 13F | Inscription Capital, LLC | 40.537 | 49,83 | 242 | -12,00 | ||||
| 2026-02-17 | 13F | Ardmore Road Asset Management LP | 827.658 | 8.417 | ||||||
| 2026-02-17 | 13F | Summit Trail Advisors, Llc | 128.004 | -20,63 | 1.302 | -26,04 | ||||
| 2026-02-20 | 13F | Sunbelt Securities, Inc. | 256 | 0,00 | 3 | 0,00 | ||||
| 2026-02-13 | 13F | Rhumbline Advisers | 697.443 | -7,26 | 7.093 | -13,55 | ||||
| 2026-02-13 | 13F | Sachem Head Capital Management LP | 14.795.000 | -3,90 | 150.465 | -10,42 | ||||
| 2026-01-28 | 13F | Universal- Beteiligungs- und Servicegesellschaft mbH | 572.579 | 41,29 | 5.799 | 31,17 | ||||
| 2026-02-17 | 13F | Ameriprise Financial Inc | 281.986 | 13,87 | 2.868 | 6,15 | ||||
| 2026-02-13 | 13F | Kennedy Capital Management, Inc. | 1.479.924 | 8,83 | 15.051 | 1,44 | ||||
| 2026-01-30 | 13F | Camden Capital, LLC | 11.507 | -2,97 | 117 | -9,30 | ||||
| 2026-02-17 | 13F | Greenhouse Funds LLLP | Call | 0 | -100,00 | 0 | ||||
| 2026-02-13 | 13F | Charles Schwab Investment Management Inc | 2.408.049 | 5,56 | 24.490 | -1,60 | ||||
| 2026-02-17 | 13F | Captrust Financial Advisors | 47.885 | -24,21 | 487 | -29,46 | ||||
| 2026-02-17 | 13F | Greenhouse Funds LLLP | 10.632.097 | 1,02 | 108.128 | -5,83 | ||||
| 2026-01-30 | 13F | American Capital Advisory, LLC | 8 | 0 | ||||||
| 2026-02-03 | 13F | Washington Trust Advisors, Inc. | 0 | -100,00 | 0 | |||||
| 2026-02-13 | 13F | Umb Bank N A/mo | 4.530 | 0,82 | 46 | -6,12 | ||||
| 2026-02-06 | 13F | Lsv Asset Management | 10.181.382 | 35,63 | 104 | 27,16 | ||||
| 2026-01-29 | 13F | Rakuten Securities, Inc. | 20.006 | 0,00 | 203 | -6,88 | ||||
| 2026-01-05 | 13F | Chesapeake Asset Management Llc | 189 | 0,00 | 2 | 0,00 | ||||
| 2026-02-03 | 13F | Crestwood Advisors Group LLC | 18.634 | 50,69 | 190 | 41,04 | ||||
| 2026-02-17 | 13F | Guggenheim Capital Llc | 0 | -100,00 | 0 | |||||
| 2026-02-13 | 13F | Public Employees Retirement Association Of Colorado | 29.750 | 0,00 | 0 | |||||
| 2026-02-24 | 13F | Villanova Investment Management Co LLC | 283.659 | 5,20 | 2.885 | -1,94 | ||||
| 2026-02-11 | 13F | Rise Advisors, LLC | 0 | -100,00 | 0 | |||||
| 2026-02-17 | 13F | Two Sigma Securities, Llc | 0 | -100,00 | 0 | |||||
| 2026-04-15 | 13F | Bayforest Capital Ltd | 19.533 | -45,63 | 117 | -68,22 | ||||
| 2026-02-23 | 13F | Kera Capital Partners, Inc. | 32.894 | 2,10 | 265 | -24,79 | ||||
| 2026-04-24 | 13F | Root Financial Partners, LLC | 180 | -73,95 | 1 | -85,71 | ||||
| 2026-02-03 | 13F | Mitsubishi UFJ Kokusai Asset Management Co., Ltd. | 188 | 0,00 | 2 | -50,00 | ||||
| 2026-02-17 | 13F | Fmr Llc | 23.473.263 | 12,48 | 238.723 | 4,85 | ||||
| 2026-04-20 | 13F | Friedenthal Financial | 0 | -100,00 | 0 | |||||
| 2026-02-17 | 13F | Millennium Management Llc | Put | 300.000 | 3.051 | |||||
| 2026-02-17 | 13F | Millennium Management Llc | Call | 400.000 | 59,24 | 4.068 | 48,47 | |||
| 2026-02-17 | 13F | Millennium Management Llc | 347.103 | 253,80 | 3.530 | 229,91 | ||||
| 2025-11-06 | 13F | Versor Investments LP | 0 | -100,00 | 0 | |||||
| 2026-04-17 | 13F | IFC & Insurance Marketing, Inc. | 0 | -100,00 | 0 | |||||
| 2026-02-17 | 13F | Jain Global LLC | 1.177.432 | 61,32 | 11.974 | 50,39 | ||||
| 2026-01-29 | 13F | UBS Group AG | 2.103.885 | 42,02 | 21.397 | 32,39 | ||||
| 2026-02-11 | 13F | CLARET ASSET MANAGEMENT Corp | 22.685 | -0,23 | 0 | |||||
| 2026-02-12 | 13F | Voya Investment Management Llc | 170.295 | -3,81 | 1.732 | -10,36 | ||||
| 2026-02-11 | 13F | Simplex Trading, Llc | Put | 13.400 | -97,53 | 136 | 2.620,00 | |||
| 2026-02-11 | 13F | Simplex Trading, Llc | Call | 115.000 | -33,49 | 1.170 | 116.800,00 | |||
| 2026-02-12 | 13F | Campbell & CO Investment Adviser LLC | 70.462 | 209,72 | 717 | 188,71 | ||||
| 2025-11-06 | 13F | Whipplewood Advisors, LLC | 0 | -100,00 | 0 | |||||
| 2026-01-30 | 13F | State of New Jersey Common Pension Fund D | 229.697 | 9,07 | 2.336 | 1,70 | ||||
| 2026-04-13 | 13F | True Wealth Design, LLC | 5.913 | -19,09 | 35 | -52,70 | ||||
| 2026-02-02 | 13F | Principal Financial Group Inc | 589.862 | -5,43 | 5.999 | -11,85 | ||||
| 2026-02-17 | 13F | RPD Fund Management LLC | 9.628.318 | 19,40 | 97.920 | 11,30 | ||||
| 2026-02-09 | 13F | CBIZ Investment Advisory Services, LLC | 105 | 1 | ||||||
| 2026-02-17 | 13F | Cypress Point Investment Management Lp | 1.493.867 | 15.193 | ||||||
| 2026-02-23 | 13F | Mv Capital Management, Inc. | 16 | 0,00 | 0 | |||||
| 2026-04-27 | 13F | HB Wealth Management, LLC | 13.348 | 80 | ||||||
| 2026-02-17 | 13F | Engineers Gate Manager LP | 18.532 | -48,40 | 188 | -51,92 | ||||
| 2026-02-10 | 13F | Amica Mutual Insurance Co | 78.264 | 0,00 | 1 | |||||
| 2026-01-29 | 13F | UBS Group AG | Put | 351.000 | 3.570 | |||||
| 2026-02-05 | 13F | Thrivent Financial For Lutherans | 62.264 | -4,12 | 1 | |||||
| 2026-04-23 | 13F | Oppenheimer Asset Management Inc. | 28.165 | -35,81 | 168 | -62,33 | ||||
| 2026-03-12 | 13F/A | Peak6 Llc | 136.064 | 1.870,80 | 1.384 | 1.744,00 | ||||
| 2026-03-12 | 13F/A | Peak6 Llc | Put | 610.800 | -24,69 | 6.212 | -29,80 | |||
| 2026-01-30 | 13F | Torren Management, LLC | 75 | 1 | ||||||
| 2025-11-14 | 13F | AXA Investment Managers S.A. | 357.618 | 3.902 | ||||||
| 2026-01-30 | 13F | Mitsubishi UFJ Trust & Banking Corp | 33.574 | 96,29 | 341 | 83,33 | ||||
| 2026-02-13 | 13F | SYM FINANCIAL Corp | 0 | -100,00 | 0 | |||||
| 2026-02-17 | 13F | Utah Retirement Systems | 201.023 | -0,56 | 2.044 | -7,30 | ||||
| 2026-02-17 | 13F | Janus Henderson Group Plc | 131.932 | 13,34 | 1.341 | 5,76 | ||||
| 2026-03-16 | 13F | Osbon Capital Management Llc | 636 | 6 | ||||||
| 2026-02-13 | 13F | Treasurer of the State of North Carolina | 111.142 | -16,36 | 1 | 0,00 | ||||
| 2026-02-11 | 13F | Strategic Advocates LLC | 29 | 0,00 | 0 | |||||
| 2026-02-11 | 13F | Manchester Capital Management LLC | 81 | 1 | ||||||
| 2026-02-13 | 13F | Sei Investments Co | 201.875 | 430,11 | 2.053 | 394,46 | ||||
| 2026-02-12 | 13F | MetLife Investment Management, LLC | 133.836 | -7,30 | 1.361 | -13,59 | ||||
| 2026-02-13 | 13F | Barclays Plc | 433.436 | -65,98 | 4.408 | -68,29 | ||||
| 2025-11-14 | 13F | Point72 (DIFC) Ltd | 0 | -100,00 | 0 | -100,00 | ||||
| 2026-04-20 | 13F | Louisiana State Employees Retirement System | 119.100 | 56,92 | 712 | -7,65 | ||||
| 2026-04-22 | 13F | Parcion Private Wealth LLC | 0 | -100,00 | 0 | |||||
| 2026-02-13 | 13F | JustInvest LLC | 34.589 | 11,17 | 352 | 3,54 | ||||
| 2026-02-10 | 13F | Easterly Investment Partners Llc | 155.400 | 21,01 | 1.580 | 12,78 | ||||
| 2026-02-17 | 13F | Amundi | 80.976 | -17,51 | 824 | -21,39 | ||||
| 2026-03-12 | 13F/A | Peak6 Llc | Call | 79.500 | -13,49 | 809 | -19,36 | |||
| 2026-02-17 | 13F | Trexquant Investment LP | 624.423 | 6.350 | ||||||
| 2026-01-23 | 13F | Avion Wealth | 62 | 0,00 | 0 | |||||
| 2026-02-06 | 13F | Vestmark Advisory Solutions, Inc. | 63.569 | 3,18 | 646 | -3,87 | ||||
| 2026-02-17 | 13F | Two Sigma Advisers, Lp | 391.400 | 16,45 | 3.981 | 8,57 | ||||
| 2026-02-17 | 13F | Raymond James Financial Inc | 776.599 | -4,03 | 7.794 | -11,72 | ||||
| 2026-02-13 | 13F | Entropy Technologies, LP | 17.102 | 174 | ||||||
| 2026-02-11 | 13F | Havemeyer Place LP | 10.051 | 102 | ||||||
| 2026-02-17 | 13F | Lazard Asset Management Llc | 19.559 | 0,00 | 199 | -7,04 | ||||
| 2026-02-17 | 13F | Optiver Holding B.V. | 0 | -100,00 | 0 | |||||
| 2026-02-05 | 13F | HFM Investment Advisors, LLC | 13 | 30,00 | 0 | |||||
| 2026-04-24 | 13F | Yousif Capital Management, Llc | 72.353 | -14,92 | 433 | -42,17 | ||||
| 2026-01-29 | 13F | Vanguard Group Inc | 25.114.644 | -2,46 | 255.416 | -9,07 | ||||
| 2026-03-09 | 13F | EMC Capital Management | 5.947 | -15,01 | 0 | |||||
| 2026-02-17 | 13F | Buckland Partners Management Co LLC | 10.000 | 102 | ||||||
| 2026-02-11 | 13F | Los Angeles Capital Management Llc | 1.580 | 17 | ||||||
| 2026-02-12 | 13F | DRW Securities, LLC | 12.837 | 131 | ||||||
| 2026-04-02 | 13F | Marex Group plc | 0 | -100,00 | 0 | |||||
| 2026-02-05 | 13F | Bessemer Group Inc | 817 | -37,06 | 0 | |||||
| 2026-02-17 | 13F | Alliancebernstein L.p. | 336.724 | -69,23 | 3.424 | -71,32 | ||||
| 2026-02-04 | 13F | Oregon Public Employees Retirement Fund | 54.430 | -3,54 | 554 | -10,08 | ||||
| 2026-02-13 | 13F | Wells Fargo & Company/mn | 109.416 | 216,64 | 1.113 | 195,74 | ||||
| 2026-04-28 | 13F | Handelsbanken Fonder AB | 94.100 | 0,00 | 1 | |||||
| 2026-02-13 | 13F | Brown Advisory Inc | 12.075 | -11,70 | 123 | -18,12 | ||||
| 2026-02-13 | 13F | Verition Fund Management LLC | Put | 0 | -100,00 | 0 | -100,00 | |||
| 2026-02-17 | 13F | Odyssean, LLC | 74.509 | 758 | ||||||
| 2026-02-17 | 13F | Voleon Capital Management Lp | 0 | -100,00 | 0 | |||||
| 2026-02-17 | 13F | Canada Pension Plan Investment Board | 570.100 | 27,03 | 5.798 | 18,40 | ||||
| 2026-02-09 | 13F | Geode Capital Management, Llc | 5.450.335 | -2,28 | 55.441 | -8,91 | ||||
| 2025-11-12 | 13F | Guardian Capital Lp | 0 | -100,00 | 0 | -100,00 | ||||
| 2026-02-18 | 13F | Caitlin John, LLC | 0 | -100,00 | 0 | |||||
| 2026-02-11 | 13F | Franklin Resources Inc | 0 | -100,00 | 0 | -100,00 | ||||
| 2026-04-23 | 13F | Marquette Asset Management, LLC | 1.867 | 66,25 | 11 | 0,00 | ||||
| 2026-02-13 | 13F/A | Abound Financial, Llc | 100 | 1 | ||||||
| 2026-02-10 | 13F | Globeflex Capital L P | 52.010 | 529 | ||||||
| 2025-11-05 | 13F | SOUTH STATE Corp | 0 | -100,00 | 0 | |||||
| 2026-04-15 | 13F | Fortitude Family Office, LLC | 43 | -69,50 | 0 | -100,00 | ||||
| 2026-02-06 | 13F | Larson Financial Group LLC | 611 | 47,94 | 6 | 50,00 | ||||
| 2026-01-29 | 13F | Dunhill Financial, LLC | 6 | 0 | ||||||
| 2026-02-17 | 13F | Cresset Asset Management, LLC | 15.635 | -6,62 | 159 | -12,64 | ||||
| 2026-02-09 | 13F | Legal & General Group Plc | 402.287 | -9,36 | 4.091 | -15,55 | ||||
| 2025-11-14 | 13F | Bridgefront Capital, LLC | 0 | -100,00 | 0 | -100,00 | ||||
| 2026-02-17 | 13F | Capstone Investment Advisors, Llc | 0 | -100,00 | 0 | -100,00 | ||||
| 2026-02-17 | 13F | Advisory Services Network, LLC | 9.619 | 0,08 | 98 | -6,73 | ||||
| 2026-04-13 | 13F | IFP Advisors, Inc | 3.614 | 167,11 | 22 | 61,54 | ||||
| 2026-04-28 | 13F | Sage Rhino Capital Llc | 13.850 | 83 | ||||||
| 2026-04-14 | 13F | Zrc Wealth Management, Llc | 0 | -100,00 | 0 | |||||
| 2026-02-10 | 13F | Acadian Asset Management Llc | 189.989 | 1.923,10 | 2 | |||||
| 2026-02-13 | 13F | Squarepoint Ops LLC | 0 | -100,00 | 0 | |||||
| 2026-02-13 | 13F | Transamerica Financial Advisors, Inc. | 38 | 0 | ||||||
| 2026-02-13 | 13F | American Century Companies Inc | 246.388 | 2.506 | ||||||
| 2026-02-17 | 13F | Magnetar Financial LLC | 161.936 | 1.647 | ||||||
| 2026-02-10 | 13F | Bnp Paribas Arbitrage, Sa | 449.078 | 14,23 | 4.567 | 6,48 | ||||
| 2026-02-06 | 13F | EverSource Wealth Advisors, LLC | 9.971 | -12,72 | 101 | -18,55 | ||||
| 2025-11-14 | 13F | Ancora Advisors, LLC | 0 | -100,00 | 0 | -100,00 | ||||
| 2025-11-14 | 13F | Hotchkis & Wiley Capital Management Llc | 0 | -100,00 | 0 | -100,00 | ||||
| 2026-02-19 | 13F | CI Private Wealth, LLC | 39.677 | 33,08 | 386 | 18,46 | ||||
| 2026-04-24 | 13F | Strs Ohio | 6.204 | -2,36 | 37 | -42,19 | ||||
| 2026-02-05 | 13F | Requisite Capital Management, LLC | 0 | -100,00 | 0 | |||||
| 2026-02-17 | 13F | ExodusPoint Capital Management, LP | 0 | -100,00 | 0 | -100,00 | ||||
| 2026-02-17 | 13F | Kerrisdale Advisers, LLC | 348.428 | 0,00 | 3.544 | -6,79 | ||||
| 2025-11-14 | 13F | Texas Permanent School Fund | 0 | -100,00 | 0 | |||||
| 2026-02-12 | 13F | BlackRock, Inc. | 24.718.922 | -3,35 | 251.391 | -9,90 | ||||
| 2025-11-12 | 13F | 111 Capital | 0 | -100,00 | 0 | -100,00 | ||||
| 2026-02-11 | 13F | Parallel Advisors, LLC | 3.889 | 15,33 | 40 | 8,33 | ||||
| 2026-02-12 | 13F | Skandinaviska Enskilda Banken AB (publ) | 0 | -100,00 | 0 | |||||
| 2026-02-17 | 13F | TCG Advisory Services, LLC | 15.350 | -10,99 | 156 | -17,02 | ||||
| 2026-02-10 | 13F | Commonwealth Of Pennsylvania Public School Empls Retrmt Sys | 68.617 | -4,65 | 698 | -11,21 | ||||
| 2026-02-11 | 13F | Primecap Management Co/ca/ | 3.670.164 | -24,22 | 37.326 | -29,36 | ||||
| 2026-01-29 | 13F | State Of Michigan Retirement System | 64.800 | -2,99 | 659 | -9,48 | ||||
| 2026-02-11 | 13F | Winnow Wealth Llc | 0 | -100,00 | 0 | |||||
| 2026-02-05 | 13F | Amalgamated Bank | 125.656 | -2,55 | 1 | 0,00 | ||||
| 2026-04-28 | 13F | Golden State Equity Partners | 68 | 0 | ||||||
| 2026-02-17 | 13F | Tower Research Capital LLC (TRC) | 14.389 | -21,57 | 146 | -27,00 | ||||
| 2026-04-28 | 13F | Bogart Wealth, LLC | 0 | -100,00 | 0 | |||||
| 2026-04-16 | 13F | Diversified Trust Co | 15.866 | 95 | ||||||
| 2026-02-17 | 13F | Man Group plc | 406.525 | -11,07 | 4.134 | -17,10 | ||||
| 2026-04-27 | 13F | New York State Teachers Retirement System | 258.642 | 8,75 | 2 | -50,00 | ||||
| 2026-02-12 | 13F | Skopos Labs, Inc. | 11.889 | 118 | ||||||
| 2026-02-12 | 13F | Principal Securities, Inc. | 0 | -100,00 | 0 | -100,00 | ||||
| 2026-02-13 | 13F | Citigroup Inc | 80.272 | 3,29 | 816 | -3,66 | ||||
| 2026-02-09 | 13F | Hantz Financial Services, Inc. | 6.712 | 195,68 | 0 | |||||
| 2026-02-11 | 13F | Winton Capital Group Ltd | 28.900 | 294 | ||||||
| 2026-02-10 | 13F | Envestnet Asset Management Inc | 0 | -100,00 | 0 | |||||
| 2026-02-10 | 13F | Cherry Tree Wealth Management, LLC | 0 | -100,00 | 0 | |||||
| 2026-02-17 | 13F | Fred Alger Management, Llc | 29.960 | 7,68 | 305 | 0,33 | ||||
| 2026-03-06 | 13F | Hsbc Holdings Plc | 16.702 | 169 | ||||||
| 2026-02-17 | 13F | Balyasny Asset Management Llc | 280.277 | 1.808,72 | 2.850 | 1.681,25 | ||||
| 2026-02-11 | 13F | Hughes Financial Services, LLC | 64 | 0,00 | 1 | |||||
| 2026-02-17 | 13F | nVerses Capital, LLC | 11.480 | 117 | ||||||
| 2025-10-30 | 13F | Allegiance Financial Group Advisory Services LLC | 0 | -100,00 | 0 | -100,00 | ||||
| 2026-04-27 | 13F | Leonteq Securities AG | 483 | -10,56 | 3 | -60,00 | ||||
| 2026-02-17 | 13F | Aqr Capital Management Llc | 4.388.780 | -36,61 | 44.063 | -41,66 | ||||
| 2026-02-10 | 13F | Bank of New York Mellon Corp | 1.734.430 | 1,98 | 17.639 | -4,93 | ||||
| 2026-01-28 | 13F | Chicago Partners Investment Group LLC | 19.128 | -22,97 | 169 | -39,78 | ||||
| 2026-02-12 | 13F | California Public Employees Retirement System | 469.585 | -8,04 | 4.776 | -14,29 | ||||
| 2026-02-06 | 13F | Gsa Capital Partners Llp | 18.882 | -56,16 | 0 | |||||
| 2026-04-07 | 13F | Farther Finance Advisors, LLC | 718 | 46,53 | 4 | 0,00 | ||||
| 2026-02-13 | 13F | Victory Capital Management Inc | 704.471 | 34,49 | 7.164 | 25,38 | ||||
| 2026-01-29 | 13F | Teachers Retirement System Of The State Of Kentucky | 87.797 | 0,00 | 1 | |||||
| 2026-04-17 | 13F | Bell Investment Advisors, Inc | 960 | 1.423,81 | 6 | |||||
| 2026-02-05 | 13F | Elyxium Wealth, LLC | 45 | 0 | ||||||
| 2026-02-11 | 13F | Ameritas Investment Partners, Inc. | 50.252 | 511 | ||||||
| 2026-02-13 | 13F | Neuberger Berman Group LLC | 55.525 | -15,54 | 565 | -21,34 | ||||
| 2026-01-28 | 13F | DekaBank Deutsche Girozentrale | 5.493 | 0,00 | 0 | |||||
| 2026-02-10 | 13F | Bruce G. Allen Investments, LLC | 94 | 0,00 | 1 | -100,00 | ||||
| 2026-02-13 | 13F | Dynamic Technology Lab Private Ltd | 15.888 | 162 | ||||||
| 2026-02-17 | 13F | Capital Fund Management S.a. | 53.296 | 542 | ||||||
| 2026-02-17 | 13F | Creative Planning | 73.304 | 49,46 | 746 | 39,25 | ||||
| 2026-02-06 | 13F | Mach-1 Financial Group, Inc. | 19.567 | 199 | ||||||
| 2026-02-17 | 13F | MIRAE ASSET GLOBAL ETFS HOLDINGS Ltd. | 0 | -100,00 | 0 | |||||
| 2025-11-14 | 13F | Candlestick Capital Management LP | 0 | -100,00 | 0 | |||||
| 2026-02-11 | 13F | Group One Trading, L.p. | Put | 109.600 | -65,70 | 1.115 | -68,03 | |||
| 2026-02-11 | 13F | Syon Capital Llc | 21.609 | 220 | ||||||
| 2026-04-21 | 13F | Red Tortoise LLC | 0 | -100,00 | 0 | |||||
| 2026-01-27 | 13F | WealthCollab, LLC | 0 | -100,00 | 0 | |||||
| 2026-02-11 | 13F | Group One Trading, L.p. | 68.365 | -70,88 | 695 | -72,86 | ||||
| 2026-02-11 | 13F | Group One Trading, L.p. | Call | 57.900 | -77,35 | 589 | -78,91 | |||
| 2026-02-12 | 13F | Cloud Capital Management, LLC | 0 | -100,00 | 0 | |||||
| 2026-02-17 | 13F | Glenview Capital Management, Llc | 20.005.242 | 8,11 | 203.453 | 0,77 | ||||
| 2026-03-30 | 13F/A | Barclays Plc | Put | 0 | -100,00 | 0 | -100,00 | |||
| 2026-04-23 | 13F | waypoint wealth counsel | 0 | -100,00 | 0 | |||||
| 2026-04-20 | 13F | Yorktown Management & Research Co Inc | 0 | -100,00 | 0 | |||||
| 2026-04-17 | 13F | Krilogy Financial LLC | 10.836 | -47,39 | 67 | -63,93 | ||||
| 2026-02-17 | 13F | XTX Topco Ltd | 202.181 | 1.661,31 | 2.056 | 1.544,80 | ||||
| 2026-02-04 | 13F | Pacer Advisors, Inc. | 3.395.662 | 8.942,08 | 34.534 | 8.343,28 | ||||
| 2026-02-12 | 13F | Ci Investments Inc. | 0 | -100,00 | 0 | |||||
| 2026-02-13 | 13F | Kilter Group LLC | 65 | 0,00 | 1 | |||||
| 2025-11-14 | 13F | Holocene Advisors, LP | 0 | -100,00 | 0 | -100,00 | ||||
| 2026-02-10 | 13F | Jupiter Asset Management Ltd | 940.620 | 9.566 | ||||||
| 2026-02-13 | 13F | First Trust Advisors Lp | 820.934 | 8.349 | ||||||
| 2026-01-12 | 13F | Rialto Wealth Management, LLC | 18 | 100,00 | 0 | |||||
| 2026-02-13 | 13F | Harber Asset Management Llc | 853.275 | -5,02 | 8.678 | -11,46 | ||||
| 2026-01-15 | 13F | Nisa Investment Advisors, Llc | 52 | -29,73 | 1 | |||||
| 2026-02-13 | 13F | MAI Capital Management | 64 | 0,00 | 1 | |||||
| 2026-02-13 | 13F | Walleye Trading LLC | Put | 4.800 | -95,94 | 49 | -96,27 | |||
| 2026-02-12 | 13F | Xponance, Inc. | 30.905 | -17,67 | 314 | -23,23 | ||||
| 2026-02-13 | 13F | Walleye Trading LLC | Call | 50.300 | -63,04 | 512 | -65,57 | |||
| 2026-02-13 | 13F | Cynosure Management, Llc | 227.765 | -18,90 | 2.316 | -24,39 | ||||
| 2026-02-17 | 13F | Sone Capital Management, LLC | 467.802 | 4.758 | ||||||
| 2026-01-23 | 13F | Assetmark, Inc | 140 | 258,97 | 1 | |||||
| 2026-04-27 | 13F | Y-Intercept (Hong Kong) Ltd | 0 | -100,00 | 0 | |||||
| 2026-02-17 | 13F | Parallax Volatility Advisers, L.P. | 0 | -100,00 | 0 | -100,00 | ||||
| 2026-02-17 | 13F | Mirabella Financial Services Llp | 35.255 | 359 | ||||||
| 2026-04-21 | 13F | Aaron Wealth Advisors LLC | 35.685 | 213 | ||||||
| 2026-02-10 | 13F | Savant Capital, LLC | 0 | -100,00 | 0 | -100,00 | ||||
| 2026-02-09 | 13F | Jackson Creek Investment Advisors LLC | 11.675 | 0,34 | 0 | |||||
| 2026-02-13 | 13F | Prudential Financial Inc | 20.807 | -31,26 | 212 | -36,06 | ||||
| 2026-02-13 | 13F | Crescent Park Management, L.P. | 568.121 | -24,51 | 5.778 | -29,63 | ||||
| 2026-02-10 | 13F | Mutual Of America Capital Management Llc | 114.115 | -11,88 | 1.161 | -17,85 | ||||
| 2025-11-14 | 13F | Tudor Investment Corp Et Al | 0 | -100,00 | 0 | |||||
| 2026-01-26 | 13F | KBC Group NV | 9.973 | 0,00 | 0 | |||||
| 2026-04-20 | 13F | Assenagon Asset Management S.A. | 1.538.853 | 5.757,61 | 9.202 | 3.346,44 | ||||
| 2026-04-23 | 13F | Interchange Capital Partners, LLC | 0 | -100,00 | 0 | |||||
| 2026-02-17 | 13F | ISAM Funds (UK) Ltd | 0 | -100,00 | 0 | |||||
| 2026-01-20 | 13F | Cromwell Holdings LLC | 48 | 0,00 | 0 | |||||
| 2026-02-10 | 13F | Godfrey Financial Associates, Inc. | 143 | 1 | ||||||
| 2026-02-11 | 13F | Fox Run Management, L.l.c. | 0 | -100,00 | 0 | |||||
| 2026-02-17 | 13F | Woodline Partners LP | 63.524 | 646 | ||||||
| 2026-02-12 | 13F | Elo Mutual Pension Insurance Co | 26.804 | 273 | ||||||
| 2026-04-07 | 13F | Signaturefd, Llc | 7.160 | 607,51 | 43 | 320,00 | ||||
| 2026-02-10 | 13F | Hillsdale Investment Management Inc. | 741.815 | 19,15 | 7.544 | 11,07 | ||||
| 2026-02-17 | 13F | Nomura Holdings Inc | 78.962 | 803 | ||||||
| 2026-01-27 | 13F | Evergreen Capital Management Llc | 21.151 | 9,25 | 215 | 1,90 | ||||
| 2026-02-12 | 13F | CIBC Private Wealth Group, LLC | 229.961 | -53,70 | 2.339 | -56,86 | ||||
| 2026-04-21 | 13F | Vise Technologies, Inc. | 14.537 | 0,00 | 148 | 0,00 | ||||
| 2026-01-26 | 13F | Cwm, Llc | 156.092 | -24,01 | 2 | -50,00 | ||||
| 2026-01-29 | 13F | Comerica Bank | 64.890 | -9,48 | 660 | -15,73 | ||||
| 2026-02-17 | 13F | Jones Financial Companies Lllp | 865 | -15,61 | 9 | -27,27 | ||||
| 2026-02-10 | 13F | Fielder Capital Group LLC | 15.395 | 36,67 | 157 | 27,87 | ||||
| 2025-11-14 | 13F | Twinbeech Capital Lp | 0 | -100,00 | 0 | |||||
| 2026-02-10 | 13F | CIBC Asset Management Inc | 12.132 | 0,00 | 123 | -6,82 | ||||
| 2026-02-17 | 13F | Kinetic Partners Management, LP | 1.046.480 | -20,63 | 10.643 | -26,02 | ||||
| 2026-02-10 | 13F | Nomura Asset Management Co Ltd | 2.100 | 0,00 | 21 | -4,55 | ||||
| 2025-11-14 | 13F | Shelton Capital Management | 0 | -100,00 | 0 | |||||
| 2026-02-17 | 13F | Polymer Capital Management (US) LLC | 11.082 | 113 | ||||||
| 2026-02-20 | 13F | Kovitz Investment Group Partners, LLC | 0 | -100,00 | 0 | |||||
| 2026-02-10 | 13F | Goldman Sachs Group Inc | 946.376 | 9,50 | 9.625 | 2,07 | ||||
| 2026-02-09 | 13F | Keating Financial Advisory Services, Inc. | 30 | 0 | ||||||
| 2026-03-30 | 13F/A | Barclays Plc | Call | 0 | -100,00 | 0 | -100,00 | |||
| 2026-02-05 | 13F | Allworth Financial LP | 3.935 | 6,78 | 40 | 0,00 | ||||
| 2026-02-13 | 13F | Squarepoint Ops LLC | Call | 0 | -100,00 | 0 | ||||
| 2026-02-12 | 13F | Bank Of Montreal /can/ | 37.645 | 8,15 | 383 | 0,79 | ||||
| 2026-02-17 | 13F | Prelude Capital Management, Llc | 1.445.218 | 23,50 | 14.698 | 15,12 | ||||
| 2026-04-24 | 13F | UMA Financial Services, Inc. | 393 | 214,40 | 2 | 100,00 | ||||
| 2025-11-07 | 13F | Amica Retiree Medical Trust | 7.807 | -39,33 | 0 | |||||
| 2026-02-17 | 13F | Adage Capital Partners Gp, L.l.c. | 3.000.000 | 9,09 | 30.510 | 1,69 | ||||
| 2025-11-13 | 13F | Fieldview Capital Management, LLC | 0 | -100,00 | 0 | -100,00 | ||||
| 2026-04-28 | 13F | SBI Securities Co., Ltd. | 18.488 | -2,11 | 111 | -42,71 | ||||
| 2026-02-17 | 13F | Boothbay Fund Management, Llc | 0 | -100,00 | 0 | |||||
| 2026-04-23 | 13F | MQS Management LLC | 11.918 | 71 | ||||||
| 2026-04-27 | 13F | Td Private Client Wealth Llc | 44 | 0 | ||||||
| 2026-02-17 | 13F | Northern Trust Corp | 2.350.874 | -7,57 | 23.908 | -13,84 | ||||
| 2026-01-29 | 13F | IMC-Chicago, LLC | 0 | -100,00 | 0 | -100,00 | ||||
| 2026-02-11 | 13F | Inceptionr Llc | 11.024 | 112 | ||||||
| 2026-02-17 | 13F | Advisor Group Holdings, Inc. | 887 | -54,84 | 9 | -57,14 | ||||
| 2026-02-04 | 13F | Swiss Life Asset Management Ltd | 30.003 | 133,40 | 305 | 117,86 | ||||
| 2025-11-14 | 13F | Wolverine Trading, Llc | 21.236 | -26,96 | 247 | -16,04 | ||||
| 2025-11-14 | 13F | Wolverine Trading, Llc | Call | 37.800 | 45,95 | 439 | 67,82 | |||
| 2026-02-12 | 13F | Wealthspire Advisors, LLC | 0 | -100,00 | 0 | |||||
| 2025-11-14 | 13F | Wolverine Trading, Llc | Put | 59.000 | -18,28 | 685 | -6,04 | |||
| 2026-01-29 | 13F | IMC-Chicago, LLC | Put | 121.900 | -69,55 | 1.240 | -71,63 | |||
| 2026-04-23 | 13F | SJS Investment Consulting Inc. | 8.947 | 379,99 | 54 | 194,44 | ||||
| 2026-01-29 | 13F | IMC-Chicago, LLC | Call | 146.800 | 3,82 | 1.493 | -3,24 | |||
| 2026-02-17 | 13F | Sender Co & Partners, Inc. | Call | 43.100 | -80,04 | 438 | -81,40 | |||
| 2026-02-13 | 13F | Atlas Capital Advisors Llc | 923 | 9 | ||||||
| 2026-01-26 | 13F | Mirae Asset Global Investments Co., Ltd. | 0 | -100,00 | 0 | |||||
| 2026-02-05 | 13F | Northwestern Mutual Investment Management Company, Llc | 61.349 | -1,84 | 624 | -8,52 | ||||
| 2026-01-30 | 13F | Activest Wealth Management | 0 | -100,00 | 0 | |||||
| 2026-02-03 | 13F | Kestrel Investment Management Corp | 551.600 | -3,40 | 6 | -16,67 | ||||
| 2026-02-13 | 13F | Baird Financial Group, Inc. | 25.286 | -0,01 | 257 | -6,55 | ||||
| 2026-02-17 | 13F | Jericho Capital Asset Management L.P. | 8.793.670 | 0,00 | 89.432 | -6,78 | ||||
| 2026-02-13 | 13F | Smartleaf Asset Management LLC | 202 | -15,13 | 2 | 0,00 | ||||
| 2026-02-12 | 13F | Quadrant Capital Group Llc | 8.241 | -0,19 | 84 | -7,78 | ||||
| 2026-02-17 | 13F | Graham Capital Management, L.P. | 60.126 | 611 | ||||||
| 2026-04-08 | 13F | Wealth Enhancement Advisory Services, Llc | 156.088 | 20,60 | 808 | -40,46 | ||||
| 2026-02-13 | 13F | Macquarie Group Ltd | 0 | -100,00 | 0 | -100,00 | ||||
| 2026-01-30 | 13F | Us Bancorp \de\ | 6.249 | 175,41 | 64 | 162,50 | ||||
| 2026-04-21 | 13F | Gilpin Wealth Management, Llc | 65 | 0 | ||||||
| 2026-02-10 | 13F | Performa Ltd (US), LLC | 475 | -11,21 | 5 | -20,00 | ||||
| 2026-04-16 | 13F | SG Americas Securities, LLC | 106.643 | 107,91 | 1 | |||||
| 2026-02-13 | 13F | Parkside Financial Bank & Trust | 673 | 15,44 | 7 | 0,00 | ||||
| 2026-02-03 | 13F | Crossmark Global Holdings, Inc. | 19.266 | 0,86 | 196 | -6,25 | ||||
| 2026-02-11 | 13F | Jpmorgan Chase & Co | 9.130.706 | 33,41 | 92.859 | 24,36 | ||||
| 2026-02-17 | 13F | Man Group plc | Call | 0 | -100,00 | 0 | -100,00 | |||
| 2026-02-09 | 13F | Quest Partners LLC | 44.400 | 7,06 | 452 | -0,22 | ||||
| 2026-02-11 | 13F | Cerity Partners LLC | 1.587.051 | 381,37 | 16.140 | 348,71 | ||||
| 2026-02-20 | 13F/A | Prestige Wealth Management Group LLC | 0 | -100,00 | 0 | |||||
| 2026-04-21 | 13F | Robeco Institutional Asset Management B.V. | 1.191.287 | 70,65 | 7.124 | 0,34 | ||||
| 2026-04-23 | 13F | Forum Financial Management, LP | 0 | -100,00 | 0 | |||||
| 2025-11-07 | 13F | Shell Asset Management Co | 3.989 | -60,07 | 0 | |||||
| 2026-02-17 | 13F | Quantinno Capital Management LP | 1.820.571 | 18.515 | ||||||
| 2026-02-17 | 13F | SageView Advisory Group, LLC | 99 | 1 | ||||||
| 2026-02-12 | 13F | Nuveen, LLC | 403.071 | -17,20 | 4.099 | -22,82 | ||||
| 2026-02-02 | 13F | Hussman Strategic Advisors, Inc. | 147.000 | 40,00 | 1.495 | 30,48 | ||||
| 2026-02-11 | 13F | LPL Financial LLC | 0 | -100,00 | 0 | |||||
| 2026-02-13 | 13F | Colony Group, LLC | 60.476 | 42,16 | 615 | 32,54 | ||||
| 2026-02-11 | 13F | Picton Mahoney Asset Management | 95.166 | 968 | ||||||
| 2026-02-09 | 13F | Hartland & Co., LLC | 1.037 | -82,93 | 11 | -84,85 | ||||
| 2026-02-04 | 13F | Virginia Retirement Systems Et Al | 41.432 | 88,05 | 421 | 75,42 | ||||
| 2026-04-16 | 13F | Capital Advisors, Ltd. LLC | 37 | -13,95 | 0 | |||||
| 2026-02-13 | 13F | Ieq Capital, Llc | 121.589 | -82,13 | 1.237 | -83,35 | ||||
| 2026-02-17 | 13F | Park West Asset Management LLC | 3.500.000 | 92,97 | 35.595 | 79,88 | ||||
| 2026-02-17 | 13F | Contour Asset Management LLC | 0 | -100,00 | 0 | |||||
| 2026-02-11 | 13F | Empowered Funds, LLC | 230.050 | 597,69 | 2.340 | 551,53 | ||||
| 2026-02-17 | 13F | Signature Equity Partners, LLC | 35 | 0 | ||||||
| 2026-04-28 | 13F | Quent Capital, LLC | 645 | -26,37 | 4 | -62,50 | ||||
| 2026-02-11 | 13F | Allianz Asset Management GmbH | 0 | -100,00 | 0 | |||||
| 2026-02-17 | 13F | Ionic Capital Management LLC | 140.504 | 562,94 | 1.429 | 518,18 | ||||
| 2025-11-07 | 13F | Sierra Ocean, Llc | 0 | -100,00 | 0 | |||||
| 2026-02-13 | 13F | Ubs Asset Management Americas Inc | 812.129 | -2,79 | 8.259 | -9,38 | ||||
| 2026-02-12 | 13F | Tocqueville Asset Management L.p. | 205.000 | 46,43 | 2.085 | 36,48 | ||||
| 2026-02-12 | 13F | Dimensional Fund Advisors Lp | 12.108.399 | 15,44 | 123.138 | 7,59 | ||||
| 2026-04-15 | 13F | FNY Investment Advisers, LLC | Call | 100 | -40,83 | 0 | ||||
| 2026-02-13 | 13F | Integrated Wealth Concepts LLC | 0 | -100,00 | 0 | |||||
| 2026-04-22 | 13F | Pictet Asset Management Holding SA | 44.184 | 13,35 | 264 | -33,33 | ||||
| 2026-02-11 | 13F | Cedar Mountain Advisors, LLC | 147 | 0,00 | 1 | 0,00 |