Grundlæggende statistik
| Institutionelle ejere | 154 total, 154 long only, 0 short only, 0 long/short - change of 35,09% MRQ |
| Gennemsnitlig porteføljeallokering | 0.4828 % - change of 44,12% MRQ |
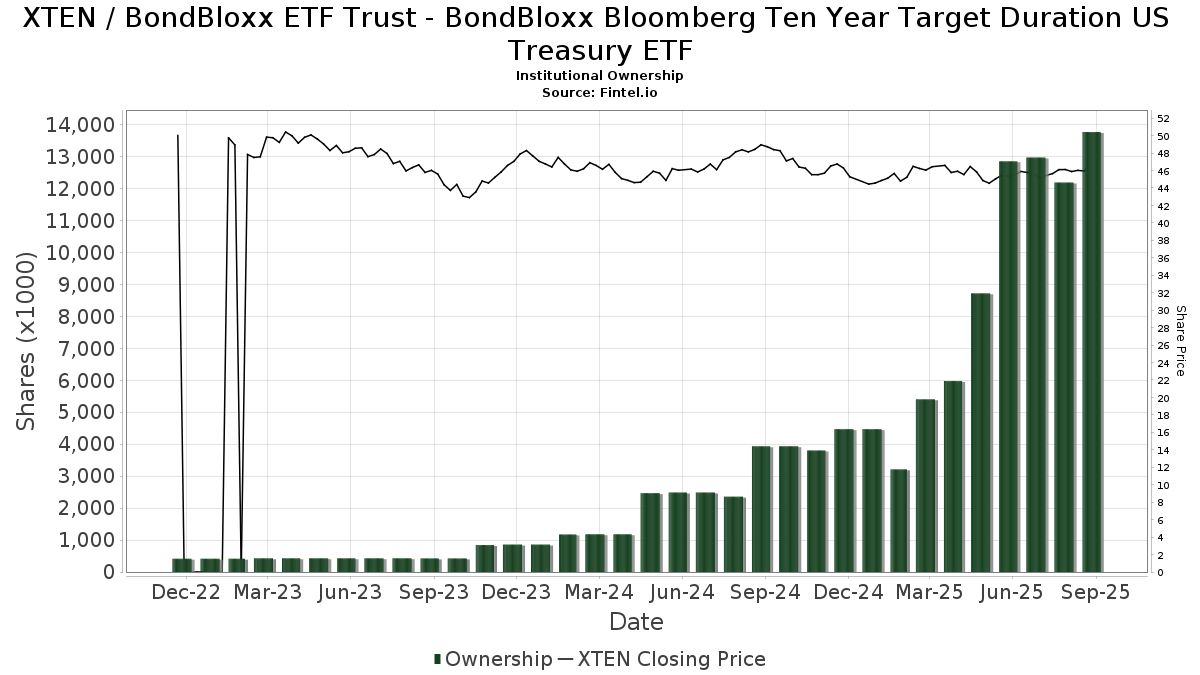
| Institutionelle aktier (lange) | 13.768.103 (ex 13D/G) - change of 0,92MM shares 7,13% MRQ |
| Institutionel værdi (lang) | $ 605.360 USD ($1000) |
Institutionelt ejerskab og aktionærer
BondBloxx ETF Trust - BondBloxx Bloomberg Ten Year Target Duration US Treasury ETF (US:XTEN) har 154 institutionelle ejere og aktionærer, der har indsendt 13D/G- eller 13F-formularer til Securities Exchange Commission (SEC). Disse institutioner har i alt 13,768,103 aktier. Største aktionærer omfatter Resources Investment Advisors, LLC., Prime Capital Investment Advisors, LLC, Jpmorgan Chase & Co, Bank Of America Corp /de/, Envestnet Asset Management Inc, Austin Private Wealth, LLC, MSTRX - Morningstar Total Return Bond Fund, GWM Advisors LLC, Gradient Investments LLC, and Municipal Employees' Retirement System of Michigan .
BondBloxx ETF Trust - BondBloxx Bloomberg Ten Year Target Duration US Treasury ETF (ARCA:XTEN) institutionel ejerskabsstruktur viser aktuelle positioner i virksomheden efter institutioner og fonde, samt seneste ændringer i positionsstørrelse. Større aktionærer kan omfatte individuelle investorer, investeringsforeninger, hedgefonde eller institutioner. Skema 13D angiver, at investoren besidder (eller besidder) mere end 5 % af virksomheden og har til hensigt (eller har til hensigt at) aktivt at forfølge en ændring i forretningsstrategi. Skema 13G indikerer en passiv investering på over 5%.
The share price as of September 17, 2025 is 46,91 / share. Previously, on September 18, 2024, the share price was 48,72 / share. This represents a decline of 3,72% over that period.
Fondens stemningsscore
Fund Sentiment Score (fka Ownership Accumulation Score) finder de aktier, der bliver mest købt af fonde. Det er resultatet af en sofistikeret, multi-faktor kvantitativ model, der identificerer virksomheder med de højeste niveauer af institutionel akkumulering. Scoringsmodellen bruger en kombination af den samlede stigning i oplyste ejere, ændringerne i porteføljeallokeringer i disse ejere og andre målinger. Tallet går fra 0 til 100, hvor højere tal indikerer et højere niveau af akkumulering for sine jævnaldrende, og 50 er gennemsnittet.
Opdateringsfrekvens: Dagligt
Se Ownership Explorer, som giver en liste over højest rangerende virksomheder.
Institutionel Put/Call-forhold
Ud over at indberette standardaktie- og gældsudstedelser skal institutter med mere end 100 mill. aktiver under forvaltning også oplyse deres put- og call-optionsbeholdninger. Da salgsoptioner generelt indikerer negativ stemning, og købsoptioner indikerer positiv stemning, kan vi få en fornemmelse af den overordnede institutionelle stemning ved at plotte forholdet mellem put og kald. Diagrammet til højre viser det historiske put/call-forhold for dette instrument.
Brug af Put/Call Ratio som en indikator for investorernes stemning overvinder en af de vigtigste mangler ved at bruge totalt institutionelt ejerskab, som er, at en betydelig mængde af aktiver under forvaltning investeres passivt for at spore indekser. Passivt forvaltede fonde køber typisk ikke optioner, så indikatoren for put/call-forholdet følger mere nøje følelsen af aktivt forvaltede fonde.
13F og NPORT arkivering
Detaljer om 13F-arkivering er gratis. Detaljer om NP-ansøgninger kræver et premium-medlemskab. Grønne rækker angiver nye positioner. Røde rækker angiver lukkede positioner. Klik på linket ikon for at se den fulde transaktionshistorik.
Opgrader
for at låse premium-data op og eksportere til Excel ![]() .
.
| Fil dato | Kilde | Investor | Type | Gennemsnitlig pris (Øst) |
Aktier | Δ Aktier (%) |
Rapporteret Værdi ($1000) |
Δ Værdi (%) |
Port Alloc (%) |
|
|---|---|---|---|---|---|---|---|---|---|---|
| 2025-07-23 | 13F | Heck Capital Advisors, LLC | 178.049 | 5,19 | 8.219 | 4,25 | ||||
| 2025-08-08 | 13F | Cetera Investment Advisers | 97.591 | 21,93 | 4.505 | 20,85 | ||||
| 2025-07-30 | NP | AGGA - Astoria Dynamic Core US Fixed Income ETF | 96.702 | 4.391 | ||||||
| 2025-08-01 | 13F | Brookwood Investment Group LLC | 14.779 | 31,53 | 682 | 30,40 | ||||
| 2025-04-16 | 13F | New Century Financial Group, LLC | 0 | -100,00 | 0 | -100,00 | ||||
| 2025-07-10 | 13F | Focus Financial Network, Inc. | 111.758 | 114,31 | 5.159 | 112,44 | ||||
| 2025-08-11 | 13F | CFS Investment Advisory Services, LLC | 90.083 | 140,57 | 4 | 300,00 | ||||
| 2025-08-13 | 13F | Elios Financial Group Inc. | 27.362 | 1.263 | ||||||
| 2025-08-11 | 13F | Pineridge Advisors LLC | 5.490 | 253 | ||||||
| 2025-08-12 | 13F | SRS Capital Advisors, Inc. | 284 | 13 | ||||||
| 2025-08-04 | 13F | Spire Wealth Management | 1.895 | 99,89 | 87 | 97,73 | ||||
| 2025-08-05 | 13F | Fullcircle Wealth Llc | 23.801 | 92,16 | 1.099 | 91,80 | ||||
| 2025-08-07 | 13F | PFG Advisors | 105.666 | 99,81 | 4.878 | 98,09 | ||||
| 2025-08-13 | 13F | Vertex Planning Partners, LLC | 33.012 | 125,80 | 1.524 | 123,97 | ||||
| 2025-08-11 | 13F | Cornerstone Planning Group LLC | 25 | 316,67 | 1 | |||||
| 2025-08-14 | 13F | Smartleaf Asset Management LLC | 22.202 | 1.944,38 | 1.019 | 1.936,00 | ||||
| 2025-08-04 | 13F | Merkkuri Wealth Advisors LLC | 24.472 | 186,36 | 1.130 | 184,38 | ||||
| 2025-08-13 | 13F | M Holdings Securities, Inc. | 13.901 | 1 | ||||||
| 2025-07-29 | 13F | Horst & Graben Wealth Management LLC | 385.027 | 96,95 | 17.773 | 95,21 | ||||
| 2025-07-23 | 13F | WESPAC Advisors, LLC | 4.636 | 214 | ||||||
| 2025-07-30 | 13F | Caliber Wealth Management, LLC / KS | 7.835 | 362 | ||||||
| 2025-07-11 | 13F | Farther Finance Advisors, LLC | 2.275 | 34,93 | 105 | 34,62 | ||||
| 2025-08-06 | 13F | AE Wealth Management LLC | 265.723 | 126,01 | 12.266 | 124,02 | ||||
| 2025-08-08 | 13F | Gts Securities Llc | 9.401 | 434 | ||||||
| 2025-08-14 | 13F | Ausdal Financial Partners, Inc. | 6.828 | 315 | ||||||
| 2025-08-13 | 13F | Transce3nd, LLC | 1.503 | 38,91 | 69 | 38,00 | ||||
| 2025-05-12 | 13F | C2P Capital Advisory Group, LLC d.b.a. Prosperity Capital Advisors | 0 | -100,00 | 0 | -100,00 | ||||
| 2025-07-22 | 13F | Firethorn Wealth Partners, Llc | 23.236 | 105,28 | 1.073 | 103,42 | ||||
| 2025-08-14 | 13F | Comerica Bank | 103.429 | -86,32 | 4.774 | -86,45 | ||||
| 2025-08-14 | 13F | Jane Street Group, Llc | 107.764 | 322,32 | 4.974 | 318,69 | ||||
| 2025-07-10 | 13F | Oliver Lagore Vanvalin Investment Group | 47 | 2 | ||||||
| 2025-08-14 | 13F | Arete Wealth Advisors, LLC | 6.816 | 0 | ||||||
| 2025-08-13 | 13F | Twin Peaks Wealth Advisors, LLC | 467 | 21 | ||||||
| 2025-08-14 | 13F | Mariner, LLC | 5.829 | 269 | ||||||
| 2025-08-12 | 13F | Investor's Fiduciary Advisor Network, LLC | 21.713 | 1 | ||||||
| 2025-07-30 | 13F | Eqis Capital Management, Inc. | 0 | -100,00 | 0 | |||||
| 2025-09-04 | 13F/A | Advisor Group Holdings, Inc. | 7.141 | 90,17 | 330 | 89,08 | ||||
| 2025-07-15 | 13F | Spectrum Planning & Advisory Services Inc. | 13.156 | -25,85 | 607 | -26,51 | ||||
| 2025-07-07 | 13F | OMNI 360 Wealth, Inc. | 11.136 | 514 | ||||||
| 2025-08-14 | 13F | Redwood Investment Management, Llc | 53.746 | 2 | ||||||
| 2025-08-06 | 13F | Golden State Wealth Management, LLC | 84 | 4 | ||||||
| 2025-08-13 | 13F | Maia Wealth LLC | 60.518 | 115,82 | 2.793 | 118,89 | ||||
| 2025-08-11 | 13F | Empowered Funds, LLC | 53.253 | 2.450 | ||||||
| 2025-07-14 | 13F | Legacy Capital Group California, Inc. | 8.638 | 10,35 | 399 | 9,34 | ||||
| 2025-08-14 | 13F | Citadel Advisors Llc | 9.890 | -40,37 | 457 | -40,93 | ||||
| 2025-07-01 | 13F | Bush Investment Group, Llc | 39.682 | 107,92 | 1.832 | 106,19 | ||||
| 2025-07-23 | 13F | Clear Creek Financial Management, LLC | 10.017 | -34,35 | 462 | -34,93 | ||||
| 2025-08-14 | 13F | Gen-Wealth Partners Inc | 32.852 | 93,45 | 1.516 | 91,90 | ||||
| 2025-07-08 | 13F | Nbc Securities, Inc. | 58 | 0 | ||||||
| 2025-07-10 | 13F | Wealth Enhancement Advisory Services, Llc | 18.512 | 4,10 | 844 | 1,93 | ||||
| 2025-08-01 | 13F | Transcend Wealth Collective, Llc | 10.993 | 41,08 | 507 | 40,06 | ||||
| 2025-08-12 | 13F | BlackRock, Inc. | 6.427 | 14,08 | 297 | 12,98 | ||||
| 2025-08-13 | 13F | GeoWealth Management, LLC | 293 | 3.562,50 | 14 | |||||
| 2025-08-06 | 13F | Tradewinds, LLC. | 24.472 | 1.130 | ||||||
| 2025-07-17 | 13F | Tempus Wealth Planning, LLC | 30.251 | 140,72 | 1.396 | 138,63 | ||||
| 2025-08-01 | 13F | Envestnet Asset Management Inc | 733.740 | 48,29 | 33.869 | 46,98 | ||||
| 2025-08-14 | 13F | Royal Bank Of Canada | 3.273 | 197,28 | 151 | 196,08 | ||||
| 2025-07-29 | 13F | Clearview Wealth Advisors LLC | 40.944 | 107,02 | 1.890 | 105,10 | ||||
| 2025-08-01 | 13F | Ashton Thomas Private Wealth, LLC | 66.554 | 180,61 | 3.072 | 178,26 | ||||
| 2025-07-10 | 13F | Signal Advisors Wealth, LLC | 15.983 | 738 | ||||||
| 2025-08-04 | 13F | Municipal Employees' Retirement System of Michigan | 403.452 | 0,00 | 19 | 0,00 | ||||
| 2025-08-05 | 13F | Scarborough Advisors, LLC | 222 | 10 | ||||||
| 2025-08-18 | 13F | Geneos Wealth Management Inc. | 5.760 | 42,89 | 266 | 41,71 | ||||
| 2025-07-25 | 13F | Northwest Capital Management Inc | 31.637 | -15,81 | 1.460 | -16,57 | ||||
| 2025-07-28 | 13F | WealthPlan Investment Management, LLC | 44.893 | 2.072 | ||||||
| 2025-08-12 | 13F | Global Retirement Partners, LLC | 17.551 | 810 | ||||||
| 2025-07-30 | 13F | WESPAC Advisors SoCal, LLC | 180.202 | 199,59 | 8.318 | 196,97 | ||||
| 2025-08-04 | 13F | Creative Financial Designs Inc /adv | 18.482 | 105,31 | 853 | 103,58 | ||||
| 2025-06-30 | NP | ASTIX - Astor Dynamic Allocation Fund Class I shares | 98.409 | 4.571 | ||||||
| 2025-07-21 | 13F | Catalina Capital Group, LLC | 16.664 | 122,66 | 769 | 120,98 | ||||
| 2025-08-12 | 13F | LPL Financial LLC | 46.950 | 49,78 | 2.167 | 48,53 | ||||
| 2025-07-22 | 13F | Beacon Financial Advisory LLC | 19.956 | 137,18 | 921 | 135,55 | ||||
| 2025-06-26 | NP | MSTRX - Morningstar Total Return Bond Fund | 572.996 | 0,00 | 26.616 | 2,95 | ||||
| 2025-07-24 | 13F | MSH Capital Advisors LLC | 16.080 | 742 | ||||||
| 2025-07-18 | 13F | Cooper Financial Group | 0 | -100,00 | 0 | |||||
| 2025-07-25 | 13F | We Are One Seven, LLC | 15.867 | 43,70 | 732 | 42,41 | ||||
| 2025-08-12 | 13F | Jpmorgan Chase & Co | 1.345.190 | 86,94 | 62.094 | 85,30 | ||||
| 2025-07-11 | 13F | My Legacy Advisors, LLC | 60.744 | 121,48 | 2.770 | 116,84 | ||||
| 2025-07-07 | 13F | RDA Financial Network | 29.723 | 111,46 | 1.372 | 109,79 | ||||
| 2025-08-05 | 13F | Hutchens & Kramer Investment Management Group, LLC | 0 | -100,00 | 0 | |||||
| 2025-07-23 | 13F | Nbt Bank N A /ny | 88 | 4 | ||||||
| 2025-07-09 | 13F | Beacon Financial Group | 4.991 | 230 | ||||||
| 2025-08-14 | 13F | CoreCap Advisors, LLC | 659 | 309,32 | 30 | 328,57 | ||||
| 2025-07-21 | 13F | Ameritas Advisory Services, LLC | 197 | 9 | ||||||
| 2025-08-01 | 13F | Austin Private Wealth, LLC | 577.059 | 109,52 | 26.637 | 107,68 | ||||
| 2025-08-13 | 13F | Hobbs Wealth Management, LLC | 26.434 | 104,12 | 1.220 | 102,32 | ||||
| 2025-07-21 | 13F | Patriot Financial Group Insurance Agency, LLC | 34.727 | 78,66 | 1.603 | 77,02 | ||||
| 2025-07-08 | 13F | Ehrlich Financial Group | 77.348 | 213,78 | 3.570 | 211,25 | ||||
| 2025-08-12 | 13F | Tradition Wealth Management, LLC | 94.644 | 121,44 | 4.369 | 119,50 | ||||
| 2025-08-15 | 13F | Kestra Advisory Services, LLC | 24.483 | 130,60 | 1.130 | 128,74 | ||||
| 2025-07-08 | 13F | Range Financial Group LLC | 26.794 | 60,60 | 1.237 | 59,28 | ||||
| 2025-07-18 | 13F | B.O.S.S. Retirement Advisors, LLC | 4.891 | 226 | ||||||
| 2025-07-10 | 13F | Sovran Advisors, LLC | 10.891 | 106,78 | 493 | 105,42 | ||||
| 2025-08-07 | 13F | Resources Investment Advisors, LLC. | 1.738.891 | 22,59 | 80.267 | 21,51 | ||||
| 2025-07-14 | 13F | Sowell Financial Services LLC | 9.798 | 452 | ||||||
| 2025-07-08 | 13F | Paladin Wealth, LLC | 15.292 | 15,39 | 706 | 14,26 | ||||
| 2025-08-14 | 13F | IHT Wealth Management, LLC | 13.621 | 629 | ||||||
| 2025-08-07 | 13F | Allworth Financial LP | 391 | 18 | ||||||
| 2025-08-12 | 13F | PSI Advisors, LLC | 0 | -100,00 | 0 | |||||
| 2025-08-13 | 13F | Argyle Capital Partners, LLC | 6.714 | 2,68 | 310 | 1,64 | ||||
| 2025-08-14 | 13F | Pinnacle Family Advisors, LLC | 10.817 | 101,40 | 499 | 99,60 | ||||
| 2025-08-07 | 13F | Verus Capital Partners, Llc | 26.723 | 1.234 | ||||||
| 2025-07-28 | 13F | WealthPLAN Partners, LLC | 49.455 | 114,34 | 2.283 | 112,48 | ||||
| 2025-08-06 | 13F | First Horizon Advisors, Inc. | 0 | -100,00 | 0 | |||||
| 2025-05-01 | 13F | Quest 10 Wealth Builders, Inc. | 294 | 14 | ||||||
| 2025-08-07 | 13F | Apeiron RIA LLC | 85.209 | 254,92 | 3.933 | 251,79 | ||||
| 2025-08-14 | 13F | Goldman Sachs Group Inc | 0 | -100,00 | 0 | |||||
| 2025-07-31 | 13F | Cambridge Investment Research Advisors, Inc. | 6.438 | 0 | ||||||
| 2025-07-09 | 13F | Lifelong Wealth Advisors, Inc. | 49.264 | 134,20 | 2.274 | 132,28 | ||||
| 2025-08-04 | 13F | Family Wealth Group, LLC | 4.444 | 205 | ||||||
| 2025-08-12 | 13F | WealthTrak Capital Management LLC | 17.289 | 159,36 | 798 | 157,42 | ||||
| 2025-08-14 | 13F | Fmr Llc | 139 | 0,72 | 6 | 0,00 | ||||
| 2025-08-12 | 13F | Maripau Wealth Management Llc | 14.656 | 677 | ||||||
| 2025-05-20 | 13F | Belpointe Asset Management LLC | 0 | -100,00 | 0 | |||||
| 2025-07-18 | 13F | Astor Investment Management LLC | 72 | 3 | ||||||
| 2025-08-12 | 13F | Proequities, Inc. | 0 | 0 | ||||||
| 2025-08-14 | 13F | Bank Of America Corp /de/ | 928.641 | 47,94 | 42.866 | 46,64 | ||||
| 2025-07-08 | 13F | Gradient Investments LLC | 434.151 | 6,29 | 20.040 | 5,35 | ||||
| 2025-07-22 | 13F | Ffg Retirement Advisors Llc | 150.211 | 23,78 | 6.934 | 22,69 | ||||
| 2025-07-30 | 13F | Syntegra Private Wealth Group, LLC | 20.934 | 966 | ||||||
| 2025-07-30 | 13F | LGT Financial Advisors LLC | 218 | 113,73 | 10 | 150,00 | ||||
| 2025-08-11 | 13F | Resurgent Financial Advisors LLC | 13.391 | 109,76 | 618 | 108,08 | ||||
| 2025-08-13 | 13F | EverSource Wealth Advisors, LLC | 763 | 44,78 | 35 | 45,83 | ||||
| 2025-08-11 | 13F | Theory Financial Llc | 80.538 | 116,59 | 3.681 | 112,59 | ||||
| 2025-07-28 | 13F | Morningstar Investment Management LLC | 0 | -100,00 | 0 | |||||
| 2025-07-22 | 13F | Duncan Williams Asset Management, LLC | 15.936 | 736 | ||||||
| 2025-08-04 | 13F | Integrity Alliance, Llc. | 0 | -100,00 | 0 | |||||
| 2025-07-29 | 13F | Mattson Financial Services, LLC | 49.706 | 6,53 | 2.294 | 5,62 | ||||
| 2025-05-02 | 13F | Capital A Wealth Management, LLC | 145 | 7 | ||||||
| 2025-05-13 | 13F | UBS Group AG | 0 | -100,00 | 0 | |||||
| 2025-08-11 | 13F | Wealthgarden F.s. Llc | 6.739 | 308 | ||||||
| 2025-08-05 | 13F | Plante Moran Financial Advisors, LLC | 0 | -100,00 | 0 | |||||
| 2025-07-17 | 13F | Western Financial Corp/CA | 10.335 | 67,10 | 477 | 65,63 | ||||
| 2025-08-12 | 13F | Nemes Rush Group LLC | 11.841 | 33,30 | 547 | 32,20 | ||||
| 2025-08-14 | 13F | Susquehanna International Group, Llp | 35.001 | -32,89 | 1.616 | -33,48 | ||||
| 2025-07-28 | 13F | Harbour Investments, Inc. | 32.624 | 111,30 | 1.506 | 109,32 | ||||
| 2025-07-28 | 13F | Cypress Wealth Services, LLC | 38.462 | 23,94 | 1.775 | 22,84 | ||||
| 2025-07-14 | 13F | U.S. Capital Wealth Advisors, LLC | 4.394 | 203 | ||||||
| 2025-07-22 | 13F | Kickstand Ventures, Llc. | 15.936 | -3,90 | 736 | -4,79 | ||||
| 2025-07-30 | 13F | Strategic Blueprint, LLC | 27.592 | 100,48 | 1.274 | 98,91 | ||||
| 2025-08-15 | 13F | Morgan Stanley | 27 | 1 | ||||||
| 2025-05-15 | 13F | Two Sigma Securities, Llc | 0 | -100,00 | 0 | -100,00 | ||||
| 2025-07-24 | 13F | M1 Capital Management LLC | 57.786 | 123,82 | 2.667 | 121,88 | ||||
| 2025-07-17 | 13F | LexAurum Advisors, LLC | 9.418 | 28,70 | 435 | 27,65 | ||||
| 2025-08-25 | 13F | Fulcrum Equity Management | 12.082 | 116,68 | 558 | 115,06 | ||||
| 2025-08-11 | 13F | HighTower Advisors, LLC | 23.940 | -2,79 | 1.105 | -3,58 | ||||
| 2025-07-29 | 13F | Empirical Asset Management, LLC | 12.998 | 600 | ||||||
| 2025-08-11 | 13F | Private Advisor Group, LLC | 14.156 | 82,28 | 653 | 80,89 | ||||
| 2025-07-31 | 13F | MN Wealth Advisors, LLC | 6.115 | 282 | ||||||
| 2025-08-14 | 13F | GWM Advisors LLC | 448.021 | 27,67 | 20.681 | 26,55 | ||||
| 2025-05-14 | 13F | Flow Traders U.s. Llc | 0 | -100,00 | 0 | |||||
| 2025-07-30 | 13F | Avidian Wealth Solutions, LLC | 32.771 | 113,42 | 1.513 | 111,47 | ||||
| 2025-08-15 | 13F | Semmax Financial Advisors Inc. | 19.333 | 120,65 | 888 | 122,86 | ||||
| 2025-07-18 | 13F | Tanager Wealth Management LLP | 48.290 | -50,82 | 2.229 | -51,25 | ||||
| 2025-07-23 | 13F | Prime Capital Investment Advisors, LLC | 1.373.413 | -60,30 | 63.397 | -60,65 | ||||
| 2025-07-31 | 13F | Strait & Sound Wealth Management LLC | 7.032 | -0,54 | 325 | -1,52 | ||||
| 2025-08-14 | 13F | Mml Investors Services, Llc | 12.693 | 99,80 | 1 | |||||
| 2025-05-15 | 13F | Hrt Financial Lp | 0 | -100,00 | 0 | |||||
| 2025-08-04 | 13F | Mayflower Financial Advisors, LLC | 109.684 | 100,33 | 5.063 | 98,63 | ||||
| 2025-07-17 | 13F | One Wealth Advisors, LLC | 306.163 | 101,72 | 14.132 | 99,94 | ||||
| 2025-07-08 | 13F | Richard P Slaughter Associates Inc | 96.970 | 4.476 | ||||||
| 2025-07-31 | 13F | TSA Wealth Managment LLC | 144.503 | 3,15 | 6.670 | 2,25 | ||||
| 2025-08-07 | 13F | Nwam Llc | 19.466 | 94,87 | 889 | 90,97 | ||||
| 2025-07-22 | 13F | Sutton Place Investors Llc | 26.173 | 93,07 | 1.208 | 91,44 | ||||
| 2025-07-25 | 13F | Cwm, Llc | 43.546 | 14,70 | 2 | 100,00 | ||||
| 2025-07-28 | 13F | Mutual Advisors, LLC | 18.535 | 844 | ||||||
| 2025-08-19 | 13F | Advisory Services Network, LLC | 11.955 | 110,03 | 546 | 106,04 | ||||
| 2025-08-13 | 13F | StoneX Group Inc. | 6.806 | 314 | ||||||
| 2025-08-13 | 13F | West Wealth Group, LLC | 85.571 | 22,51 | 3.944 | 21,09 | ||||
| 2025-07-25 | 13F | Envestnet Portfolio Solutions, Inc. | 4.953 | -34,21 | 229 | -34,86 | ||||
| 2025-08-15 | 13F | Brown Financial Advisors | 29.440 | -3,50 | 1.359 | -4,37 |