Grundlæggende statistik
| Institutionelle ejere | 92 total, 91 long only, 1 short only, 0 long/short - change of 17,95% MRQ |
| Gennemsnitlig porteføljeallokering | 0.0668 % - change of 40,04% MRQ |
| Institutionelle aktier (lange) | 43.491.793 (ex 13D/G) - change of 37,06MM shares 576,13% MRQ |
| Institutionel værdi (lang) | $ 871.785 USD ($1000) |
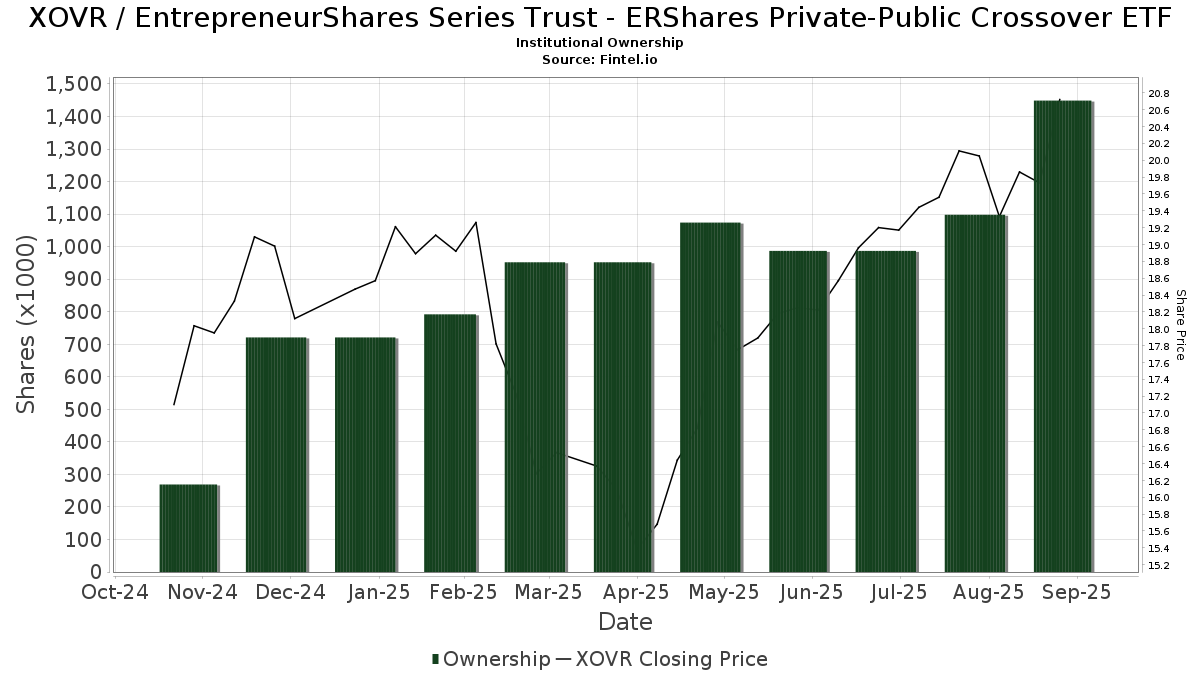
Institutionelt ejerskab og aktionærer
EntrepreneurShares Series Trust - ERShares Private-Public Crossover ETF (US:XOVR) har 92 institutionelle ejere og aktionærer, der har indsendt 13D/G- eller 13F-formularer til Securities Exchange Commission (SEC). Disse institutioner har i alt 43,491,793 aktier. Største aktionærer omfatter Gts Securities Llc, Bank Of America Corp /de/, Jain Global LLC, Jane Street Group, Llc, Susquehanna International Group, Llp, Raymond James Financial Inc, Wealth Quarterback LLC, Elequin Capital Lp, Farther Finance Advisors, LLC, and LPL Financial LLC .
EntrepreneurShares Series Trust - ERShares Private-Public Crossover ETF (NasdaqGM:XOVR) institutionel ejerskabsstruktur viser aktuelle positioner i virksomheden efter institutioner og fonde, samt seneste ændringer i positionsstørrelse. Større aktionærer kan omfatte individuelle investorer, investeringsforeninger, hedgefonde eller institutioner. Skema 13D angiver, at investoren besidder (eller besidder) mere end 5 % af virksomheden og har til hensigt (eller har til hensigt at) aktivt at forfølge en ændring i forretningsstrategi. Skema 13G indikerer en passiv investering på over 5%.
The share price as of April 24, 2026 is 18,77 / share. Previously, on April 28, 2025, the share price was 16,33 / share. This represents an increase of 14,94% over that period.
Fondens stemningsscore
Fund Sentiment Score (fka Ownership Accumulation Score) finder de aktier, der bliver mest købt af fonde. Det er resultatet af en sofistikeret, multi-faktor kvantitativ model, der identificerer virksomheder med de højeste niveauer af institutionel akkumulering. Scoringsmodellen bruger en kombination af den samlede stigning i oplyste ejere, ændringerne i porteføljeallokeringer i disse ejere og andre målinger. Tallet går fra 0 til 100, hvor højere tal indikerer et højere niveau af akkumulering for sine jævnaldrende, og 50 er gennemsnittet.
Opdateringsfrekvens: Dagligt
Se Ownership Explorer, som giver en liste over højest rangerende virksomheder.
AI+ Ask Fintel’s AI assistant about EntrepreneurShares Series Trust - ERShares Private-Public Crossover ETF.
Select a question to share a public post with an AI-crafted answer.
Thinking of good questions…
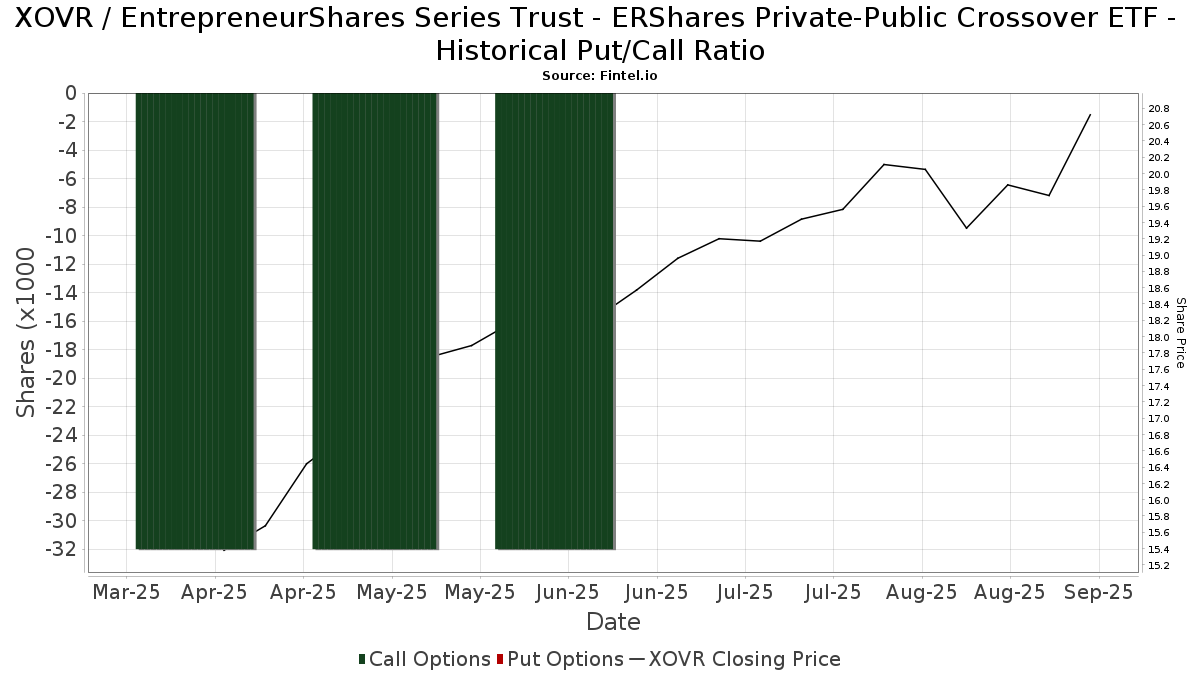
Institutionel Put/Call-forhold
Ud over at indberette standardaktie- og gældsudstedelser skal institutter med mere end 100 mill. aktiver under forvaltning også oplyse deres put- og call-optionsbeholdninger. Da salgsoptioner generelt indikerer negativ stemning, og købsoptioner indikerer positiv stemning, kan vi få en fornemmelse af den overordnede institutionelle stemning ved at plotte forholdet mellem put og kald. Diagrammet til højre viser det historiske put/call-forhold for dette instrument.
Brug af Put/Call Ratio som en indikator for investorernes stemning overvinder en af de vigtigste mangler ved at bruge totalt institutionelt ejerskab, som er, at en betydelig mængde af aktiver under forvaltning investeres passivt for at spore indekser. Passivt forvaltede fonde køber typisk ikke optioner, så indikatoren for put/call-forholdet følger mere nøje følelsen af aktivt forvaltede fonde.
13F og NPORT arkivering
Detaljer om 13F-arkivering er gratis. Detaljer om NP-ansøgninger kræver et premium-medlemskab. Grønne rækker angiver nye positioner. Røde rækker angiver lukkede positioner. Klik på linket ikon for at se den fulde transaktionshistorik.
Opgrader
for at låse premium-data op og eksportere til Excel ![]() .
.
| Fil dato | Kilde | Investor | Type | Gennemsnitlig pris (Øst) |
Aktier | Δ Aktier (%) |
Rapporteret Værdi ($1000) |
Δ Værdi (%) |
Port Alloc (%) |
|
|---|---|---|---|---|---|---|---|---|---|---|
| 2026-02-17 | 13F | Susquehanna International Group, Llp | 529.984 | 1.591,19 | 10.674 | 1.514,67 | ||||
| 2026-04-27 | 13F | Pensionmark Financial Group, Llc | 13.069 | -29,86 | 221 | -41,33 | ||||
| 2026-02-09 | 13F | CBIZ Investment Advisory Services, LLC | 10 | 0 | ||||||
| 2026-02-12 | 13F | Summit Financial, LLC | 18.101 | 49,02 | 365 | 42,19 | ||||
| 2026-04-07 | 13F | Farther Finance Advisors, LLC | 204.650 | -14,22 | 3.469 | -27,81 | ||||
| 2025-11-03 | 13F | Pittenger & Anderson Inc | 0 | -100,00 | 0 | |||||
| 2026-04-13 | 13F | IFP Advisors, Inc | 5.636 | 66,45 | 95 | 39,71 | ||||
| 2026-02-13 | 13F | Morgan Stanley | 1.605 | 237,89 | 32 | 220,00 | ||||
| 2026-02-17 | 13F | Citadel Advisors Llc | Put | 10.100 | 203 | |||||
| 2026-04-22 | 13F | Janney Montgomery Scott LLC | 10.276 | 0 | ||||||
| 2026-02-13 | 13F | SRS Capital Advisors, Inc. | 100 | 2 | ||||||
| 2026-02-13 | 13F | Gts Securities Llc | 19.520.662 | 53.144,95 | 393.146 | 50.694,06 | ||||
| 2025-11-12 | 13F | ETF Store, Inc. | 0 | -100,00 | 0 | |||||
| 2025-11-12 | 13F | Creekmur Asset Management LLC | 800 | 0,00 | 17 | 6,67 | ||||
| 2026-02-13 | 13F | National Bank Of Canada /fi/ | 499 | 24,75 | 10 | 25,00 | ||||
| 2026-04-15 | 13F | Seacrest Wealth Management, Llc | 28.622 | -3,46 | 483 | -20,95 | ||||
| 2026-04-21 | 13F | Financial Consulate, Inc | 23 | 0,00 | 0 | |||||
| 2026-02-11 | 13F | Parallel Advisors, LLC | 724 | -6,70 | 15 | -12,50 | ||||
| 2026-04-22 | 13F | Spire Wealth Management | 200 | 0,00 | 3 | -25,00 | ||||
| 2026-04-23 | 13F | Oppenheimer & Co Inc | 24.005 | -60,51 | 405 | -66,91 | ||||
| 2026-02-13 | 13F | MAI Capital Management | 1.051 | 0,00 | 21 | -4,55 | ||||
| 2026-02-13 | 13F | Parkside Financial Bank & Trust | 0 | -100,00 | 0 | |||||
| 2026-02-12 | 13F | Jane Street Group, Llc | 659.953 | 13.291 | ||||||
| 2026-01-26 | 13F | AE Wealth Management LLC | 59.709 | 16,79 | 1.203 | 11,40 | ||||
| 2026-02-13 | 13F | Wells Fargo & Company/mn | 101 | 10.000,00 | 2 | |||||
| 2026-02-12 | 13F | Jane Street Group, Llc | Call | 31.600 | -6,78 | 636 | -11,05 | |||
| 2026-04-01 | 13F | Vigilare Wealth Management | 0 | -100,00 | 0 | |||||
| 2026-02-05 | 13F | Tucker Asset Management Llc | 3.205 | 65 | ||||||
| 2026-02-17 | 13F | Advisor Group Holdings, Inc. | 1.150 | -0,35 | 23 | 0,00 | ||||
| 2026-02-17 | 13F | Fmr Llc | 5.221 | 1.595,13 | 105 | 1.650,00 | ||||
| 2026-04-08 | 13F | Olistico Wealth, LLC | 0 | -100,00 | 0 | |||||
| 2026-04-21 | 13F | Alpine Bank Wealth Management | 10.000 | 0,00 | 169 | -16,42 | ||||
| 2026-01-16 | 13F | Tempus Wealth Planning, LLC | 30.000 | 604 | ||||||
| 2026-02-17 | 13F | Warren Averett Asset Management, LLC | 31.507 | 12,79 | 635 | 7,64 | ||||
| 2026-02-17 | 13F | Cetera Investment Advisers | 98.279 | -7,24 | 1.979 | -11,53 | ||||
| 2026-04-08 | 13F | Thompson Investment Management, Inc. | 360 | 0,00 | 6 | -14,29 | ||||
| 2026-04-22 | 13F | Onyx Bridge Wealth Group LLC | 22.618 | 39,55 | 382 | 17,18 | ||||
| 2026-01-06 | 13F | Ransom Advisory, Ltd | 1.500 | 30 | ||||||
| 2026-02-11 | 13F | Simplex Trading, Llc | 0 | -100,00 | 0 | |||||
| 2026-01-23 | 13F | Keener Financial Planning LLC | 0 | -100,00 | 0 | |||||
| 2026-02-12 | 13F | Steward Partners Investment Advisory, Llc | 3.058 | 28,06 | 62 | 22,00 | ||||
| 2026-02-10 | 13F | Belvedere Trading LLC | Call | 10.800 | -47,57 | 218 | -50,11 | |||
| 2025-11-14 | 13F | Strategic Wealth Partners, Ltd. | 264 | 0,00 | 6 | 0,00 | ||||
| 2026-04-23 | 13F | Catalyst Investment Management LLC | 0 | -100,00 | 0 | |||||
| 2026-02-10 | 13F | Belvedere Trading LLC | 10.656 | 28,15 | 215 | 22,29 | ||||
| 2026-04-02 | 13F | Aspect Partners, LLC | 450 | 0,00 | 8 | -22,22 | ||||
| 2026-04-15 | 13F | Financial Management Professionals, Inc. | 500 | 0,00 | 8 | -20,00 | ||||
| 2026-02-05 | 13F | Cambridge Investment Research Advisors, Inc. | 21.318 | 27,39 | 0 | |||||
| 2026-04-21 | 13F | Keystone Financial Group, Inc. | 11 | 0,00 | 0 | |||||
| 2026-01-29 | 13F | D.a. Davidson & Co. | 76.579 | 1.542 | ||||||
| 2026-02-13 | 13F | Beck Capital Management, Llc | 9.982 | -3,26 | 201 | -7,37 | ||||
| 2026-04-17 | 13F | Roxbury Financial LLC | 341 | 0,00 | 6 | -16,67 | ||||
| 2026-04-22 | 13F | Pasadena Private Wealth, LLC | 10.240 | 173 | ||||||
| 2026-01-30 | 13F | Arlington Trust Co LLC | 0 | -100,00 | 0 | |||||
| 2026-01-30 | 13F | American Capital Advisory, LLC | 2.000 | 0,00 | 40 | -4,76 | ||||
| 2026-02-11 | 13F | Group One Trading, L.p. | 2.734 | 3,48 | 55 | 0,00 | ||||
| 2026-04-15 | 13F | Merit Financial Group, LLC | 17.823 | 301 | ||||||
| 2026-02-17 | 13F | Advisory Services Network, LLC | 10.250 | 2,60 | 206 | -1,90 | ||||
| 2025-11-03 | 13F | TD Waterhouse Canada Inc. | 0 | -100,00 | 0 | |||||
| 2026-04-10 | 13F | M & L Capital Management Ltd | 0 | -100,00 | 0 | |||||
| 2026-02-10 | 13F/A | Northwestern Mutual Wealth Management Co | 6.301 | 27,99 | 127 | 22,33 | ||||
| 2026-02-09 | 13F | Blue Bell Private Wealth Management, Llc | 250 | 0,00 | 5 | 0,00 | ||||
| 2026-03-31 | 13F/A | Henson-Edgewater Management, LLC | 123.149 | 2.480 | ||||||
| 2026-04-08 | 13F | Accel Wealth Management | 12.280 | 207 | ||||||
| 2026-02-17 | 13F | Royal Bank Of Canada | 632 | -97,92 | 13 | -97,97 | ||||
| 2026-02-05 | 13F | Allworth Financial LP | 2.000 | 40 | ||||||
| 2026-02-06 | 13F | Gables Capital Management Inc. | 500 | 10 | ||||||
| 2026-02-13 | 13F | Kestra Advisory Services, LLC | 4.852 | 98 | ||||||
| 2025-11-13 | 13F | Total Investment Management Inc | 0 | -100,00 | 0 | |||||
| 2026-02-12 | 13F | Principal Securities, Inc. | 0 | -100,00 | 0 | -100,00 | ||||
| 2026-02-11 | 13F | LPL Financial LLC | 160.209 | 98,18 | 3.227 | 88,99 | ||||
| 2026-02-12 | 13F | JT Stratford LLC | 32.249 | 36,32 | 649 | 30,06 | ||||
| 2026-02-12 | 13F | Benson Wealth Management INC | 13.622 | 274 | ||||||
| 2025-11-14 | 13F | Two Sigma Investments, Lp | 0 | -100,00 | 0 | |||||
| 2026-02-17 | 13F | Elequin Capital Lp | 250.000 | 5.035 | ||||||
| 2026-04-13 | 13F | Mather Group, Llc. | 40 | 1 | ||||||
| 2026-01-26 | 13F | Cwm, Llc | 3.675 | 71,25 | 0 | |||||
| 2026-04-17 | 13F | Fifth Third Wealth Advisors LLC | 0 | -100,00 | 0 | |||||
| 2026-02-13 | 13F | Stifel Financial Corp | 100.087 | -24,70 | 2.016 | -28,22 | ||||
| 2026-02-09 | 13F | Harbour Investments, Inc. | 2.183 | 4,80 | 44 | 0,00 | ||||
| 2026-02-18 | 13F | GWM Advisors LLC | 34.243 | -11,05 | 690 | -15,25 | ||||
| 2026-02-13 | 13F | Mariner, LLC | 38.621 | 9,02 | 778 | 3,88 | ||||
| 2026-02-09 | 13F | Kingsview Wealth Management, LLC | 0 | -100,00 | 0 | |||||
| 2026-02-12 | 13F | Fox Hill Wealth Management | 19.096 | 385 | ||||||
| 2026-04-07 | 13F | Signaturefd, Llc | 828 | 43,25 | 14 | 18,18 | ||||
| 2026-01-29 | 13F | IMC-Chicago, LLC | 34.947 | -99,13 | 704 | -99,17 | ||||
| 2026-02-17 | 13F | Jain Global LLC | 2.000.000 | 40.280 | ||||||
| 2026-04-10 | 13F | AssuredPartners Investment Advisors, LLC | 46.414 | -6,26 | 791 | -20,66 | ||||
| 2026-04-14 | 13F | Wealthcare Advisory Partners LLC | 42.070 | 18,73 | 711 | -0,42 | ||||
| 2026-02-11 | 13F | Sharpepoint Llc | 13.555 | 273 | ||||||
| 2026-04-13 | 13F | Creative Financial Designs Inc /adv | 1.800 | 0,00 | 30 | -16,67 | ||||
| 2026-02-17 | 13F | Bank Of America Corp /de/ | 18.033.449 | 29.294,85 | 363.194 | 27.945,79 | ||||
| 2026-02-06 | 13F | Csenge Advisory Group | 12.891 | 260 | ||||||
| 2026-04-27 | 13F | Carter Financial Group, INC. | 33.221 | -3,61 | 561 | -19,16 | ||||
| 2026-01-20 | 13F | American National Bank | 0 | -100,00 | 0 | |||||
| 2026-04-08 | 13F | Wealth Enhancement Advisory Services, Llc | 10.131 | -76,78 | 172 | -80,78 | ||||
| 2026-04-27 | 13F | Truist Financial Corp | 46.724 | 3,59 | 789 | -13,11 | ||||
| 2026-04-24 | 13F | Essex Financial Services, Inc. | 14.364 | 26,06 | 243 | 5,68 | ||||
| 2026-02-04 | 13F | Atlantic Union Bankshares Corp | 1.531 | -6,13 | 31 | -11,76 | ||||
| 2026-04-17 | 13F | Western Pacific Wealth Management, LP | 3.221 | 0,00 | 54 | -15,62 | ||||
| 2026-04-21 | 13F | OneAscent Financial Services LLC | 10.100 | 171 | ||||||
| 2026-02-17 | 13F | Citadel Advisors Llc | 0 | -100,00 | 0 | -100,00 | ||||
| 2026-02-12 | 13F | BlackRock, Inc. | 791 | -34,68 | 16 | -40,00 | ||||
| 2026-02-17 | 13F | Citadel Advisors Llc | Call | 0 | -100,00 | 0 | -100,00 | |||
| 2026-02-17 | 13F | Raymond James Financial Inc | 487.593 | -26,36 | 9.820 | -29,77 | ||||
| 2026-02-06 | 13F | Pnc Financial Services Group, Inc. | 1.027 | 21 | ||||||
| 2026-02-12 | 13F | Federation des caisses Desjardins du Quebec | 6.711 | 0,00 | 135 | -4,26 | ||||
| 2026-04-17 | 13F | Total Clarity Wealth Management, Inc. | 38.300 | 647 | ||||||
| 2026-01-28 | 13F | N.E.W. Advisory Services LLC | 261 | 0,00 | 5 | 0,00 | ||||
| 2026-02-12 | 13F | Commonwealth Equity Services, Llc | 19.886 | -9,23 | 401 | |||||
| 2026-01-29 | 13F | UBS Group AG | 48 | -52,00 | 1 | -100,00 | ||||
| 2026-04-09 | 13F | Wealth Quarterback LLC | 363.923 | 6.147 | ||||||
| 2026-02-10 | 13F | JTC Employer Solutions Trusteee Ltd | 14.192 | 0,00 | 0 |