Grundlæggende statistik
| Institutionelle aktier (lange) | 297.424.008 - 120,63% (ex 13D/G) - change of -17,91MM shares -5,68% MRQ |
| Institutionel værdi (lang) | $ 834.312 USD ($1000) |
Institutionelt ejerskab og aktionærer
Petco Health and Wellness Company, Inc. (US:WOOF) har 209 institutionelle ejere og aktionærer, der har indsendt 13D/G- eller 13F-formularer til Securities Exchange Commission (SEC). Disse institutioner har i alt 297,424,008 aktier. Største aktionærer omfatter CVC Management Holdings II Ltd., Canada Pension Plan Investment Board, Dimensional Fund Advisors Lp, Vanguard Group Inc, BlackRock, Inc., Long Focus Capital Management, Llc, Holocene Advisors, LP, Fmr Llc, Nuveen, LLC, and Two Sigma Investments, Lp .
Petco Health and Wellness Company, Inc. (NasdaqGS:WOOF) institutionel ejerskabsstruktur viser aktuelle positioner i virksomheden efter institutioner og fonde, samt seneste ændringer i positionsstørrelse. Større aktionærer kan omfatte individuelle investorer, investeringsforeninger, hedgefonde eller institutioner. Skema 13D angiver, at investoren besidder (eller besidder) mere end 5 % af virksomheden og har til hensigt (eller har til hensigt at) aktivt at forfølge en ændring i forretningsstrategi. Skema 13G indikerer en passiv investering på over 5%.
The share price as of April 27, 2026 is 2,97 / share. Previously, on April 28, 2025, the share price was 3,16 / share. This represents a decline of 6,01% over that period.

Fondens stemningsscore
Fund Sentiment Score (fka Ownership Accumulation Score) finder de aktier, der bliver mest købt af fonde. Det er resultatet af en sofistikeret, multi-faktor kvantitativ model, der identificerer virksomheder med de højeste niveauer af institutionel akkumulering. Scoringsmodellen bruger en kombination af den samlede stigning i oplyste ejere, ændringerne i porteføljeallokeringer i disse ejere og andre målinger. Tallet går fra 0 til 100, hvor højere tal indikerer et højere niveau af akkumulering for sine jævnaldrende, og 50 er gennemsnittet.
Opdateringsfrekvens: Dagligt
Se Ownership Explorer, som giver en liste over højest rangerende virksomheder.
AI+ Ask Fintel’s AI assistant about Petco Health and Wellness Company, Inc..
Select a question to share a public post with an AI-crafted answer.
Thinking of good questions…
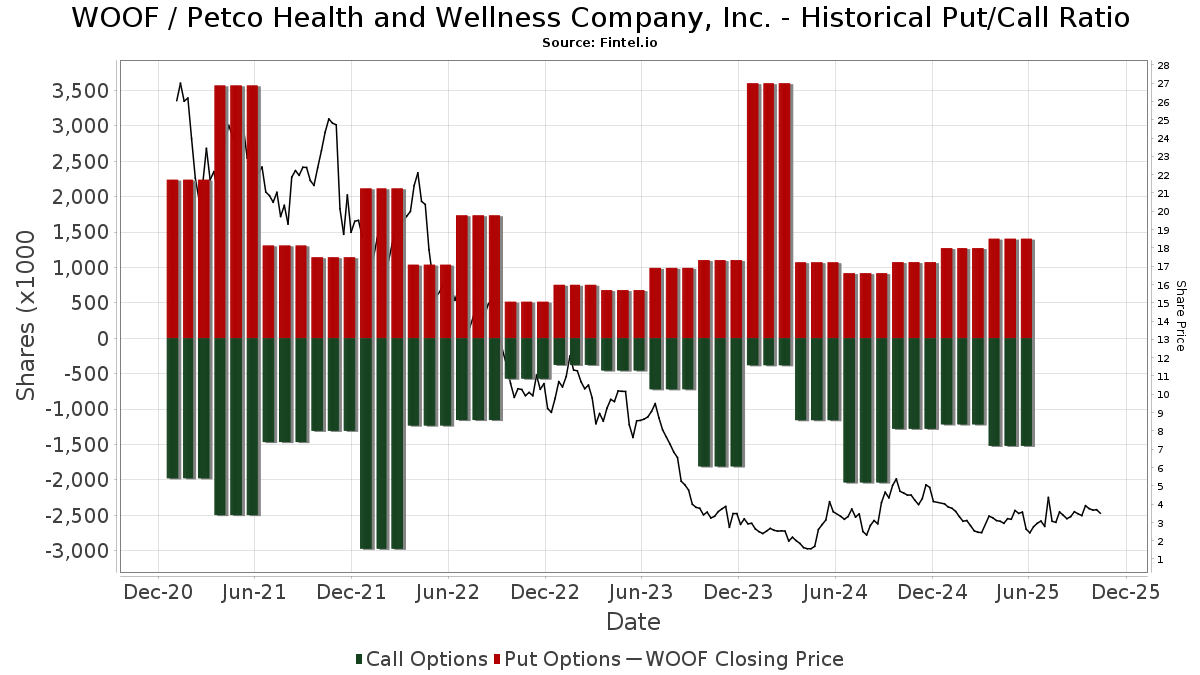
Institutionel Put/Call-forhold
Ud over at indberette standardaktie- og gældsudstedelser skal institutter med mere end 100 mill. aktiver under forvaltning også oplyse deres put- og call-optionsbeholdninger. Da salgsoptioner generelt indikerer negativ stemning, og købsoptioner indikerer positiv stemning, kan vi få en fornemmelse af den overordnede institutionelle stemning ved at plotte forholdet mellem put og kald. Diagrammet til højre viser det historiske put/call-forhold for dette instrument.
Brug af Put/Call Ratio som en indikator for investorernes stemning overvinder en af de vigtigste mangler ved at bruge totalt institutionelt ejerskab, som er, at en betydelig mængde af aktiver under forvaltning investeres passivt for at spore indekser. Passivt forvaltede fonde køber typisk ikke optioner, så indikatoren for put/call-forholdet følger mere nøje følelsen af aktivt forvaltede fonde.
13F og NPORT arkivering
Detaljer om 13F-arkivering er gratis. Detaljer om NP-ansøgninger kræver et premium-medlemskab. Grønne rækker angiver nye positioner. Røde rækker angiver lukkede positioner. Klik på linket ikon for at se den fulde transaktionshistorik.
Opgrader
for at låse premium-data op og eksportere til Excel ![]() .
.
| Fil dato | Kilde | Investor | Type | Gennemsnitlig pris (Øst) |
Aktier | Δ Aktier (%) |
Rapporteret Værdi ($1000) |
Δ Værdi (%) |
Port Alloc (%) |
|
|---|---|---|---|---|---|---|---|---|---|---|
| 2026-02-17 | 13F | Graham Capital Management, L.P. | 158.714 | 0,17 | 446 | -27,41 | ||||
| 2026-02-13 | 13F | Victory Capital Management Inc | 15.916 | 1,91 | 45 | -26,67 | ||||
| 2026-01-26 | 13F | Cwm, Llc | 93.631 | -11,54 | 0 | |||||
| 2026-02-17 | 13F | Citadel Advisors Llc | 544.274 | -48,59 | 1.529 | -62,68 | ||||
| 2026-01-15 | 13F | Nisa Investment Advisors, Llc | 957 | 0,00 | 3 | -33,33 | ||||
| 2026-02-17 | 13F | Citadel Advisors Llc | Put | 265.500 | -2,71 | 746 | -29,36 | |||
| 2026-01-20 | 13F | Relyea Zuckerberg Hanson LLC | 23.121 | 0,00 | 65 | -28,09 | ||||
| 2026-01-21 | 13F | Future Financial Wealth Managment LLC | 0 | -100,00 | 0 | |||||
| 2026-02-17 | 13F | Citadel Advisors Llc | Call | 127.000 | -14,07 | 357 | -37,65 | |||
| 2026-02-13 | 13F | JustInvest LLC | 30.428 | 11,80 | 86 | -19,05 | ||||
| 2026-02-17 | 13F | XTX Topco Ltd | 56.577 | -60,42 | 159 | -71,43 | ||||
| 2026-02-10 | 13F | Intech Investment Management Llc | 33.698 | 0,00 | 95 | -27,69 | ||||
| 2026-04-17 | 13F | Krilogy Financial LLC | 14.265 | -8,32 | 43 | -4,44 | ||||
| 2026-02-10 | 13F/A | Northwestern Mutual Wealth Management Co | 3 | 0,00 | 0 | |||||
| 2025-11-14 | 13F | Point72 Asset Management, L.P. | Call | 0 | -100,00 | 0 | -100,00 | |||
| 2026-02-05 | 13F | Elyxium Wealth, LLC | 1.041 | 3 | ||||||
| 2025-11-14 | 13F | Skopos Labs, Inc. | 0 | -100,00 | 0 | |||||
| 2026-02-17 | 13F | Jones Financial Companies Lllp | 2.782 | 9,06 | 8 | -12,50 | ||||
| 2025-11-10 | 13F | Advyzon Investment Management, LLC | 0 | -100,00 | 0 | |||||
| 2026-02-13 | 13F | Ieq Capital, Llc | 191.469 | -17,93 | 538 | -40,35 | ||||
| 2026-02-10 | 13F | State of Wyoming | 63.308 | 225,81 | 178 | 136,00 | ||||
| 2026-02-13 | 13F | Dynamic Technology Lab Private Ltd | 347.793 | 977 | ||||||
| 2026-04-14 | 13F | Prospera Financial Services Inc | 17.673 | 0,00 | 49 | 0,00 | ||||
| 2026-01-21 | 13F | Newbridge Financial Services Group, Inc. | 100 | 0 | ||||||
| 2025-11-14 | 13F | Qtron Investments LLC | 0 | -100,00 | 0 | |||||
| 2026-01-28 | 13F | Teacher Retirement System Of Texas | 0 | -100,00 | 0 | |||||
| 2026-02-17 | 13F | Northern Trust Corp | 660.849 | -3,66 | 1.857 | -30,07 | ||||
| 2026-02-02 | 13F | Alpha Wealth Funds, LLC | 0 | -100,00 | 0 | |||||
| 2026-04-16 | 13F | Diversified Trust Co | 0 | -100,00 | 0 | |||||
| 2026-02-12 | 13F | Jane Street Group, Llc | 798.551 | -12,34 | 2.244 | -36,37 | ||||
| 2026-02-13 | 13F | Walleye Trading LLC | Put | 16.500 | 157,81 | 46 | 91,67 | |||
| 2026-02-12 | 13F | Jane Street Group, Llc | Put | 17.100 | -49,26 | 48 | -63,08 | |||
| 2026-02-12 | 13F | Jane Street Group, Llc | Call | 56.600 | 77,99 | 159 | 29,27 | |||
| 2026-02-17 | 13F | Quadrature Capital Ltd | 0 | -100,00 | 0 | |||||
| 2025-10-28 | 13F | BRYN MAWR TRUST Co | 213 | 0,00 | 1 | |||||
| 2026-02-13 | 13F | Caitong International Asset Management Co., Ltd | 10.523 | 425,10 | 30 | 314,29 | ||||
| 2026-02-13 | 13F | Walleye Trading LLC | Call | 11.600 | 1,75 | 33 | -27,27 | |||
| 2026-02-17 | 13F | Cresset Asset Management, LLC | 2.516.380 | 0,00 | 7.071 | -27,39 | ||||
| 2026-02-13 | 13F | Wells Fargo & Company/mn | 126.598 | 31,05 | 356 | -4,83 | ||||
| 2026-02-17 | 13F | Royal Bank Of Canada | 18.101 | 9,26 | 51 | -20,31 | ||||
| 2026-02-13 | 13F | Umb Bank N A/mo | 200 | 1 | ||||||
| 2026-02-17 | 13F | Price T Rowe Associates Inc /md/ | 66.312 | 0,00 | 0 | |||||
| 2026-02-13 | 13F | Squarepoint Ops LLC | Put | 13.600 | -2,16 | 38 | -28,30 | |||
| 2026-01-23 | 13F | Westside Investment Management, Inc. | 2.000 | 0,00 | 6 | -28,57 | ||||
| 2026-02-13 | 13F | Squarepoint Ops LLC | 16.864 | -81,36 | 47 | -86,57 | ||||
| 2026-04-16 | 13F | Poinciana Advisors Group, Llc | 20.199 | 0,00 | 56 | 0,00 | ||||
| 2026-02-12 | 13F | Quadrant Capital Group Llc | 11.551 | -4,47 | 32 | -30,43 | ||||
| 2025-11-14 | 13F | Cubist Systematic Strategies, LLC | Put | 17.700 | 0,00 | 68 | 36,00 | |||
| 2026-02-10 | 13F | Quantbot Technologies LP | 1.828 | -78,95 | 5 | -84,85 | ||||
| 2026-02-10 | 13F | Jupiter Asset Management Ltd | 0 | -100,00 | 0 | |||||
| 2025-11-14 | 13F | Aigen Investment Management, Lp | 0 | -100,00 | 0 | |||||
| 2026-02-13 | 13F | Kestra Advisory Services, LLC | 0 | -100,00 | 0 | |||||
| 2026-02-17 | 13F | Public Employees Retirement System Of Ohio | 66.230 | 771,68 | 186 | 541,38 | ||||
| 2026-04-20 | 13F | Kestra Private Wealth Services, Llc | 12.802 | 5,78 | 36 | 2,94 | ||||
| 2026-02-13 | 13F | SRS Capital Advisors, Inc. | 3.900 | -90,70 | 11 | -93,83 | ||||
| 2025-11-14 | 13F | Raymond James Financial Inc | 0 | -100,00 | 0 | -100,00 | ||||
| 2026-02-13 | 13F | Sei Investments Co | 109.629 | 326,44 | 308 | 211,11 | ||||
| 2026-02-17 | 13F | Lotus Technology Management, LP | 125.948 | 354 | ||||||
| 2026-02-04 | 13F | Beverly Hills Private Wealth, LLC | 10.200 | 0,00 | 39 | 0,00 | ||||
| 2026-02-11 | 13F | Group One Trading, L.p. | 24.928 | 146,45 | 70 | 79,49 | ||||
| 2026-02-13 | 13F | Quarry LP | 3.581 | -63,40 | 10 | -72,97 | ||||
| 2025-11-13 | 13F | Clear Street Markets Llc | 0 | -100,00 | 0 | -100,00 | ||||
| 2026-02-05 | 13F | Cambridge Investment Research Advisors, Inc. | 22.725 | 29,65 | 0 | |||||
| 2026-01-22 | 13F | Brookwood Investment Group LLC | 10.000 | 0,00 | 28 | -26,32 | ||||
| 2026-02-05 | 13F | Gabelli Funds Llc | 40.000 | 0,00 | 112 | -27,27 | ||||
| 2026-01-30 | 13F | Mitsubishi UFJ Trust & Banking Corp | 92.231 | 8,02 | 259 | -21,52 | ||||
| 2026-02-17 | 13F | Dark Forest Capital Management Lp | 0 | -100,00 | 0 | -100,00 | ||||
| 2026-02-14 | 13F | Rockefeller Capital Management L.P. | 23.500 | 14,57 | 66 | -16,46 | ||||
| 2025-11-14 | 13F | ExodusPoint Capital Management, LP | 0 | -100,00 | 0 | |||||
| 2026-02-17 | 13F | Oxford Asset Management Llp | 17.055 | -71,86 | 48 | -79,91 | ||||
| 2026-04-22 | 13F | Pictet Asset Management Holding SA | 11.894 | 0,00 | 33 | 0,00 | ||||
| 2026-02-06 | 13F | Gsa Capital Partners Llp | 78.611 | -79,51 | 0 | -100,00 | ||||
| 2026-01-29 | 13F | Vanguard Group Inc | 8.625.352 | 2,48 | 24.237 | -25,59 | ||||
| 2026-02-10 | 13F | Norges Bank | 105.328 | 296 | ||||||
| 2026-02-11 | 13F | Ameritas Investment Partners, Inc. | 8.134 | 23 | ||||||
| 2026-02-13 | 13F | Rhumbline Advisers | 102.993 | -13,84 | 289 | -37,45 | ||||
| 2026-02-13 | 13F | Truvestments Capital Llc | 200 | 0,00 | 1 | |||||
| 2026-04-14 | 13F | Corecam Pte. Ltd. | 29.540 | 33,51 | 82 | 32,26 | ||||
| 2026-02-12 | 13F | Voya Investment Management Llc | 14.678 | 0,00 | 41 | -26,79 | ||||
| 2026-02-17 | 13F | Boothbay Fund Management, Llc | 11.254 | -14,02 | 32 | -38,00 | ||||
| 2026-02-10 | 13F | Acadian Asset Management Llc | 87.314 | 64,53 | 0 | |||||
| 2026-02-13 | 13F | Panagora Asset Management Inc | 340.003 | -0,59 | 955 | -27,82 | ||||
| 2026-02-17 | 13F | Voleon Capital Management Lp | 0 | -100,00 | 0 | |||||
| 2026-02-17 | 13F | Two Sigma Investments, Lp | 2.916.820 | 10,54 | 8.196 | -19,73 | ||||
| 2026-02-13 | 13F | Charles Schwab Investment Management Inc | 2.614.877 | 23,98 | 7.348 | -9,99 | ||||
| 2026-02-13 | 13F | Walleye Capital LLC | 13.529 | 38 | ||||||
| 2026-02-13 | 13F | Walleye Capital LLC | Call | 12.100 | 0,00 | 34 | -26,09 | |||
| 2026-02-13 | 13F | Mariner, LLC | 0 | -100,00 | 0 | |||||
| 2026-02-10 | 13F | Axq Capital, Lp | 16.843 | 47 | ||||||
| 2026-02-06 | 13F | Lsv Asset Management | 25.500 | 0,00 | 0 | |||||
| 2026-02-13 | 13F | Stifel Financial Corp | 27.755 | 78 | ||||||
| 2026-02-17 | 13F | Cetera Investment Advisers | 21.555 | -2,07 | 61 | -29,41 | ||||
| 2026-02-17 | 13F | Two Sigma Advisers, Lp | 2.554.600 | -3,84 | 7.178 | -30,18 | ||||
| 2026-01-16 | 13F | Legacy Capital Wealth Partners, LLC | 34.783 | 0,00 | 98 | -27,61 | ||||
| 2026-04-24 | 13F | Root Financial Partners, LLC | 86 | 0 | ||||||
| 2026-02-13 | 13F | Walleye Capital LLC | Put | 34.900 | 98 | |||||
| 2026-02-17 | 13F | Brevan Howard Capital Management LP | 42.776 | -45,62 | 120 | -60,53 | ||||
| 2026-04-16 | 13F | SG Americas Securities, LLC | 65.661 | -27,37 | 0 | |||||
| 2026-02-09 | 13F | Hartland & Co., LLC | 0 | -100,00 | 0 | |||||
| 2026-02-17 | 13F | Aqr Capital Management Llc | 1.922.459 | -5,26 | 5.402 | -26,86 | ||||
| 2025-11-14 | 13F | Atom Investors LP | 0 | -100,00 | 0 | |||||
| 2026-02-17 | 13F | Captrust Financial Advisors | 23.530 | -0,41 | 66 | -27,47 | ||||
| 2026-01-27 | 13F | Brighton Jones Llc | 0 | -100,00 | 0 | |||||
| 2026-02-10 | 13F | CIBC World Markets Inc. | 11.290 | 32 | ||||||
| 2026-02-13 | 13F | Quinn Opportunity Partners LLC | 490.285 | -3,92 | 1.378 | -30,24 | ||||
| 2026-02-17 | 13F | Janus Henderson Group Plc | 38.265 | 0,00 | 107 | -27,21 | ||||
| 2026-02-11 | 13F | Parallel Advisors, LLC | 1.148 | -7,87 | 3 | -25,00 | ||||
| 2026-01-28 | 13F | Arizona State Retirement System | 26.973 | -5,37 | 76 | -31,82 | ||||
| 2026-02-17 | 13F | D. E. Shaw & Co., Inc. | 617.313 | 559,42 | 1.735 | 379,01 | ||||
| 2026-02-17 | 13F | Mangrove Partners | 87.563 | 246 | ||||||
| 2026-04-22 | 13F | Sterling Capital Management LLC | 2.697 | -36,73 | 7 | -36,36 | ||||
| 2026-02-04 | 13F | Versor Investments LP | 112.500 | 316 | ||||||
| 2026-02-13 | 13F | Colony Group, LLC | 18.557 | -11,24 | 52 | -35,00 | ||||
| 2026-02-13 | 13F | Morgan Stanley | 1.081.040 | -68,26 | 3.038 | -76,96 | ||||
| 2026-01-28 | 13F | Klp Kapitalforvaltning As | 40.400 | 87,91 | 114 | 36,14 | ||||
| 2026-02-13 | 13F | Arrowstreet Capital, Limited Partnership | 0 | -100,00 | 0 | |||||
| 2026-02-03 | 13F | SBI Securities Co., Ltd. | 821 | -38,78 | 2 | -60,00 | ||||
| 2026-02-10 | 13F | Goldman Sachs Group Inc | 1.346.327 | -48,38 | 3.783 | -62,51 | ||||
| 2026-02-06 | 13F | New Millennium Group LLC | 0 | -100,00 | 0 | |||||
| 2026-02-04 | 13F | Virginia Retirement Systems Et Al | 15.600 | -67,50 | 44 | -76,76 | ||||
| 2026-02-09 | 13F | Harbour Investments, Inc. | 16 | 0 | ||||||
| 2026-02-17 | 13F | Point72 Asset Management, L.P. | 337.067 | 231,32 | 947 | 140,97 | ||||
| 2025-11-05 | 13F | Bessemer Group Inc | 0 | -100,00 | 0 | |||||
| 2026-01-06 | 13F | Sanctuary Advisors, LLC | 0 | -100,00 | 0 | |||||
| 2026-02-06 | 13F | Pnc Financial Services Group, Inc. | 5.401 | -0,72 | 15 | -28,57 | ||||
| 2026-02-17 | 13F | Scientech Research LLC | 12.100 | 34 | ||||||
| 2026-01-29 | 13F | Quent Capital, LLC | 566 | -12,25 | 2 | -50,00 | ||||
| 2026-02-17 | 13F | Woodline Partners LP | 94.734 | -52,05 | 266 | -65,18 | ||||
| 2026-02-17 | 13F | Bayesian Capital Management, LP | 0 | -100,00 | 0 | |||||
| 2026-02-17 | 13F | Susquehanna International Group, Llp | Put | 92.600 | -55,07 | 260 | -67,38 | |||
| 2026-02-17 | 13F | Susquehanna International Group, Llp | Call | 466.100 | 3,35 | 1.310 | -24,99 | |||
| 2026-02-11 | 13F | Cerity Partners LLC | 214.425 | 79,93 | 603 | 30,59 | ||||
| 2026-02-17 | 13F | NCP Inc. | 600 | 2 | ||||||
| 2026-02-17 | 13F | Susquehanna International Group, Llp | 59.377 | -50,25 | 167 | -63,99 | ||||
| 2026-02-17 | 13F | Jump Financial, LLC | 308.074 | 866 | ||||||
| 2026-04-09 | 13F | Wedmont Private Capital | 16.948 | -4,02 | 48 | -9,62 | ||||
| 2026-02-12 | 13F | MetLife Investment Management, LLC | 31.886 | -34,54 | 90 | -52,66 | ||||
| 2026-02-17 | 13F | Summit Trail Advisors, Llc | 752.397 | 0,10 | 2.114 | -27,30 | ||||
| 2026-02-10 | 13F | Savant Capital, LLC | 0 | -100,00 | 0 | |||||
| 2026-02-12 | 13F | BlackRock, Inc. | 8.096.627 | -1,13 | 22.752 | -28,21 | ||||
| 2026-04-13 | 13F | True Wealth Design, LLC | 610 | -41,40 | 2 | -50,00 | ||||
| 2026-02-05 | 13F | Amalgamated Bank | 2.496 | -11,17 | 0 | |||||
| 2026-02-17 | 13F | State Of Wisconsin Investment Board | 143.301 | -11,48 | 403 | -35,78 | ||||
| 2025-11-14 | 13F | Wolverine Trading, Llc | 10.229 | -88,60 | 37 | -85,38 | ||||
| 2025-11-14 | 13F | Wolverine Trading, Llc | Call | 78.500 | 11,03 | 285 | 42,00 | |||
| 2026-02-17 | 13F | Sherbrooke Park Advisers Llc | 74.128 | 275,07 | 208 | 173,68 | ||||
| 2025-11-14 | 13F | Wolverine Trading, Llc | Put | 24.600 | -89,33 | 89 | -86,35 | |||
| 2025-11-13 | 13F | Eisler Capital Management Ltd. | Call | 0 | -100,00 | 0 | ||||
| 2026-02-12 | 13F | Hrt Financial Lp | 0 | -100,00 | 0 | |||||
| 2026-04-24 | 13F | ProShare Advisors LLC | 375.613 | -12,93 | 1.044 | -13,86 | ||||
| 2026-02-13 | 13F | Citigroup Inc | 2.362 | -66,78 | 7 | -77,78 | ||||
| 2025-11-10 | 13F | Towle & Co | 0 | -100,00 | 0 | |||||
| 2025-11-13 | 13F | Eisler Capital Management Ltd. | 0 | -100,00 | 0 | |||||
| 2026-02-11 | 13F | Deutsche Bank Ag\ | 16.127 | -80,86 | 45 | -86,20 | ||||
| 2026-02-17 | 13F | Shay Capital LLC | 25.000 | 70 | ||||||
| 2026-02-17 | 13F | Union Square Park Capital Management, LLC | 0 | -100,00 | 0 | |||||
| 2026-01-29 | 13F | Cornerstone Investment Partners, LLC | 37.717 | 0,06 | 106 | -27,59 | ||||
| 2026-02-17 | 13F | Gotham Asset Management, LLC | 319.035 | 33,92 | 896 | -2,71 | ||||
| 2026-01-29 | 13F | Comerica Bank | 12 | -57,14 | 0 | |||||
| 2026-04-15 | 13F | Merit Financial Group, LLC | 0 | -100,00 | 0 | |||||
| 2026-02-17 | 13F | Deerfield Management Company, L.p. (series C) | 936.309 | 2.631 | ||||||
| 2026-02-17 | 13F | Aster Capital Management (DIFC) Ltd | 767 | -56,02 | 2 | -66,67 | ||||
| 2026-02-12 | 13F | Counterpoint Mutual Funds LLC | 0 | -100,00 | 0 | |||||
| 2026-02-05 | 13F | Allworth Financial LP | 944 | -11,69 | 3 | -50,00 | ||||
| 2026-02-13 | 13F | Rice Hall James & Associates, Llc | 418.362 | -14,35 | 1.176 | -37,83 | ||||
| 2026-02-13 | 13F | American Century Companies Inc | 175.592 | 4,15 | 493 | -24,39 | ||||
| 2026-02-10 | 13F | Bnp Paribas Arbitrage, Sa | 31.651 | -90,56 | 89 | -93,22 | ||||
| 2026-02-12 | 13F | Renaissance Technologies Llc | 0 | -100,00 | 0 | -100,00 | ||||
| 2026-04-07 | 13F | Farther Finance Advisors, LLC | 987 | 9,18 | 3 | 0,00 | ||||
| 2026-02-17 | 13F | Advisor Group Holdings, Inc. | 15.537 | -3,27 | 44 | -27,12 | ||||
| 2026-02-23 | 13F | Mv Capital Management, Inc. | 38 | 0,00 | 0 | |||||
| 2026-02-17 | 13F | Russell Investments Group, Ltd. | 97.723 | 610,35 | 275 | 416,98 | ||||
| 2026-02-13 | 13F | Verition Fund Management LLC | 100.066 | 19,88 | 281 | -13,00 | ||||
| 2026-02-11 | 13F | LPL Financial LLC | 20.491 | -27,47 | 58 | -47,71 | ||||
| 2026-01-29 | 13F | Concurrent Investment Advisors, LLC | 34.856 | 166,81 | 98 | 94,00 | ||||
| 2026-02-17 | 13F | Bank Of America Corp /de/ | 252.764 | -69,49 | 710 | -77,85 | ||||
| 2026-02-26 | 13F/A | Alpine Global Management, LLC | 62.190 | 175 | ||||||
| 2026-04-21 | 13F | PharVision Advisers, LLC | 0 | -100,00 | 0 | |||||
| 2025-11-14 | 13F | Susquehanna Fundamental Investments, Llc | 0 | -100,00 | 0 | |||||
| 2026-02-17 | 13F | Tower Research Capital LLC (TRC) | 8.624 | 135,89 | 24 | 71,43 | ||||
| 2026-01-08 | 13F | Armstrong Advisory Group, Inc | 0 | -100,00 | 0 | |||||
| 2026-02-17 | 13F | California State Teachers Retirement System | 86.407 | -1,53 | 243 | -28,61 | ||||
| 2025-11-14 | 13F | J. Goldman & Co LP | 0 | -100,00 | 0 | -100,00 | ||||
| 2026-02-17 | 13F | Engineers Gate Manager LP | 0 | -100,00 | 0 | |||||
| 2025-11-13 | 13F | Wells Fargo & Company/mn | Put | 0 | -100,00 | 0 | -100,00 | |||
| 2026-02-13 | 13F | Police & Firemen's Retirement System of New Jersey | 22.152 | 0,00 | 62 | -27,06 | ||||
| 2026-01-27 | 13F | Financial Management Professionals, Inc. | 0 | -100,00 | 0 | |||||
| 2026-02-06 | 13F | Covestor Ltd | 2.786 | 0,00 | 0 | |||||
| 2026-01-20 | 13F | Harbor Capital Advisors, Inc. | 1.764 | -1,67 | 0 | |||||
| 2026-02-10 | 13F | Connor, Clark & Lunn Investment Management Ltd. | 1.361.262 | -23,96 | 3.825 | -44,78 | ||||
| 2026-02-04 | 13F | Shade Tree Advisors LLC | 34.400 | 0,00 | 97 | -27,82 | ||||
| 2026-02-13 | 13F | Parkside Financial Bank & Trust | 788 | 0,00 | 2 | -33,33 | ||||
| 2026-02-13 | 13F | Smartleaf Asset Management LLC | 281 | 0,00 | 1 | -100,00 | ||||
| 2025-11-24 | 13F | CIBC Private Wealth Group, LLC | 0 | -100,00 | 0 | |||||
| 2026-04-07 | 13F | Signaturefd, Llc | 4.528 | 6,24 | 13 | 9,09 | ||||
| 2026-04-22 | 13F | Smallwood Wealth Investment Management, LLC | 5 | 0,00 | 0 | |||||
| 2026-02-10 | 13F | Bank of New York Mellon Corp | 380.409 | 52,12 | 1.069 | 10,44 | ||||
| 2026-04-13 | 13F | IFP Advisors, Inc | 17 | -79,01 | 0 | |||||
| 2026-02-17 | 13F | Creative Planning | 39.083 | -4,27 | 110 | -30,57 | ||||
| 2026-02-12 | 13F | DRW Securities, LLC | 11.043 | -32,76 | 31 | -50,79 | ||||
| 2025-11-04 | 13F | Mutual Advisors, LLC | 0 | -100,00 | 0 | |||||
| 2026-02-12 | 13F | Dimensional Fund Advisors Lp | 9.455.494 | 1,54 | 26.571 | -26,26 | ||||
| 2026-02-11 | 13F | Empowered Funds, LLC | 1.331.169 | -12,02 | 3.741 | -36,12 | ||||
| 2026-02-06 | 13F | EverSource Wealth Advisors, LLC | 3.486 | -0,03 | 10 | -30,77 | ||||
| 2026-02-12 | 13F | Candlestick Capital Management LP | 0 | -100,00 | 0 | |||||
| 2026-02-17 | 13F | Schonfeld Strategic Advisors LLC | 38.513 | 108 | ||||||
| 2026-02-17 | 13F | Susquehanna Portfolio Strategies, LLC | 0 | -100,00 | 0 | -100,00 | ||||
| 2026-02-17 | 13F | Abel Hall, LLC | 11.182 | 31 | ||||||
| 2026-02-13 | 13F | Bank Of Nova Scotia | 10.889 | -27,96 | 31 | -48,28 | ||||
| 2026-04-24 | 13F | Greenfield Seitz Capital Management, LLC | 0 | -100,00 | 0 | |||||
| 2026-02-17 | 13F | Long Focus Capital Management, Llc | 7.765.024 | 21,33 | 21.820 | -11,91 | ||||
| 2026-02-09 | 13F | Hantz Financial Services, Inc. | 15 | 0 | ||||||
| 2026-02-17 | 13F | Millennium Management Llc | 0 | -100,00 | 0 | |||||
| 2026-02-13 | 13F | Prudential Financial Inc | 651.290 | -17,88 | 1.830 | -40,37 | ||||
| 2026-02-09 | 13F | Geode Capital Management, Llc | 2.271.878 | 6,16 | 6.385 | -22,92 | ||||
| 2026-04-15 | 13F | Norden Group Llc | 10.693 | 30 | ||||||
| 2026-02-13 | 13F | Kayne Anderson Rudnick Investment Management Llc | 68 | 0,00 | 0 | |||||
| 2025-11-10 | 13F | MAI Capital Management | 0 | -100,00 | 0 | |||||
| 2026-02-17 | 13F | Aquatic Capital Management LLC | 4.307 | 12 | ||||||
| 2026-02-17 | 13F | Optiver Holding B.V. | 0 | -100,00 | 0 | |||||
| 2026-02-17 | 13F | Ameriprise Financial Inc | 142.513 | 400 | ||||||
| 2026-01-29 | 13F | Dunhill Financial, LLC | 2 | 0 | ||||||
| 2026-02-13 | 13F | Jacobs Levy Equity Management, Inc | 957.958 | 2.692 | ||||||
| 2026-02-17 | 13F | Alliancebernstein L.p. | 86.990 | -18,49 | 244 | -40,92 | ||||
| 2026-04-27 | 13F | HB Wealth Management, LLC | 12.058 | 34 | ||||||
| 2026-02-17 | 13F | Quantinno Capital Management LP | 58.203 | 150,76 | 164 | 83,15 | ||||
| 2026-02-11 | 13F | Buckingham Strategic Partners | 14.843 | -42,63 | 42 | -50,60 | ||||
| 2026-02-12 | 13F | Swiss National Bank | 186.100 | 0,00 | 523 | -27,50 | ||||
| 2026-02-10 | 13F | Rothschild Investment Llc | 500 | 0,00 | 1 | 0,00 | ||||
| 2026-02-13 | 13F | National Bank Of Canada /fi/ | 9.065 | 0,00 | 25 | -26,47 | ||||
| 2026-04-08 | 13F | Wealth Enhancement Advisory Services, Llc | 38.377 | -1,11 | 103 | -15,00 | ||||
| 2026-01-27 | 13F | Zurcher Kantonalbank (Zurich Cantonalbank) | 46.883 | 0,00 | 132 | -27,62 | ||||
| 2026-04-21 | 13F | Pallas Capital Advisors LLC | 22.070 | -22,81 | 61 | -23,75 | ||||
| 2026-02-13 | 13F | Marshall Wace, Llp | 0 | -100,00 | 0 | |||||
| 2026-02-09 | 13F | Optimize Financial Inc | 164.794 | 1,46 | 463 | -26,27 | ||||
| 2026-02-12 | 13F | Nuveen, LLC | 3.998.724 | 81,94 | 11.236 | 32,11 | ||||
| 2026-02-13 | 13F | Caxton Associates Llp | 50.407 | 142 | ||||||
| 2026-01-29 | 13F | DecisionPoint Financial, LLC | 84 | 0,00 | 0 | |||||
| 2026-01-28 | 13F | CAPROCK Group, Inc. | 11.504 | -0,11 | 32 | -28,89 | ||||
| 2026-02-12 | 13F | Bank of Jackson Hole Trust | 0 | -100,00 | 0 | |||||
| 2026-03-11 | 13F | Leonteq Securities AG | 0 | -100,00 | 0 | |||||
| 2026-02-17 | 13F | Bridgeway Capital Management Inc | 2.139.169 | -7,84 | 6.011 | -33,08 | ||||
| 2026-02-17 | 13F | Canada Pension Plan Investment Board | 59.765.368 | 0,00 | 167.941 | -27,39 | ||||
| 2026-02-09 | 13F | Legal & General Group Plc | 79.085 | -19,31 | 222 | -41,42 | ||||
| 2026-02-13 | 13F | Ubs Asset Management Americas Inc | 284.341 | -3,53 | 799 | -30,00 | ||||
| 2026-02-17 | 13F | Holocene Advisors, LP | 7.201.961 | 18,23 | 20.238 | -14,16 | ||||
| 2026-02-17 | 13F | Advisory Services Network, LLC | 0 | -100,00 | 0 | |||||
| 2026-01-28 | 13F | WPG Advisers, LLC | 77 | 0,00 | 0 | |||||
| 2025-11-14 | 13F | Federation des caisses Desjardins du Quebec | 0 | -100,00 | 0 | -100,00 | ||||
| 2026-02-09 | 13F | Bleakley Financial Group, LLC | 197.193 | 30,12 | 554 | -5,46 | ||||
| 2026-03-20 | 13F/A | Hsbc Holdings Plc | 35.898 | -40,08 | 101 | -56,14 | ||||
| 2026-02-11 | 13F | Jpmorgan Chase & Co | 988.921 | 18,80 | 2.779 | -13,75 | ||||
| 2026-01-29 | 13F | IMC-Chicago, LLC | 90.390 | 8,95 | 254 | -21,18 | ||||
| 2026-02-06 | 13F | Prescott Group Capital Management, L.l.c. | 120.000 | 337 | ||||||
| 2026-02-17 | 13F | CastleKnight Management LP | 122.500 | 0,00 | 344 | -27,43 | ||||
| 2026-02-13 | 13F | Manufacturers Life Insurance Company, The | 0 | -100,00 | 0 | |||||
| 2026-02-17 | 13F | CVC Management Holdings II Ltd. | 145.924.140 | 0,00 | 410.047 | -27,39 | ||||
| 2026-02-13 | 13F | Public Employees Retirement Association Of Colorado | 12.814 | 0,00 | 0 | |||||
| 2026-01-30 | 13F | Us Bancorp \de\ | 12.118 | 0,00 | 34 | -26,09 | ||||
| 2026-02-13 | 13F | Barclays Plc | 373.854 | 160,26 | 1.051 | 89,19 | ||||
| 2026-02-19 | 13F | Invesco Ltd. | 579.264 | -16,96 | 1.628 | -39,72 | ||||
| 2025-11-14 | 13F | Point72 Asia (Singapore) Pte. Ltd. | 15.894 | 62 | ||||||
| 2025-11-14 | 13F | Two Sigma Securities, Llc | 0 | -100,00 | 0 | |||||
| 2026-02-03 | 13F | International Assets Investment Management, Llc | 7.825 | 22 | ||||||
| 2026-02-17 | 13F | Zacks Investment Management | 33.350 | 94 | ||||||
| 2025-11-21 | 13F | Nebula Research & Development LLC | 0 | -100,00 | 0 | |||||
| 2026-04-21 | 13F | Wedbush Securities Inc | 25.486 | 0,00 | 0 | |||||
| 2026-01-29 | 13F | UBS Group AG | 483.046 | 53,79 | 1.357 | 11,69 | ||||
| 2026-02-17 | 13F | Fmr Llc | 4.414.127 | 17,77 | 12.404 | -14,49 | ||||
| 2026-02-17 | 13F | Mercer Global Advisors Inc /adv | 16.662 | -23,33 | 47 | -45,24 | ||||
| 2026-02-11 | 13F | Simplex Trading, Llc | 0 | -100,00 | 0 | |||||
| 2026-03-12 | 13F/A | Peak6 Llc | Call | 15.500 | -0,64 | 44 | -28,33 | |||
| 2026-02-11 | 13F | Barrow Hanley Mewhinney & Strauss Llc | 196 | 1 | ||||||
| 2026-02-12 | 13F | New York State Common Retirement Fund | 7.797 | -48,87 | 22 | -64,41 | ||||
| 2026-02-13 | 13F | State Street Corp | 2.042.525 | 0,18 | 5.739 | -27,26 | ||||
| 2026-02-13 | 13F | Ariadne Wealth Management, LP | 20.595 | -0,87 | 50 | -22,22 | ||||
| 2026-02-13 | 13F | BNP Paribas Asset Management Holding S.A. | 2.587 | 62,70 | 0 | |||||
| 2026-02-20 | 13F | Sunbelt Securities, Inc. | 34 | -99,16 | 0 | -100,00 | ||||
| 2026-02-17 | 13F | MIRAE ASSET GLOBAL ETFS HOLDINGS Ltd. | 37.397 | 1,38 | 105 | -26,06 | ||||
| 2026-04-06 | 13F | GAMMA Investing LLC | 135 | -82,10 | 0 | -100,00 | ||||
| 2026-04-24 | 13F | Key FInancial Inc | 0 | -100,00 | 0 | |||||
| 2025-11-17 | 13F | GWM Advisors LLC | 0 | -100,00 | 0 | |||||
| 2026-02-17 | 13F | Balyasny Asset Management Llc | 0 | -100,00 | 0 |
Other Listings
| DE:7G9 | 2,48 € |