Grundlæggende statistik
| Institutionelle ejere | 171 total, 171 long only, 0 short only, 0 long/short - change of 1,18% MRQ |
| Gennemsnitlig porteføljeallokering | 0.0328 % - change of -39,53% MRQ |
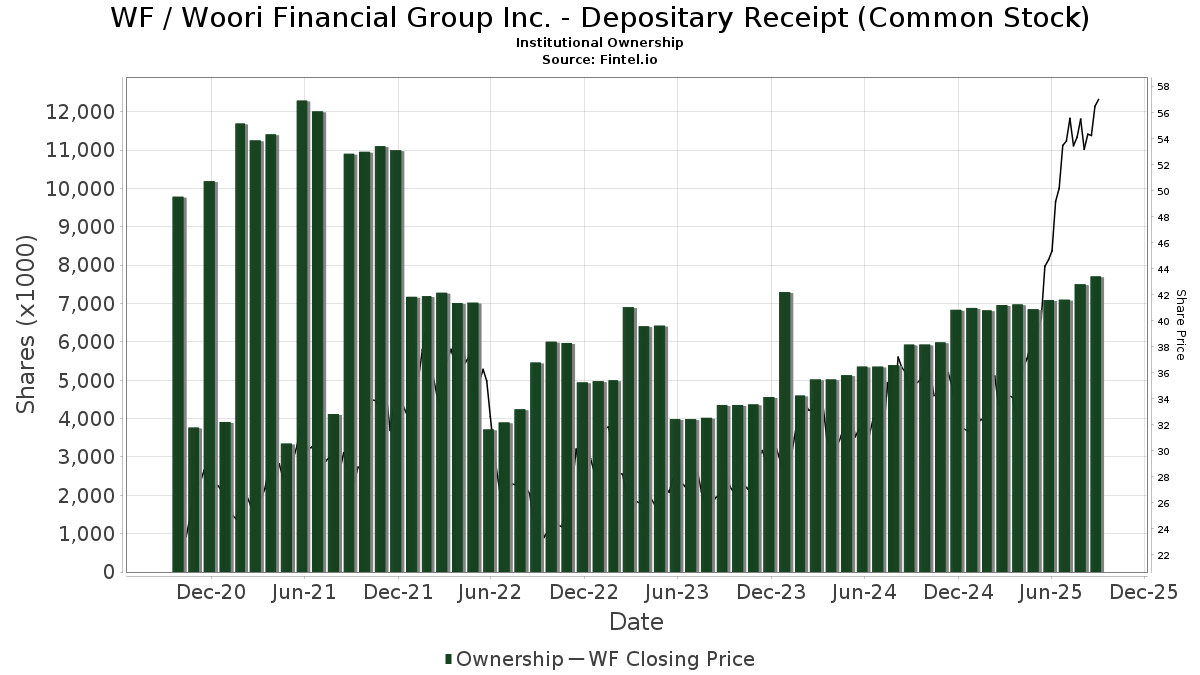
| Institutionelle aktier (lange) | 7.674.566 (ex 13D/G) - change of 0,35MM shares 4,75% MRQ |
| Institutionel værdi (lang) | $ 443.527 USD ($1000) |
Institutionelt ejerskab og aktionærer
Woori Financial Group Inc. - Depositary Receipt (Common Stock) (US:WF) har 171 institutionelle ejere og aktionærer, der har indsendt 13D/G- eller 13F-formularer til Securities Exchange Commission (SEC). Disse institutioner har i alt 7,674,566 aktier. Største aktionærer omfatter BlackRock, Inc., Morgan Stanley, Connor, Clark & Lunn Investment Management Ltd., Creative Planning, Arrowstreet Capital, Limited Partnership, Quantinno Capital Management LP, Acadian Asset Management Llc, Ethic Inc., JustInvest LLC, and Vident Advisory, LLC .
Woori Financial Group Inc. - Depositary Receipt (Common Stock) (NYSE:WF) institutionel ejerskabsstruktur viser aktuelle positioner i virksomheden efter institutioner og fonde, samt seneste ændringer i positionsstørrelse. Større aktionærer kan omfatte individuelle investorer, investeringsforeninger, hedgefonde eller institutioner. Skema 13D angiver, at investoren besidder (eller besidder) mere end 5 % af virksomheden og har til hensigt (eller har til hensigt at) aktivt at forfølge en ændring i forretningsstrategi. Skema 13G indikerer en passiv investering på over 5%.
The share price as of April 17, 2026 is 74,32 / share. Previously, on April 21, 2025, the share price was 35,46 / share. This represents an increase of 109,59% over that period.
Fondens stemningsscore
Fund Sentiment Score (fka Ownership Accumulation Score) finder de aktier, der bliver mest købt af fonde. Det er resultatet af en sofistikeret, multi-faktor kvantitativ model, der identificerer virksomheder med de højeste niveauer af institutionel akkumulering. Scoringsmodellen bruger en kombination af den samlede stigning i oplyste ejere, ændringerne i porteføljeallokeringer i disse ejere og andre målinger. Tallet går fra 0 til 100, hvor højere tal indikerer et højere niveau af akkumulering for sine jævnaldrende, og 50 er gennemsnittet.
Opdateringsfrekvens: Dagligt
Se Ownership Explorer, som giver en liste over højest rangerende virksomheder.
AI+ Ask Fintel’s AI assistant about Woori Financial Group Inc. - Depositary Receipt (Common Stock).
Select a question to share a public post with an AI-crafted answer.
Thinking of good questions…
Institutionel Put/Call-forhold
Ud over at indberette standardaktie- og gældsudstedelser skal institutter med mere end 100 mill. aktiver under forvaltning også oplyse deres put- og call-optionsbeholdninger. Da salgsoptioner generelt indikerer negativ stemning, og købsoptioner indikerer positiv stemning, kan vi få en fornemmelse af den overordnede institutionelle stemning ved at plotte forholdet mellem put og kald. Diagrammet til højre viser det historiske put/call-forhold for dette instrument.
Brug af Put/Call Ratio som en indikator for investorernes stemning overvinder en af de vigtigste mangler ved at bruge totalt institutionelt ejerskab, som er, at en betydelig mængde af aktiver under forvaltning investeres passivt for at spore indekser. Passivt forvaltede fonde køber typisk ikke optioner, så indikatoren for put/call-forholdet følger mere nøje følelsen af aktivt forvaltede fonde.
13F og NPORT arkivering
Detaljer om 13F-arkivering er gratis. Detaljer om NP-ansøgninger kræver et premium-medlemskab. Grønne rækker angiver nye positioner. Røde rækker angiver lukkede positioner. Klik på linket ikon for at se den fulde transaktionshistorik.
Opgrader
for at låse premium-data op og eksportere til Excel ![]() .
.
| Fil dato | Kilde | Investor | Type | Gennemsnitlig pris (Øst) |
Aktier | Δ Aktier (%) |
Rapporteret Værdi ($1000) |
Δ Værdi (%) |
Port Alloc (%) |
|
|---|---|---|---|---|---|---|---|---|---|---|
| 2025-11-12 | 13F | Crossmark Global Holdings, Inc. | 0 | -100,00 | 0 | |||||
| 2026-02-13 | 13F | Ubs Asset Management Americas Inc | 1.225 | 72 | ||||||
| 2026-02-13 | 13F | Barclays Plc | 145 | 9 | ||||||
| 2025-10-21 | 13F | Simon Quick Advisors, Llc | 0 | -100,00 | 0 | -100,00 | ||||
| 2026-02-17 | 13F | Lazard Asset Management Llc | 37.366 | -1,47 | 2.197 | 3,15 | ||||
| 2026-02-12 | 13F | Dimensional Fund Advisors Lp | 92.291 | 0,51 | 5.426 | 5,20 | ||||
| 2026-02-10 | 13F | NINE MASTS CAPITAL Ltd | 4.868 | 0,00 | 286 | 4,76 | ||||
| 2026-01-28 | 13F | CAPROCK Group, Inc. | 14.433 | 23,29 | 849 | 33,75 | ||||
| 2026-01-29 | 13F | UBS Group AG | 3.421 | -83,06 | 201 | -82,28 | ||||
| 2026-01-22 | 13F | Financial Consulate, Inc | 24 | 1 | ||||||
| 2026-04-13 | 13F | Trust Co | 16 | 0,00 | 1 | |||||
| 2026-02-13 | 13F | Pinnacle Wealth Planning Services, Inc. | 5.030 | -0,47 | 296 | 4,24 | ||||
| 2026-04-10 | 13F | Granite FO LLC | 43 | 0,00 | 3 | 0,00 | ||||
| 2026-01-21 | 13F | Aaron Wealth Advisors LLC | 5.443 | 6,52 | 320 | 11,54 | ||||
| 2026-02-19 | 13F | Invesco Ltd. | 30.227 | -35,34 | 1.777 | -32,28 | ||||
| 2026-02-13 | 13F | Marshall Wace, Llp | 5.356 | 315 | ||||||
| 2026-01-22 | 13F | Venturi Wealth Management, LLC | 7.901 | 73,61 | 465 | 81,96 | ||||
| 2026-02-10 | 13F | Savant Capital, LLC | 0 | -100,00 | 0 | |||||
| 2026-01-28 | 13F | B. Metzler seel. Sohn & Co. AG | 89.881 | 100,15 | 5.284 | 109,56 | ||||
| 2026-02-06 | 13F | Profund Advisors Llc | 5.302 | -7,31 | 312 | -3,12 | ||||
| 2026-01-29 | 13F | Aprio Wealth Management, LLC | 11.668 | -0,09 | 686 | 4,58 | ||||
| 2026-02-10 | 13F | Root Financial Partners, LLC | 13 | 1 | ||||||
| 2026-02-13 | 13F | Pathstone Holdings, LLC | 22.962 | 4,66 | 1.350 | 9,59 | ||||
| 2026-02-11 | 13F | Ramirez Asset Management, Inc. | 613 | 36 | ||||||
| 2026-02-09 | 13F | Hantz Financial Services, Inc. | 2.953 | -3,94 | 0 | |||||
| 2026-02-13 | 13F | Transamerica Financial Advisors, Inc. | 17 | 1 | ||||||
| 2026-02-03 | 13F | Ballentine Partners, LLC | 38.120 | -0,73 | 2.241 | 3,94 | ||||
| 2026-04-14 | 13F | Drive Wealth Management, Llc | 4.971 | 1,10 | 331 | 14,53 | ||||
| 2026-04-13 | 13F | Foster Group, Inc. | 6.385 | 3,00 | 425 | 16,76 | ||||
| 2026-02-10 | 13F | Acadian Asset Management Llc | 129.815 | -1,90 | 8 | 0,00 | ||||
| 2026-02-06 | 13F | Pnc Financial Services Group, Inc. | 24.674 | 13,10 | 1.451 | 18,37 | ||||
| 2026-04-13 | 13F | IFP Advisors, Inc | 99 | -18,18 | 7 | -14,29 | ||||
| 2026-02-19 | 13F | CI Private Wealth, LLC | 21.300 | 1,97 | 1.249 | 6,48 | ||||
| 2026-02-10 | 13F | Greenspring Advisors, LLC | 6.202 | 365 | ||||||
| 2026-02-12 | 13F | Quadrant Capital Group Llc | 31.121 | 9,89 | 1.830 | 15,03 | ||||
| 2026-01-23 | 13F | Ritholtz Wealth Management | 39.552 | 1,42 | 2.325 | 6,21 | ||||
| 2026-02-13 | 13F | Wells Fargo & Company/mn | 687 | -87,35 | 40 | -86,89 | ||||
| 2026-02-17 | 13F | Advisor Group Holdings, Inc. | 1.253 | -43,84 | 74 | -41,60 | ||||
| 2026-02-24 | 13F | DGS Capital Management, LLC | 27.301 | 3,88 | 1.605 | 8,81 | ||||
| 2026-02-12 | 13F | Principal Securities, Inc. | 0 | -100,00 | 0 | -100,00 | ||||
| 2025-10-22 | 13F | Geneos Wealth Management Inc. | 0 | -100,00 | 0 | |||||
| 2026-02-12 | 13F | Barometer Capital Management Inc. | 0 | -100,00 | 0 | |||||
| 2026-01-27 | 13F | WealthCollab, LLC | 1.284 | 0,00 | 75 | 4,17 | ||||
| 2026-02-13 | 13F | Cornerstone Financial Management LLC | 158 | 9 | ||||||
| 2026-02-11 | 13F | West Family Investments, Inc. | 17.770 | -0,12 | 1.045 | 4,50 | ||||
| 2026-02-12 | 13F | Brown Brothers Harriman & Co | 411 | 30,06 | 24 | 41,18 | ||||
| 2026-02-17 | 13F | Glenmede Trust Co Na | 4.517 | 266 | ||||||
| 2026-02-02 | 13F | Ativo Capital Management LLC | 27.547 | -6,52 | 1.619 | -2,12 | ||||
| 2026-02-13 | 13F | SRS Capital Advisors, Inc. | 4.993 | 35,39 | 294 | 41,55 | ||||
| 2026-01-29 | 13F | UMA Financial Services, Inc. | 175 | 18,24 | 10 | 25,00 | ||||
| 2026-02-03 | 13F | Sequoia Financial Advisors, LLC | 36.037 | 8,39 | 2.119 | 13,50 | ||||
| 2026-02-10 | 13F | Envestnet Asset Management Inc | 18.776 | -32,68 | 1.104 | -29,57 | ||||
| 2026-01-30 | 13F | Arlington Trust Co LLC | 0 | -100,00 | 0 | |||||
| 2026-02-17 | 13F | Aqr Capital Management Llc | 48.153 | 21,21 | 2.831 | 26,91 | ||||
| 2026-01-23 | 13F | Bridgewater Advisors Inc. | 12.962 | 3,32 | 784 | 11,84 | ||||
| 2026-02-12 | 13F | Rossby Financial, LCC | 7 | 0 | ||||||
| 2026-01-26 | 13F | Private Trust Co Na | 141 | 0,00 | 8 | 14,29 | ||||
| 2026-02-09 | 13F | Geode Capital Management, Llc | 3.470 | 204 | ||||||
| 2026-02-13 | 13F | Citigroup Inc | 13.239 | -0,23 | 778 | 4,43 | ||||
| 2026-02-17 | 13F | Voleon Capital Management Lp | 30.997 | 1.822 | ||||||
| 2025-11-12 | 13F | Huntington National Bank | 0 | -100,00 | 0 | |||||
| 2026-02-12 | 13F | Skopos Labs, Inc. | 5.629 | 332 | ||||||
| 2026-02-17 | 13F | Russell Investments Group, Ltd. | 8.846 | -5,63 | 520 | -1,14 | ||||
| 2026-02-11 | 13F | LPL Financial LLC | 18.741 | 7,30 | 1.102 | 12,35 | ||||
| 2026-01-23 | 13F | Assetmark, Inc | 67.850 | 89,01 | 3.989 | 97,92 | ||||
| 2026-01-15 | 13F | Nisa Investment Advisors, Llc | 350 | 21 | ||||||
| 2026-02-13 | 13F | PCM Encore, LLC | 10.925 | 642 | ||||||
| 2026-04-17 | 13F | Bell Investment Advisors, Inc | 675 | 34,19 | 45 | 51,72 | ||||
| 2026-02-02 | 13F | Qrg Capital Management, Inc. | 11.261 | 12,23 | 662 | 17,58 | ||||
| 2026-02-10 | 13F | Natixis Advisors, L.p. | 0 | -100,00 | 0 | |||||
| 2026-02-12 | 13F | Xponance, Inc. | 5.796 | 16,46 | 341 | 21,86 | ||||
| 2026-02-17 | 13F | Mercer Global Advisors Inc /adv | 8.519 | -2,51 | 501 | 2,04 | ||||
| 2026-04-14 | 13F | BSW Wealth Partners | 11.040 | -1,73 | 735 | 11,36 | ||||
| 2025-11-06 | 13F | Wealthstream Advisors, Inc. | 5.729 | 9,67 | 322 | 23,94 | ||||
| 2026-02-11 | 13F | Franklin Resources Inc | 6.513 | 0,05 | 383 | 4,66 | ||||
| 2026-02-06 | 13F | HighTower Advisors, LLC | 6.517 | -2,24 | 383 | 2,41 | ||||
| 2026-02-12 | 13F | BlackRock, Inc. | 2.242.933 | 4,85 | 131.862 | 9,78 | ||||
| 2026-02-10 | 13F | Bnp Paribas Arbitrage, Sa | 61.043 | 20,34 | 3.589 | 25,98 | ||||
| 2026-04-10 | 13F | Centurion Wealth Management LLC | 6.850 | -6,80 | 456 | 5,56 | ||||
| 2026-01-26 | 13F | Cwm, Llc | 3.474 | 7,55 | 0 | |||||
| 2026-02-11 | 13F | Parallel Advisors, LLC | 14.172 | -0,11 | 833 | 4,65 | ||||
| 2026-01-30 | 13F | North Star Investment Management Corp. | 127 | 1.311,11 | 7 | |||||
| 2026-02-17 | 13F | Royal Bank Of Canada | 1.237 | -14,16 | 73 | -9,88 | ||||
| 2026-02-17 | 13F | Ancora Advisors, LLC | 150 | 0,00 | 9 | 0,00 | ||||
| 2025-11-12 | 13F | Victory Capital Management Inc | 0 | -100,00 | 0 | |||||
| 2026-02-17 | 13F | Two Sigma Investments, Lp | 14.388 | 128,60 | 846 | 139,38 | ||||
| 2026-02-11 | 13F | Syon Capital Llc | 5.172 | 304 | ||||||
| 2025-11-14 | 13F | Wetherby Asset Management Inc | 63.770 | 2,49 | 3.581 | 15,71 | ||||
| 2026-04-07 | 13F | Farther Finance Advisors, LLC | 3.469 | 8,10 | 233 | 23,40 | ||||
| 2026-02-13 | 13F | MAI Capital Management | 94 | -81,53 | 6 | -82,14 | ||||
| 2026-02-17 | 13F | Advisory Services Network, LLC | 0 | -100,00 | 0 | |||||
| 2026-02-04 | 13F | Summit Wealth Group Llc / Co | 0 | -100,00 | 0 | -100,00 | ||||
| 2026-01-27 | 13F | Meritage Portfolio Management | 6.651 | -92,94 | 391 | -92,61 | ||||
| 2026-02-13 | 13F | First Trust Advisors Lp | 17.488 | 26,13 | 1.028 | 32,13 | ||||
| 2026-04-14 | 13F | Clean Yield Group | 100 | 0,00 | 7 | 20,00 | ||||
| 2026-02-17 | 13F | Creative Planning | 334.235 | 11,81 | 19.650 | 17,06 | ||||
| 2026-02-13 | 13F | Kestra Advisory Services, LLC | 735 | 43 | ||||||
| 2026-01-15 | 13F | Frank, Rimerman Advisors LLC | 15.973 | 46,19 | 939 | 53,18 | ||||
| 2026-02-19 | 13F | Atomi Financial Group, Inc. | 8.174 | 5,04 | 481 | 10,09 | ||||
| 2026-02-17 | 13F | Principal Street Partners, LLC | 3.953 | 8,33 | 232 | 13,73 | ||||
| 2026-02-12 | 13F | Brinker Capital Investments, LLC | 4.485 | 10,17 | 264 | 15,35 | ||||
| 2026-02-03 | 13F | Crestwood Advisors Group LLC | 3.564 | 210 | ||||||
| 2026-02-11 | 13F | O'shaughnessy Asset Management, Llc | 86.522 | -5,57 | 5.087 | -1,13 | ||||
| 2026-01-27 | 13F | Evergreen Capital Management Llc | 6.790 | 7,76 | 399 | 13,03 | ||||
| 2026-02-03 | 13F | SBI Securities Co., Ltd. | 45 | -6,25 | 3 | 0,00 | ||||
| 2026-02-12 | 13F | Renaissance Technologies Llc | 0 | -100,00 | 0 | |||||
| 2026-01-16 | 13F | Ronald Blue Trust, Inc. | 15.019 | -6,84 | 883 | -2,54 | ||||
| 2026-02-17 | 13F | Summit Global Investments | 4.596 | 0 | ||||||
| 2025-11-13 | 13F | Glenmede Investment Management, LP | 4.355 | -11,97 | 245 | -0,81 | ||||
| 2026-02-13 | 13F | Arrowstreet Capital, Limited Partnership | 241.910 | -8,75 | 14.222 | -4,46 | ||||
| 2026-02-13 | 13F | Verition Fund Management LLC | 9.928 | 37,89 | 584 | 44,31 | ||||
| 2026-02-17 | 13F | Public Employees Retirement System Of Ohio | 29.520 | -4,14 | 1.735 | 0,35 | ||||
| 2025-11-12 | 13F | NewSquare Capital LLC | 0 | -100,00 | 0 | -100,00 | ||||
| 2026-01-28 | 13F | HB Wealth Management, LLC | 6.220 | 16,31 | 366 | 21,67 | ||||
| 2026-04-06 | 13F | GAMMA Investing LLC | 5.323 | 21,34 | 355 | 37,74 | ||||
| 2026-04-08 | 13F | Miracle Mile Advisors, LLC | 12.897 | 13,15 | 859 | 28,06 | ||||
| 2026-02-17 | 13F | Jones Financial Companies Lllp | 45 | 3 | ||||||
| 2026-04-06 | 13F | Highline Wealth Partners Llc | 99 | 0,00 | 7 | 20,00 | ||||
| 2026-02-12 | 13F | Bank Of Montreal /can/ | 8.264 | 486 | ||||||
| 2026-02-10 | 13F/A | Northwestern Mutual Wealth Management Co | 232 | 34,88 | 14 | 44,44 | ||||
| 2026-02-06 | 13F | EverSource Wealth Advisors, LLC | 6.886 | -3,85 | 405 | 0,50 | ||||
| 2026-02-09 | 13F | Coldstream Capital Management Inc | 12.299 | -37,74 | 723 | -34,81 | ||||
| 2026-02-13 | 13F | Ariadne Wealth Management, LP | 7.004 | -0,86 | 554 | 42,53 | ||||
| 2026-02-17 | 13F | Bank Of America Corp /de/ | 93.756 | -19,69 | 5.512 | -15,93 | ||||
| 2026-04-07 | 13F | Signaturefd, Llc | 44.545 | 0,72 | 2.967 | 14,12 | ||||
| 2026-01-21 | 13F | Greenleaf Trust | 7.102 | 0,00 | 418 | 4,77 | ||||
| 2025-10-30 | 13F | Twin Peaks Wealth Advisors, LLC | 0 | -100,00 | 0 | |||||
| 2026-02-12 | 13F | CIBC Private Wealth Group, LLC | 129 | 0,00 | 8 | 0,00 | ||||
| 2026-02-12 | 13F | Jane Street Group, Llc | 23.921 | 1.406 | ||||||
| 2026-02-17 | 13F | Ameriprise Financial Inc | 7.523 | 0,95 | 442 | 5,74 | ||||
| 2026-02-17 | 13F | Laird Norton Trust Company, Llc | 93.903 | 5.521 | ||||||
| 2026-02-17 | 13F | United Capital Financial Advisers, Llc | 3.998 | 235 | ||||||
| 2026-02-05 | 13F | Td Private Client Wealth Llc | 1.262 | 14,62 | 74 | 21,31 | ||||
| 2026-02-11 | 13F | Rise Advisors, LLC | 0 | -100,00 | 0 | |||||
| 2026-04-10 | 13F | Abound Wealth Management | 12 | -53,85 | 1 | -100,00 | ||||
| 2025-11-03 | 13F | Valeo Financial Advisors, LLC | 0 | -100,00 | 0 | -100,00 | ||||
| 2026-02-18 | 13F | Vident Advisory, LLC | 103.802 | -10,82 | 6.103 | -6,63 | ||||
| 2026-04-13 | 13F | Hm Payson & Co | 508 | 0,00 | 34 | 13,79 | ||||
| 2026-02-13 | 13F | Rhumbline Advisers | 10.854 | -13,50 | 638 | -9,37 | ||||
| 2026-02-13 | 13F | Strategic Global Advisors, LLC | 6.412 | -1,08 | 377 | 3,58 | ||||
| 2026-02-03 | 13F | Ethic Inc. | 124.767 | 9,15 | 7.335 | 14,29 | ||||
| 2026-02-13 | 13F | Morgan Stanley | 1.399.904 | 4,57 | 82.300 | 9,49 | ||||
| 2026-04-02 | 13F | Ares Financial Consulting, LLC | 40 | 0,00 | 3 | 0,00 | ||||
| 2026-02-17 | 13F | Northern Trust Corp | 43.619 | 43,31 | 2.564 | 50,03 | ||||
| 2026-02-11 | 13F | Cerity Partners LLC | 69.820 | 9,26 | 4.105 | 14,38 | ||||
| 2026-02-04 | 13F | Argos Wealth Advisors, LLC | 3.528 | 207 | ||||||
| 2026-02-13 | 13F | Umb Bank N A/mo | 431 | -18,22 | 25 | -13,79 | ||||
| 2026-01-21 | 13F | Yousif Capital Management, Llc | 24.346 | 0,00 | 1.415 | 3,44 | ||||
| 2026-02-06 | 13F | Global Retirement Partners, LLC | 3.821 | 1,68 | 225 | 6,67 | ||||
| 2025-10-28 | 13F | BRYN MAWR TRUST Co | 97 | 0,00 | 5 | 25,00 | ||||
| 2026-02-17 | 13F | Citadel Advisors Llc | 9.980 | 587 | ||||||
| 2026-02-11 | 13F | IMA Wealth, Inc. | 40 | 2 | ||||||
| 2026-02-05 | 13F | Allworth Financial LP | 1.693 | 12,42 | 100 | 17,86 | ||||
| 2026-02-11 | 13F | Capital International Investors | 0 | -100,00 | 0 | |||||
| 2026-02-12 | 13F | Wealthspire Advisors, LLC | 0 | -100,00 | 0 | |||||
| 2026-02-13 | 13F | Smartleaf Asset Management LLC | 1.914 | 9,50 | 113 | 13,13 | ||||
| 2026-02-17 | 13F | Aquatic Capital Management LLC | 4.367 | 4,57 | 257 | 9,40 | ||||
| 2026-01-23 | 13F | Westside Investment Management, Inc. | 1.024 | 0,00 | 61 | 3,45 | ||||
| 2026-01-08 | 13F | Tuttle Tactical Management LLC | 5.570 | 327 | ||||||
| 2026-02-12 | 13F | Triumph Capital Management | 50 | 0,00 | 3 | 0,00 | ||||
| 2026-02-11 | 13F | Vise Technologies, Inc. | 16.333 | 5,39 | 960 | 10,34 | ||||
| 2026-02-19 | 13F | Mcguire Capital Advisors Inc | 169 | 10 | ||||||
| 2026-04-13 | 13F | True Wealth Design, LLC | 125 | 40,45 | 8 | 60,00 | ||||
| 2026-02-13 | 13F | Ieq Capital, Llc | 33.654 | 9,28 | 1.979 | 14,40 | ||||
| 2026-02-13 | 13F | JustInvest LLC | 118.596 | 9,32 | 6.972 | 14,46 | ||||
| 2026-02-17 | 13F | Fmr Llc | 31.885 | -11,08 | 1.875 | -6,91 | ||||
| 2026-02-12 | 13F | Canopy Partners, LLC | 0 | -100,00 | 0 | |||||
| 2026-02-11 | 13F | Jpmorgan Chase & Co | 52.763 | 11,01 | 3.102 | 16,23 | ||||
| 2026-02-14 | 13F | Rockefeller Capital Management L.P. | 1.084 | 37,56 | 64 | 43,18 | ||||
| 2026-02-17 | 13F | Raymond James Financial Inc | 0 | -100,00 | 0 | |||||
| 2026-01-16 | 13F | Crewe Advisors LLC | 45 | 0,00 | 3 | 0,00 | ||||
| 2026-01-14 | 13F | Jfs Wealth Advisors, Llc | 444 | 0,00 | 26 | 8,33 | ||||
| 2026-02-05 | 13F | Bessemer Group Inc | 260 | -43,72 | 0 | -100,00 | ||||
| 2026-02-17 | 13F | Tower Research Capital LLC (TRC) | 17 | 1 | ||||||
| 2026-02-05 | 13F | Abacus Wealth Partners, LLC | 36.945 | 456,23 | 2.172 | 483,87 | ||||
| 2026-02-10 | 13F | Sivia Capital Partners, LLC | 8.893 | -1,16 | 523 | 3,37 | ||||
| 2026-02-13 | 13F | Mariner, LLC | 33.949 | 9,77 | 1.996 | 14,98 | ||||
| 2026-02-06 | 13F | Bare Financial Services, Inc | 145 | 0,00 | 9 | 0,00 | ||||
| 2026-04-06 | 13F | Versant Capital Management, Inc | 78 | 5 | ||||||
| 2025-11-07 | 13F | Sierra Ocean, Llc | 0 | -100,00 | 0 | |||||
| 2026-02-17 | 13F | SageView Advisory Group, LLC | 130 | 8 | ||||||
| 2026-02-17 | 13F | Quantinno Capital Management LP | 134.865 | 28,16 | 7.929 | 34,19 | ||||
| 2026-02-13 | 13F | Sei Investments Co | 57.768 | -13,03 | 3.396 | -8,93 | ||||
| 2026-02-10 | 13F | Goldman Sachs Group Inc | 41.050 | 24,40 | 2.413 | 30,29 | ||||
| 2026-01-22 | 13F | Pinnacle Bancorp, Inc. | 65 | 0,00 | 4 | 0,00 | ||||
| 2026-02-17 | 13F | Millennium Management Llc | 67.254 | 3.954 | ||||||
| 2026-01-26 | 13F | PDS Planning, Inc | 13.493 | 3,60 | 793 | 8,48 | ||||
| 2026-02-13 | 13F | Parkside Financial Bank & Trust | 140 | 0,00 | 8 | 14,29 | ||||
| 2026-01-30 | 13F | Us Bancorp \de\ | 53.469 | 7,14 | 3.143 | 12,17 | ||||
| 2026-02-06 | 13F | Larson Financial Group LLC | 191 | 695,83 | 11 | 1.000,00 | ||||
| 2026-02-10 | 13F | Connor, Clark & Lunn Investment Management Ltd. | 501.862 | 3,37 | 29.504 | 8,23 | ||||
| 2026-02-17 | 13F | Guggenheim Capital Llc | 16.951 | 25,91 | 997 | 31,92 | ||||
| 2026-02-06 | 13F | Vestmark Advisory Solutions, Inc. | 27.308 | 1.605 |
Other Listings
| DE:2WGA | 59,50 € |