Grundlæggende statistik
| Institutionelle ejere | 84 total, 84 long only, 0 short only, 0 long/short - change of 15,07% MRQ |
| Gennemsnitlig porteføljeallokering | 0.4204 % - change of 0,17% MRQ |
| Institutionelle aktier (lange) | 3.010.852 (ex 13D/G) - change of 0,81MM shares 36,87% MRQ |
| Institutionel værdi (lang) | $ 208.547 USD ($1000) |
Institutionelt ejerskab og aktionærer
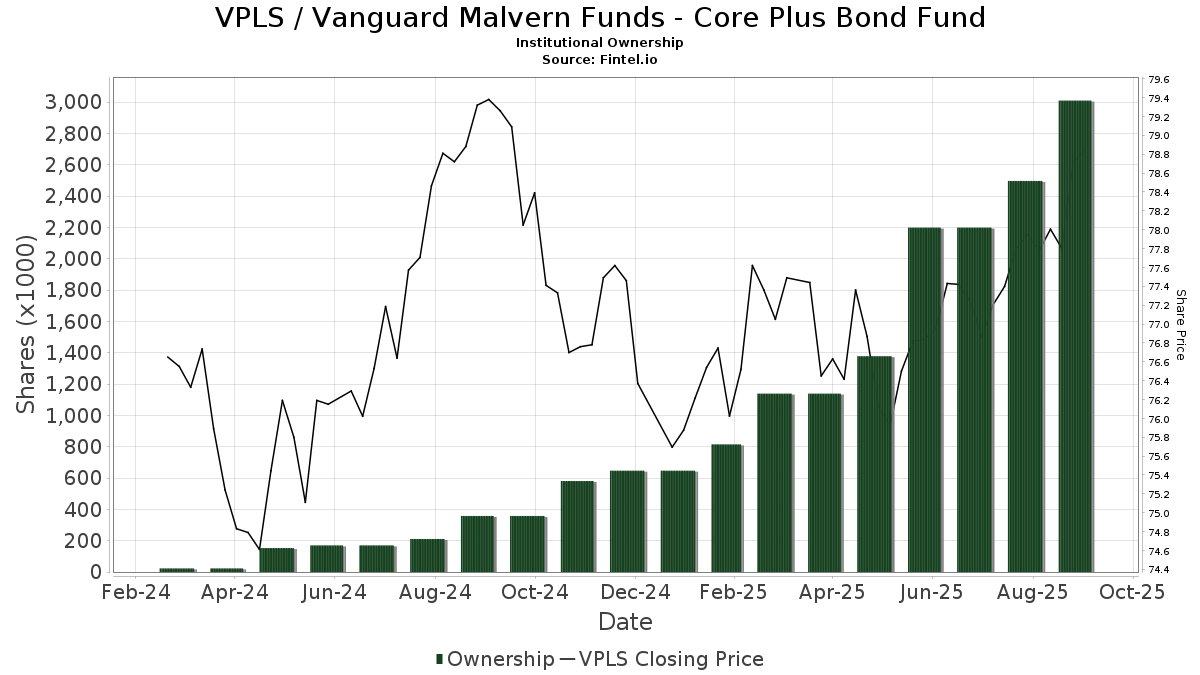
Vanguard Malvern Funds - Core Plus Bond Fund (US:VPLS) har 84 institutionelle ejere og aktionærer, der har indsendt 13D/G- eller 13F-formularer til Securities Exchange Commission (SEC). Disse institutioner har i alt 3,010,852 aktier. Største aktionærer omfatter Bank Of America Corp /de/, LPL Financial LLC, Royal Bank Of Canada, Diversified Portfolios, Inc., Keystone Financial Group, Inc., MorganRosel Wealth Management, LLC, Jane Street Group, Llc, Balance Wealth, LLC, Fagan Associates, Inc., and Landmark Wealth Management, LLC .
Vanguard Malvern Funds - Core Plus Bond Fund (NasdaqGM:VPLS) institutionel ejerskabsstruktur viser aktuelle positioner i virksomheden efter institutioner og fonde, samt seneste ændringer i positionsstørrelse. Større aktionærer kan omfatte individuelle investorer, investeringsforeninger, hedgefonde eller institutioner. Skema 13D angiver, at investoren besidder (eller besidder) mere end 5 % af virksomheden og har til hensigt (eller har til hensigt at) aktivt at forfølge en ændring i forretningsstrategi. Skema 13G indikerer en passiv investering på over 5%.
The share price as of September 11, 2025 is 78,90 / share. Previously, on September 12, 2024, the share price was 79,29 / share. This represents a decline of 0,49% over that period.
Fondens stemningsscore
Fund Sentiment Score (fka Ownership Accumulation Score) finder de aktier, der bliver mest købt af fonde. Det er resultatet af en sofistikeret, multi-faktor kvantitativ model, der identificerer virksomheder med de højeste niveauer af institutionel akkumulering. Scoringsmodellen bruger en kombination af den samlede stigning i oplyste ejere, ændringerne i porteføljeallokeringer i disse ejere og andre målinger. Tallet går fra 0 til 100, hvor højere tal indikerer et højere niveau af akkumulering for sine jævnaldrende, og 50 er gennemsnittet.
Opdateringsfrekvens: Dagligt
Se Ownership Explorer, som giver en liste over højest rangerende virksomheder.
Institutionel Put/Call-forhold
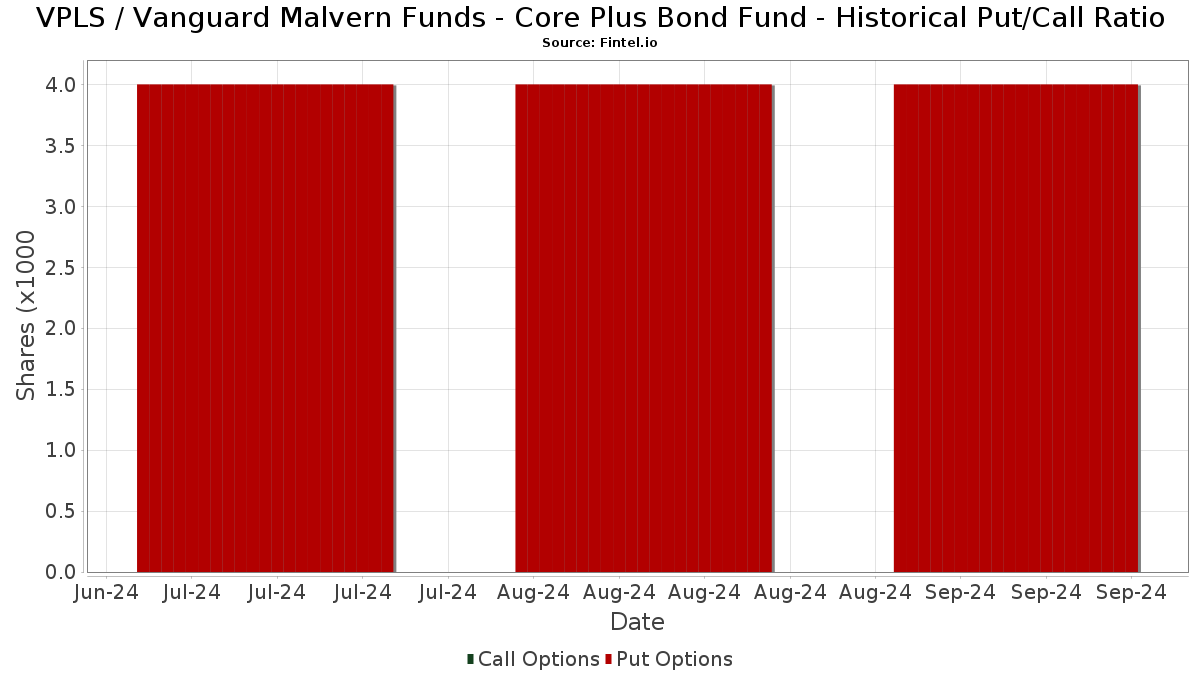
Ud over at indberette standardaktie- og gældsudstedelser skal institutter med mere end 100 mill. aktiver under forvaltning også oplyse deres put- og call-optionsbeholdninger. Da salgsoptioner generelt indikerer negativ stemning, og købsoptioner indikerer positiv stemning, kan vi få en fornemmelse af den overordnede institutionelle stemning ved at plotte forholdet mellem put og kald. Diagrammet til højre viser det historiske put/call-forhold for dette instrument.
Brug af Put/Call Ratio som en indikator for investorernes stemning overvinder en af de vigtigste mangler ved at bruge totalt institutionelt ejerskab, som er, at en betydelig mængde af aktiver under forvaltning investeres passivt for at spore indekser. Passivt forvaltede fonde køber typisk ikke optioner, så indikatoren for put/call-forholdet følger mere nøje følelsen af aktivt forvaltede fonde.
13F og NPORT arkivering
Detaljer om 13F-arkivering er gratis. Detaljer om NP-ansøgninger kræver et premium-medlemskab. Grønne rækker angiver nye positioner. Røde rækker angiver lukkede positioner. Klik på linket ikon for at se den fulde transaktionshistorik.
Opgrader
for at låse premium-data op og eksportere til Excel ![]() .
.
| Fil dato | Kilde | Investor | Type | Gennemsnitlig pris (Øst) |
Aktier | Δ Aktier (%) |
Rapporteret Værdi ($1000) |
Δ Værdi (%) |
Port Alloc (%) |
|
|---|---|---|---|---|---|---|---|---|---|---|
| 2025-07-29 | 13F | Mb, Levis & Associates, Llc | 107 | 1,90 | 8 | 0,00 | ||||
| 2025-08-04 | 13F | L.m. Kohn & Company | 5.697 | -51,79 | 443 | -51,64 | ||||
| 2025-07-09 | 13F | Dynamic Advisor Solutions LLC | 74.600 | 5.804 | ||||||
| 2025-08-14 | 13F | Ausdal Financial Partners, Inc. | 26.450 | 10,99 | 2.058 | 11,31 | ||||
| 2025-07-21 | 13F | Ameriflex Group, Inc. | 1.114 | 19,40 | 86 | 19,44 | ||||
| 2025-07-18 | 13F | First Pacific Financial | 648 | 50 | ||||||
| 2025-07-25 | 13F | Apollon Wealth Management, LLC | 2.600 | 202 | ||||||
| 2025-08-14 | 13F | Raymond James Financial Inc | 19.063 | 77,10 | 1.483 | 77,82 | ||||
| 2025-08-06 | 13F | Prospera Financial Services Inc | 5.362 | 0,00 | 417 | 0,48 | ||||
| 2025-08-06 | 13F | Commonwealth Equity Services, Llc | 38.366 | 193,18 | 3 | 100,00 | ||||
| 2025-08-13 | 13F | StoneX Group Inc. | 10.108 | 786 | ||||||
| 2025-08-13 | 13F | Balance Wealth, LLC | 115.975 | 122,06 | 9.023 | 122,77 | ||||
| 2025-08-14 | 13F | Diversify Advisory Services, LLC | 7.365 | -7,51 | 572 | -7,29 | ||||
| 2025-08-08 | 13F | Firestone Capital Management | 3.851 | 300 | ||||||
| 2025-07-15 | 13F | North Star Investment Management Corp. | 9.342 | 2.639,59 | 727 | 2.692,31 | ||||
| 2025-07-31 | 13F | Moser Wealth Advisors, LLC | 11.810 | 81,69 | 919 | 82,14 | ||||
| 2025-07-17 | 13F | XY Planning Network, Inc. | 6.177 | 481 | ||||||
| 2025-07-28 | 13F | Harbour Investments, Inc. | 50 | 0,00 | 4 | 0,00 | ||||
| 2025-08-14 | 13F | Principia Wealth Advisory, LLC | 5.467 | 9,76 | 425 | 11,84 | ||||
| 2025-08-14 | 13F | Comerica Bank | 177 | 88,30 | 14 | 85,71 | ||||
| 2025-07-15 | 13F | Garrett Investment Advisors LLC | 0 | -100,00 | 0 | |||||
| 2025-08-01 | 13F | Yukon Wealth Management, Inc. | 4.988 | 388 | ||||||
| 2025-05-14 | 13F | Van Hulzen Asset Management, LLC | 0 | -100,00 | 0 | -100,00 | ||||
| 2025-07-14 | 13F | Harbor Group, Inc. | 17.522 | 139,80 | 1.363 | 140,81 | ||||
| 2025-08-04 | 13F | Atria Investments Llc | 5.287 | 411 | ||||||
| 2025-08-14 | 13F | Aqr Capital Management Llc | 4.000 | -44,44 | 311 | -44,27 | ||||
| 2025-07-09 | 13F | Breakwater Capital Group | 8.352 | -0,13 | 650 | 0,15 | ||||
| 2025-08-13 | 13F | Haverford Trust Co | 3.500 | 272 | ||||||
| 2025-08-13 | 13F | Jones Financial Companies Lllp | 35.604 | 37,92 | 2.761 | 38,26 | ||||
| 2025-08-13 | 13F | Flow Traders U.s. Llc | 38.602 | 3 | ||||||
| 2025-08-14 | 13F | Wells Fargo & Company/mn | 359 | 28 | ||||||
| 2025-07-23 | 13F | Tcfg Wealth Management, Llc | 2.820 | 0,00 | 219 | 0,46 | ||||
| 2025-08-14 | 13F | Bank Of America Corp /de/ | 498.310 | 39,22 | 38.768 | 39,65 | ||||
| 2025-08-11 | 13F | Principal Securities, Inc. | 631 | -84,55 | 49 | -84,19 | ||||
| 2025-09-04 | 13F/A | Advisor Group Holdings, Inc. | 14.698 | 37,11 | 1.144 | 37,55 | ||||
| 2025-08-08 | 13F | CFO4Life Group, LLC | 52.431 | -1,97 | 4.079 | -1,66 | ||||
| 2025-07-15 | 13F | Family Investment Center, Inc. | 3.487 | -50,69 | 271 | -50,55 | ||||
| 2025-08-12 | 13F | Accredited Wealth Management, LLC | 850 | 0,00 | 66 | 1,54 | ||||
| 2025-08-12 | 13F | Eldridge Investment Advisors, Inc. | 4.895 | 52,02 | 379 | 52,21 | ||||
| 2025-08-04 | 13F | Grant Street Asset Management, Inc. | 46.206 | -10,86 | 3.595 | -10,60 | ||||
| 2025-08-14 | 13F | Ariadne Wealth Management, LP | 0 | -100,00 | 0 | |||||
| 2025-07-17 | 13F | Lakewood Asset Management LLC | 23.770 | 36,11 | 1.849 | 36,56 | ||||
| 2025-08-07 | 13F | Fagan Associates, Inc. | 94.388 | -0,56 | 7.343 | -0,26 | ||||
| 2025-07-15 | 13F | Mather Group, Llc. | 3.225 | 120,29 | 251 | 121,24 | ||||
| 2025-07-11 | 13F | Spence Asset Management | 9.661 | 20,36 | 1 | |||||
| 2025-07-24 | 13F | Aurora Private Wealth, Inc. | 5.447 | 0 | ||||||
| 2025-08-14 | 13F | Jane Street Group, Llc | 115.995 | 154,91 | 9.024 | 155,71 | ||||
| 2025-08-06 | 13F | AE Wealth Management LLC | 0 | -100,00 | 0 | |||||
| 2025-08-15 | 13F | Captrust Financial Advisors | 0 | -100,00 | 0 | |||||
| 2025-07-11 | 13F | SILVER OAK SECURITIES, Inc | 53.102 | 5,33 | 4.131 | 5,90 | ||||
| 2025-07-22 | 13F/A | Red Mountain Financial, LLC | 8.595 | 669 | ||||||
| 2025-07-31 | 13F | Leavell Investment Management, Inc. | 60.520 | 33,86 | 4.708 | 34,28 | ||||
| 2025-08-08 | 13F | Creative Planning | 3.626 | -12,67 | 282 | -12,42 | ||||
| 2025-04-30 | 13F | Parr Mcknight Wealth Management Group, Llc | 0 | -100,00 | 0 | |||||
| 2025-08-12 | 13F | Proequities, Inc. | 0 | 0 | ||||||
| 2025-08-01 | 13F | Ashton Thomas Private Wealth, LLC | 9.561 | 744 | ||||||
| 2025-08-01 | 13F | Red Lighthouse Investment Management, Llc | 4.340 | 338 | ||||||
| 2025-07-16 | 13F | Stephenson National Bank & Trust | 4.831 | 5,32 | 376 | 5,63 | ||||
| 2025-08-11 | 13F | HighTower Advisors, LLC | 10.323 | 32,53 | 803 | 32,95 | ||||
| 2025-08-26 | 13F/A | Thrivent Financial For Lutherans | 76.202 | 6 | ||||||
| 2025-08-13 | 13F | Strategic Family Wealth Counselors, L.L.C. | 27.054 | 11,93 | 2.105 | 12,27 | ||||
| 2025-07-18 | 13F | Truist Financial Corp | 0 | -100,00 | 0 | |||||
| 2025-08-11 | 13F | Pinnacle Financial Group, LLC / IL | 3.359 | 0,00 | 261 | 0,38 | ||||
| 2025-08-14 | 13F | Citadel Advisors Llc | 0 | -100,00 | 0 | |||||
| 2025-07-29 | 13F | Financial Synergies Wealth Advisors, Inc. | 2.634 | 1,54 | 205 | 1,49 | ||||
| 2025-08-12 | 13F | LPL Financial LLC | 344.677 | 33,51 | 26.816 | 33,92 | ||||
| 2025-07-21 | 13F | Keystone Financial Group, Inc. | 124.611 | 46,61 | 9.595 | 47,28 | ||||
| 2025-08-13 | 13F | Keystone Financial Group | 3.548 | 29,44 | 276 | 30,19 | ||||
| 2025-07-07 | 13F | OMNI 360 Wealth, Inc. | 13.599 | 15,29 | 1.058 | 15,75 | ||||
| 2025-08-01 | 13F | Envestnet Asset Management Inc | 0 | -100,00 | 0 | |||||
| 2025-07-17 | 13F | Janney Capital Management LLC | 69.284 | -2,08 | 5 | 0,00 | ||||
| 2025-08-01 | 13F | MorganRosel Wealth Management, LLC | 117.420 | 4,56 | 9.135 | 4,89 | ||||
| 2025-08-12 | 13F | Steward Partners Investment Advisory, Llc | 4.292 | 228,64 | 334 | 229,70 | ||||
| 2025-07-15 | 13F | Verum Partners LLC | 8.683 | 137,37 | 676 | 138,52 | ||||
| 2025-08-05 | 13F | Integrity Wealth Solutions LLC | 43.625 | 17,68 | 3.394 | 18,05 | ||||
| 2025-07-09 | 13F | GSG Advisors LLC | 8.146 | 0,73 | 634 | 2,43 | ||||
| 2025-07-22 | 13F | Apexium Financial, Lp | 64.188 | 134,04 | 4.994 | 134,74 | ||||
| 2025-07-21 | 13F | Capital Planning LLC | 2.812 | 0,00 | 219 | 0,00 | ||||
| 2025-07-28 | 13F | BRYN MAWR TRUST Co | 6.652 | -0,20 | 518 | 0,19 | ||||
| 2025-08-14 | 13F | UBS Group AG | 351 | 51,29 | 27 | 58,82 | ||||
| 2025-08-14 | 13F | Royal Bank Of Canada | 176.531 | 16,11 | 13.735 | 16,47 | ||||
| 2025-07-25 | 13F | Landmark Wealth Management, LLC | 82.113 | -2,30 | 6 | 0,00 | ||||
| 2025-07-22 | 13F | Oak Hill Wealth Advisors, Llc | 11.361 | 91,26 | 874 | 89,78 | ||||
| 2025-07-25 | 13F | Investment Advisory Group, LLC | 26.114 | 23,30 | 2.032 | 23,69 | ||||
| 2025-08-11 | 13F | Private Advisor Group, LLC | 4.033 | 0,12 | 314 | 0,32 | ||||
| 2025-07-18 | 13F | Vicus Capital | 16.146 | 1.256 | ||||||
| 2025-08-11 | 13F | Diversified Portfolios, Inc. | 159.866 | 19,15 | 12.438 | 19,53 | ||||
| 2025-07-09 | 13F | Triumph Capital Management | 29.213 | 2.273 | ||||||
| 2025-07-24 | 13F | IFP Advisors, Inc | 1.140 | 89 | ||||||
| 2025-08-07 | 13F | Panoramic Investment Advisors, Llc | 72.716 | -26,79 | 5.657 | -26,56 | ||||
| 2025-08-14 | 13F | Acorn Wealth Advisors, LLC | 4.012 | 2,43 | 312 | 2,97 | ||||
| 2025-08-13 | 13F | RIA Advisory Group LLC | 0 | -100,00 | 0 | |||||
| 2025-07-31 | 13F | Cambridge Investment Research Advisors, Inc. | 8.885 | 215,41 | 1 | |||||
| 2025-08-04 | 13F | Bay Colony Advisory Group, Inc d/b/a Bay Colony Advisors | 3.039 | 0,03 | 236 | 0,43 | ||||
| 2025-08-15 | 13F | Morgan Stanley | 291 | 23 |