Grundlæggende statistik
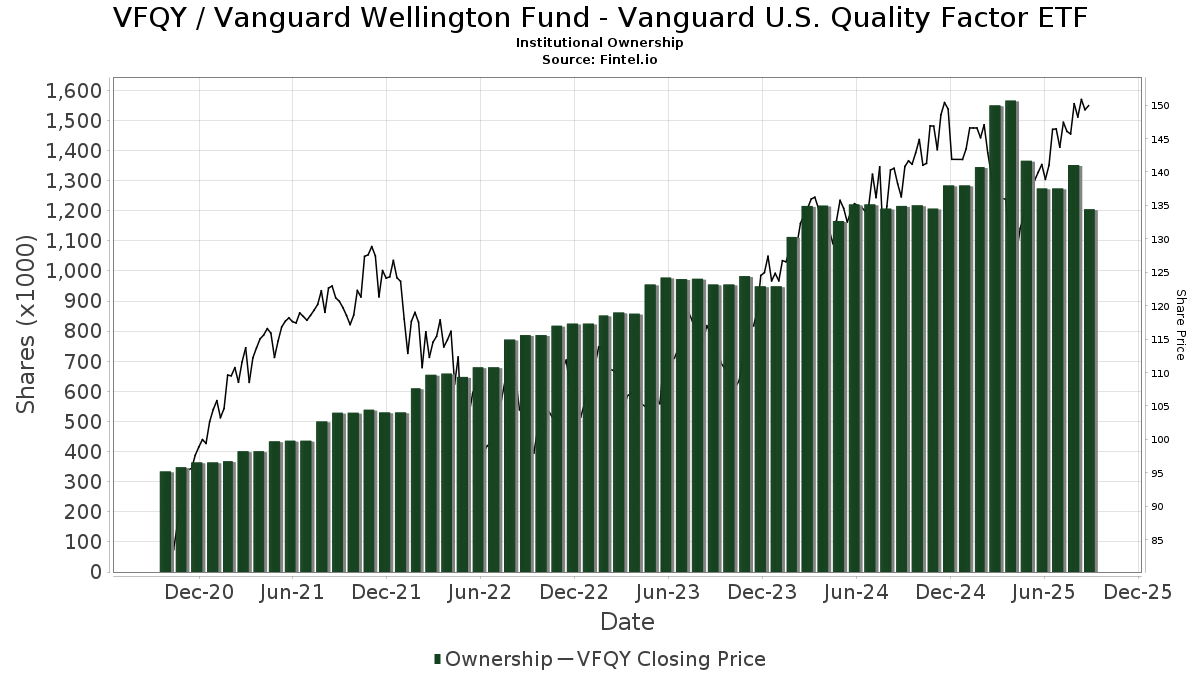
| Institutionelle ejere | 97 total, 97 long only, 0 short only, 0 long/short - change of 11,36% MRQ |
| Gennemsnitlig porteføljeallokering | 0.2263 % - change of -34,77% MRQ |
| Institutionelle aktier (lange) | 1.148.516 (ex 13D/G) - change of -0,04MM shares -3,02% MRQ |
| Institutionel værdi (lang) | $ 167.367 USD ($1000) |
Institutionelt ejerskab og aktionærer
Vanguard Wellington Fund - Vanguard U.S. Quality Factor ETF (US:VFQY) har 97 institutionelle ejere og aktionærer, der har indsendt 13D/G- eller 13F-formularer til Securities Exchange Commission (SEC). Disse institutioner har i alt 1,148,516 aktier. Største aktionærer omfatter Armbruster Capital Management, Inc., Pure Financial Advisors, Inc., Foundations Investment Advisors, LLC, Colony Group, LLC, Cedar Point Capital Partners, LLC, Genesis Wealth Advisors, LLC, Hobart Private Capital, LLC, Advisor Group Holdings, Inc., LPL Financial LLC, and Beacon Financial Planning, Inc .
Vanguard Wellington Fund - Vanguard U.S. Quality Factor ETF (BATS:VFQY) institutionel ejerskabsstruktur viser aktuelle positioner i virksomheden efter institutioner og fonde, samt seneste ændringer i positionsstørrelse. Større aktionærer kan omfatte individuelle investorer, investeringsforeninger, hedgefonde eller institutioner. Skema 13D angiver, at investoren besidder (eller besidder) mere end 5 % af virksomheden og har til hensigt (eller har til hensigt at) aktivt at forfølge en ændring i forretningsstrategi. Skema 13G indikerer en passiv investering på over 5%.
The share price as of April 24, 2026 is 158,39 / share. Previously, on April 28, 2025, the share price was 130,52 / share. This represents an increase of 21,36% over that period.
Fondens stemningsscore
Fund Sentiment Score (fka Ownership Accumulation Score) finder de aktier, der bliver mest købt af fonde. Det er resultatet af en sofistikeret, multi-faktor kvantitativ model, der identificerer virksomheder med de højeste niveauer af institutionel akkumulering. Scoringsmodellen bruger en kombination af den samlede stigning i oplyste ejere, ændringerne i porteføljeallokeringer i disse ejere og andre målinger. Tallet går fra 0 til 100, hvor højere tal indikerer et højere niveau af akkumulering for sine jævnaldrende, og 50 er gennemsnittet.
Opdateringsfrekvens: Dagligt
Se Ownership Explorer, som giver en liste over højest rangerende virksomheder.
AI+ Ask Fintel’s AI assistant about Vanguard Wellington Fund - Vanguard U.S. Quality Factor ETF.
Select a question to share a public post with an AI-crafted answer.
Thinking of good questions…
Institutionel Put/Call-forhold
Ud over at indberette standardaktie- og gældsudstedelser skal institutter med mere end 100 mill. aktiver under forvaltning også oplyse deres put- og call-optionsbeholdninger. Da salgsoptioner generelt indikerer negativ stemning, og købsoptioner indikerer positiv stemning, kan vi få en fornemmelse af den overordnede institutionelle stemning ved at plotte forholdet mellem put og kald. Diagrammet til højre viser det historiske put/call-forhold for dette instrument.
Brug af Put/Call Ratio som en indikator for investorernes stemning overvinder en af de vigtigste mangler ved at bruge totalt institutionelt ejerskab, som er, at en betydelig mængde af aktiver under forvaltning investeres passivt for at spore indekser. Passivt forvaltede fonde køber typisk ikke optioner, så indikatoren for put/call-forholdet følger mere nøje følelsen af aktivt forvaltede fonde.
13F og NPORT arkivering
Detaljer om 13F-arkivering er gratis. Detaljer om NP-ansøgninger kræver et premium-medlemskab. Grønne rækker angiver nye positioner. Røde rækker angiver lukkede positioner. Klik på linket ikon for at se den fulde transaktionshistorik.
Opgrader
for at låse premium-data op og eksportere til Excel ![]() .
.
| Fil dato | Kilde | Investor | Type | Gennemsnitlig pris (Øst) |
Aktier | Δ Aktier (%) |
Rapporteret Værdi ($1000) |
Δ Værdi (%) |
Port Alloc (%) |
|
|---|---|---|---|---|---|---|---|---|---|---|
| 2026-01-30 | 13F | Strategic Blueprint, LLC | 0 | -100,00 | 0 | |||||
| 2026-02-09 | 13F | Interactive Financial Advisors | 7.696 | -3,61 | 1.181 | -1,99 | ||||
| 2026-04-13 | 13F | Professional Financial Advisors, LLC | 2.373 | -91,42 | 354 | -91,66 | ||||
| 2026-01-28 | 13F | Kingswood Wealth Advisors, Llc | 2.000 | 0,00 | 307 | 1,66 | ||||
| 2026-04-24 | 13F | Root Financial Partners, LLC | 12.064 | 52,44 | 1.800 | 48,27 | ||||
| 2026-02-17 | 13F | Susquehanna International Group, Llp | 5.311 | 815 | ||||||
| 2025-11-12 | 13F | Stifel Financial Corp | 0 | -100,00 | 0 | |||||
| 2026-02-17 | 13F | Advisor Group Holdings, Inc. | 39.878 | 3,88 | 6.123 | 5,77 | ||||
| 2026-04-22 | 13F | Beacon Financial Planning, Inc | 28.092 | 47,54 | 4.192 | 43,56 | ||||
| 2026-01-15 | 13F | Royal Fund Management, LLC | 15.389 | 25,97 | 2.368 | 28,07 | ||||
| 2026-02-11 | 13F | Cerity Partners LLC | 1.607 | -7,75 | 247 | -6,11 | ||||
| 2026-02-17 | 13F | Blair William & Co/il | 170 | 26 | ||||||
| 2026-02-10 | 13F | Tidemark, LLC | 278 | 0,00 | 43 | 2,44 | ||||
| 2026-02-06 | 13F | Pnc Financial Services Group, Inc. | 1.000 | 66,67 | 153 | 70,00 | ||||
| 2026-02-11 | 13F | Jpmorgan Chase & Co | 1.790 | -29,47 | 275 | -28,27 | ||||
| 2026-02-13 | 13F | Kestra Advisory Services, LLC | 574 | 88 | ||||||
| 2026-02-26 | 13F | TD Capital Management LLC | 36 | 0,00 | 5 | 0,00 | ||||
| 2026-04-16 | 13F | First Community Trust Na | 450 | 0,00 | 67 | -2,90 | ||||
| 2026-02-13 | 13F | Aptus Capital Advisors, LLC | 1.761 | 0,34 | 270 | 2,27 | ||||
| 2026-01-14 | 13F | Kraft, Davis & Associates, LLC | 3.434 | -1,86 | 542 | 2,26 | ||||
| 2026-01-27 | 13F | Security Financial Services, INC. | 3.683 | 0,11 | 565 | 1,81 | ||||
| 2026-02-10 | 13F | Foundations Investment Advisors, LLC | 129.734 | 2,75 | 19.902 | 4,52 | ||||
| 2026-02-12 | 13F | Commonwealth Equity Services, Llc | 4.077 | -24,61 | 625 | |||||
| 2026-02-17 | 13F | Wiley Bros.-aintree Capital, Llc | 1.473 | 226 | ||||||
| 2026-02-13 | 13F | Genesis Wealth Advisors, LLC | 57.030 | 2,10 | 8.749 | 3,85 | ||||
| 2025-11-06 | 13F | Ameritas Advisory Services, LLC | 0 | -100,00 | 0 | -100,00 | ||||
| 2026-04-16 | 13F | Capital Advisors, Ltd. LLC | 22.054 | -7,40 | 3 | 0,00 | ||||
| 2025-11-13 | 13F | Parallel Advisors, LLC | 0 | -100,00 | 0 | |||||
| 2026-04-24 | 13F | Medallion Wealth Advisors, LLC | 27.474 | 5,01 | 4.100 | 2,17 | ||||
| 2026-02-17 | 13F | Raymond James Financial Inc | 8.860 | -27,98 | 1.359 | -26,74 | ||||
| 2025-11-17 | 13F | FSA Wealth Management LLC | 26 | -53,57 | 5 | -55,56 | ||||
| 2026-02-17 | 13F | Glenmede Trust Co Na | 0 | -100,00 | 0 | |||||
| 2026-02-13 | 13F | Colony Group, LLC | 77.777 | -2,20 | 11.932 | -0,52 | ||||
| 2026-02-11 | 13F | Cedar Point Capital Partners, LLC | 67.138 | -2,64 | 10.300 | -0,97 | ||||
| 2026-02-03 | 13F | McIlrath & Eck, LLC | 274 | 0,00 | 42 | 2,44 | ||||
| 2026-01-06 | 13F | Tucker Asset Management Llc | 0 | -100,00 | 0 | |||||
| 2026-02-05 | 13F | Cambridge Investment Research Advisors, Inc. | 4.063 | 6,36 | 1 | |||||
| 2026-02-03 | 13F | International Assets Investment Management, Llc | 438 | 67 | ||||||
| 2026-04-16 | 13F | Quotient Wealth Partners, LLC | 1.343 | 0,00 | 200 | -2,91 | ||||
| 2026-02-17 | 13F | Royal Bank Of Canada | 2.965 | -0,17 | 455 | 1,56 | ||||
| 2026-04-10 | 13F | Pure Financial Advisors, Inc. | 136.998 | 20.445 | ||||||
| 2026-02-13 | 13F | Integrated Wealth Concepts LLC | 7.724 | -19,88 | 1.185 | -18,57 | ||||
| 2026-04-08 | 13F | Wealth Enhancement Advisory Services, Llc | 2.261 | -48,46 | 340 | -50,94 | ||||
| 2026-04-07 | 13F | Hobart Private Capital, LLC | 47.470 | -0,63 | 7.084 | -3,33 | ||||
| 2026-04-03 | 13F | Coastline Trust Co | 14.226 | -1,11 | 2.123 | -3,81 | ||||
| 2026-02-10 | 13F/A | Northwestern Mutual Wealth Management Co | 160 | 135,29 | 25 | 140,00 | ||||
| 2026-01-13 | 13F | Kathmere Capital Management, LLC | 4.349 | 6,05 | 667 | 7,93 | ||||
| 2026-04-08 | 13F | WealthCare Investment Partners, LLC | 3.401 | 33,48 | 509 | 29,85 | ||||
| 2026-01-21 | 13F | Raleigh Capital Management Inc. | 129 | 0,00 | 20 | 0,00 | ||||
| 2026-04-13 | 13F | IFP Advisors, Inc | 736 | 0,00 | 110 | -2,68 | ||||
| 2026-04-13 | 13F | Salem Investment Counselors Inc | 634 | 95 | ||||||
| 2026-02-17 | 13F | Creative Planning | 3.626 | -1,20 | 556 | 0,54 | ||||
| 2025-11-12 | 13F | Us Bancorp \de\ | 0 | -100,00 | 0 | |||||
| 2026-04-07 | 13F | CoreCap Advisors, LLC | 138 | 21 | ||||||
| 2026-02-12 | 13F | Wealthspire Advisors, LLC | 0 | -100,00 | 0 | |||||
| 2026-02-17 | 13F | Two Sigma Investments, Lp | 0 | -100,00 | 0 | |||||
| 2026-04-10 | 13F | Melfa Wealth Management, Llc | 1.645 | 3,26 | 246 | 0,41 | ||||
| 2026-04-24 | 13F | Private Advisor Group, LLC | 3.150 | -7,35 | 470 | -9,79 | ||||
| 2026-04-27 | 13F | BIP Wealth, LLC | 3.404 | -10,94 | 508 | -13,48 | ||||
| 2026-02-12 | 13F | Jane Street Group, Llc | 3.311 | 15,05 | 508 | 16,82 | ||||
| 2026-01-29 | 13F | D.a. Davidson & Co. | 4.970 | 0,00 | 762 | 1,74 | ||||
| 2026-01-13 | 13F | Synergy Financial Management, LLC | 0 | -100,00 | 0 | |||||
| 2026-02-04 | 13F | LRI Investments, LLC | 69 | -15,85 | 11 | -16,67 | ||||
| 2026-02-10 | 13F | Thoroughbred Financial Services, Llc | 2.080 | -0,81 | 0 | |||||
| 2026-02-17 | 13F | Bank Of America Corp /de/ | 14.140 | 22,89 | 2.169 | 25,01 | ||||
| 2026-04-21 | 13F | Vise Technologies, Inc. | 5.533 | 0,00 | 849 | 0,00 | ||||
| 2026-01-26 | 13F | Cwm, Llc | 245 | 0,00 | 0 | |||||
| 2025-11-12 | 13F | Total Clarity Wealth Management, Inc. | 0 | -100,00 | 0 | |||||
| 2026-01-29 | 13F | Sanctuary Advisors, LLC | 3.622 | -8,67 | 556 | -7,19 | ||||
| 2026-02-18 | 13F | Caitlin John, LLC | 5.550 | 2,10 | 851 | 3,91 | ||||
| 2026-02-17 | 13F | Old Mission Capital Llc | 5.804 | 21,40 | 890 | 23,44 | ||||
| 2026-02-06 | 13F | Envestnet Portfolio Solutions, Inc. | 6.145 | 6,35 | 943 | 8,15 | ||||
| 2026-02-13 | 13F | Morgan Stanley | 457 | 22,52 | 70 | 25,00 | ||||
| 2026-02-12 | 13F | BlackRock, Inc. | 1 | 0 | ||||||
| 2026-02-05 | 13F | Center for Financial Planning, Inc. | 900 | 0,00 | 138 | 2,22 | ||||
| 2026-02-12 | 13F | Steward Partners Investment Advisory, Llc | 7 | 1 | ||||||
| 2026-04-20 | 13F | City State Bank | 100 | 0,00 | 15 | -6,67 | ||||
| 2026-02-03 | 13F | RWM Asset Management, LLC | 3.129 | 0,00 | 496 | 5,10 | ||||
| 2026-02-13 | 13F | Wells Fargo & Company/mn | 20 | 3 | ||||||
| 2026-04-17 | 13F | United Advisor Group, LLC | 1.380 | 0,00 | 206 | -2,84 | ||||
| 2026-04-08 | 13F | Dynamic Advisor Solutions LLC | 2.172 | 6,21 | 324 | 3,51 | ||||
| 2026-02-14 | 13F | Rockefeller Capital Management L.P. | 42 | 0,00 | 6 | 0,00 | ||||
| 2026-04-13 | 13F | Mather Group, Llc. | 213 | 32 | ||||||
| 2026-01-28 | 13F | Chicago Partners Investment Group LLC | 12.081 | -14,78 | 1.907 | -11,88 | ||||
| 2026-02-11 | 13F | LPL Financial LLC | 39.270 | 3,31 | 6.024 | 5,09 | ||||
| 2026-01-27 | 13F | Cannon Wealth Management Services, LLC | 26.534 | 493,20 | 4.071 | 503,86 | ||||
| 2026-02-02 | 13F | Horizon Investments, LLC | 132 | 20 | ||||||
| 2026-04-17 | 13F | AdvisorNet Financial, Inc | 67 | 0,00 | 10 | -10,00 | ||||
| 2026-01-29 | 13F | Comerica Bank | 580 | 0,00 | 89 | 1,15 | ||||
| 2026-02-11 | 13F | Arrowroot Family Office, LLC | 4.141 | -1,40 | 635 | 0,32 | ||||
| 2026-04-07 | 13F | Farther Finance Advisors, LLC | 204 | 0,00 | 31 | -3,23 | ||||
| 2026-04-21 | 13F | Armbruster Capital Management, Inc. | 190.437 | 2,36 | 28.419 | -0,42 | ||||
| 2026-04-22 | 13F | Apollon Wealth Management, LLC | 1.410 | 5,78 | 210 | 2,94 | ||||
| 2026-02-12 | 13F | Triumph Capital Management | 37 | 0,00 | 6 | 0,00 | ||||
| 2026-01-26 | 13F | AE Wealth Management LLC | 3.199 | 491 | ||||||
| 2026-01-29 | 13F | UBS Group AG | 756 | 0,00 | 116 | 0,88 | ||||
| 2026-02-19 | 13F | CI Private Wealth, LLC | 12.191 | 0,32 | 1.870 | 2,07 | ||||
| 2026-01-21 | 13F | Walkner Condon Financial Advisors LLC | 2.365 | 0,00 | 363 | 1,69 | ||||
| 2026-04-23 | 13F | Glass Jacobson Investment Advisors llc | 442 | 0,00 | 66 | -2,99 | ||||
| 2026-02-04 | 13F | Nwam Llc | 3.629 | -70,40 | 575 | -68,99 | ||||
| 2026-04-07 | 13F | Signaturefd, Llc | 206 | -0,48 | 31 | -3,23 | ||||
| 2026-04-22 | 13F | JNBA Financial Advisors | 216 | 0,47 | 32 | -3,03 | ||||
| 2026-02-10 | 13F | Goldman Sachs Group Inc | 4.612 | 0,00 | 708 | 1,73 | ||||
| 2025-11-12 | 13F | Cobblestone Capital Advisors Llc /ny/ | 1.330 | 201 | ||||||
| 2026-01-08 | 13F | GSG Advisors LLC | 4.283 | 0,33 | 657 | 1,86 | ||||
| 2026-02-17 | 13F | Fmr Llc | 0 | 0 | ||||||
| 2026-04-23 | 13F | Blackston Financial Advisory Group, LLC | 1.422 | -1,80 | 212 | -4,50 | ||||
| 2026-02-11 | 13F | M Holdings Securities, Inc. | 16.417 | 3 | ||||||
| 2026-02-23 | 13F | Beaird Harris Wealth Management, LLC | 302 | -20,11 | 46 | -17,86 |