Grundlæggende statistik
| Institutionelle aktier (lange) | 28.042.212 - 66,84% (ex 13D/G) - change of -7,04MM shares -20,06% MRQ |
| Institutionel værdi (lang) | $ 2.193.614 USD ($1000) |
Institutionelt ejerskab og aktionærer
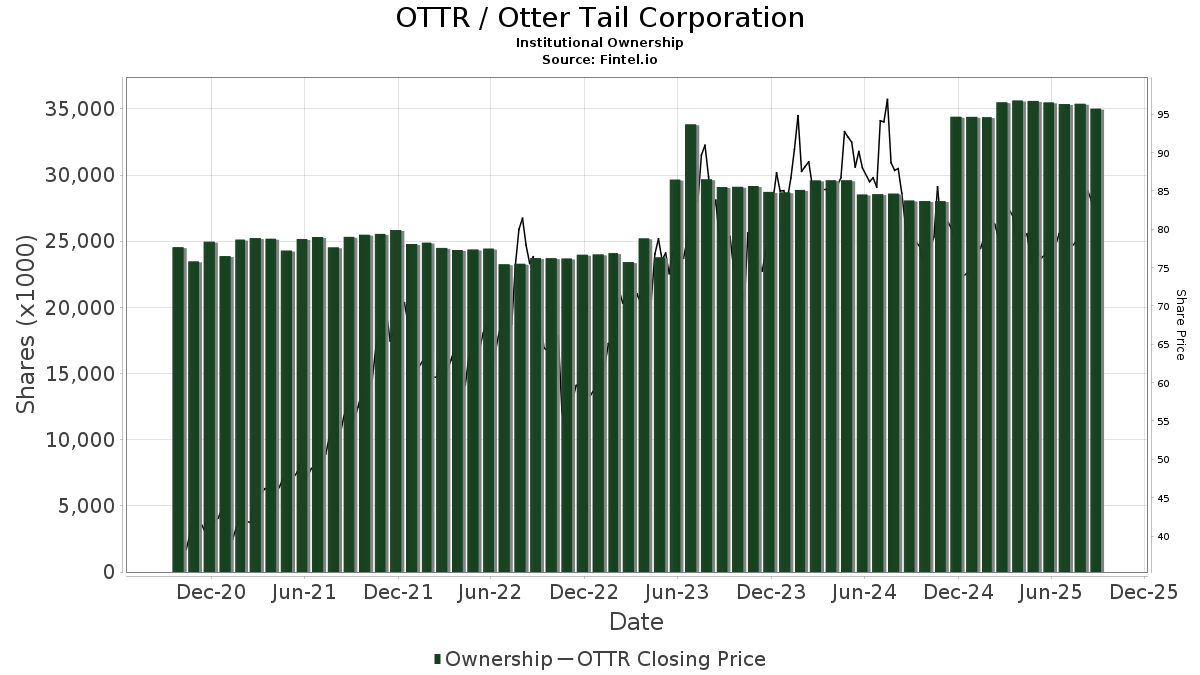
Otter Tail Corporation (US:OTTR) har 348 institutionelle ejere og aktionærer, der har indsendt 13D/G- eller 13F-formularer til Securities Exchange Commission (SEC). Disse institutioner har i alt 28,042,212 aktier. Største aktionærer omfatter BlackRock, Inc., Vanguard Group Inc, State Street Corp, Geode Capital Management, Llc, Dimensional Fund Advisors Lp, First Trust Advisors Lp, Morgan Stanley, Caisse De Depot Et Placement Du Quebec, Lsv Asset Management, and Charles Schwab Investment Management Inc .
Otter Tail Corporation (NasdaqGS:OTTR) institutionel ejerskabsstruktur viser aktuelle positioner i virksomheden efter institutioner og fonde, samt seneste ændringer i positionsstørrelse. Større aktionærer kan omfatte individuelle investorer, investeringsforeninger, hedgefonde eller institutioner. Skema 13D angiver, at investoren besidder (eller besidder) mere end 5 % af virksomheden og har til hensigt (eller har til hensigt at) aktivt at forfølge en ændring i forretningsstrategi. Skema 13G indikerer en passiv investering på over 5%.
The share price as of April 24, 2026 is 88,15 / share. Previously, on April 28, 2025, the share price was 78,00 / share. This represents an increase of 13,01% over that period.
Fondens stemningsscore
Fund Sentiment Score (fka Ownership Accumulation Score) finder de aktier, der bliver mest købt af fonde. Det er resultatet af en sofistikeret, multi-faktor kvantitativ model, der identificerer virksomheder med de højeste niveauer af institutionel akkumulering. Scoringsmodellen bruger en kombination af den samlede stigning i oplyste ejere, ændringerne i porteføljeallokeringer i disse ejere og andre målinger. Tallet går fra 0 til 100, hvor højere tal indikerer et højere niveau af akkumulering for sine jævnaldrende, og 50 er gennemsnittet.
Opdateringsfrekvens: Dagligt
Se Ownership Explorer, som giver en liste over højest rangerende virksomheder.
AI+ Ask Fintel’s AI assistant about Otter Tail Corporation.
Select a question to share a public post with an AI-crafted answer.
Thinking of good questions…
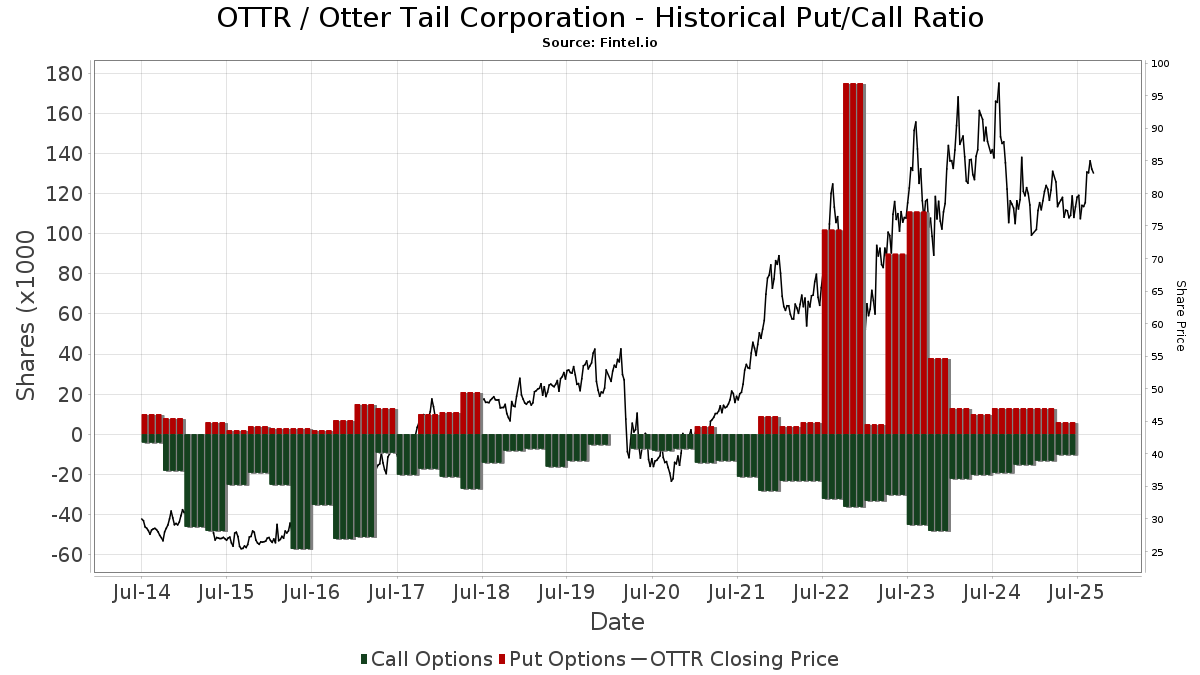
Institutionel Put/Call-forhold
Ud over at indberette standardaktie- og gældsudstedelser skal institutter med mere end 100 mill. aktiver under forvaltning også oplyse deres put- og call-optionsbeholdninger. Da salgsoptioner generelt indikerer negativ stemning, og købsoptioner indikerer positiv stemning, kan vi få en fornemmelse af den overordnede institutionelle stemning ved at plotte forholdet mellem put og kald. Diagrammet til højre viser det historiske put/call-forhold for dette instrument.
Brug af Put/Call Ratio som en indikator for investorernes stemning overvinder en af de vigtigste mangler ved at bruge totalt institutionelt ejerskab, som er, at en betydelig mængde af aktiver under forvaltning investeres passivt for at spore indekser. Passivt forvaltede fonde køber typisk ikke optioner, så indikatoren for put/call-forholdet følger mere nøje følelsen af aktivt forvaltede fonde.
13D/G-arkivering
Vi præsenterer 13D/G ansøgninger separat fra 13F ansøgninger på grund af den forskellige behandling af SEC. 13D/G-ansøgninger kan indgives af grupper af investorer (med én ledende), hvorimod 13F-ansøgninger ikke kan. Dette resulterer i situationer, hvor en investor kan indsende en 13D/G, der rapporterer én værdi for de samlede aktier (der repræsenterer alle de aktier, der ejes af investorgruppen), men derefter indsender en 13F, der rapporterer en anden værdi for de samlede aktier (der udelukkende repræsenterer deres egne) ejendomsret). Det betyder, at aktieejerskab af 13D/G-arkiver og 13F-arkiveringer ofte ikke er direkte sammenlignelige, så vi præsenterer dem separat.
Bemærk: Fra den 16. maj 2021 viser vi ikke længere ejere, der ikke har indsendt en 13D/G inden for det seneste år. Tidligere viste vi den fulde historie af 13D/G-arkiver. Generelt skal enheder, der er forpligtet til at indgive 13D/G-ansøgninger, indgive mindst årligt, før de indsender en afsluttende ansøgning. Dog forlader fonde nogle gange positioner uden at indsende en afsluttende ansøgning (dvs. de afvikler), så visning af den fulde historie resulterede nogle gange i forvirring om det nuværende ejerskab. For at undgå forvirring viser vi nu kun 'aktuelle' ejere - det vil sige - ejere, der har anmeldt inden for det seneste år.
Upgrade to unlock premium data.
| Fil dato | Form | Investor | Forrige Aktier |
Seneste Aktier |
Δ Aktier (Procent) |
Ejendomsret (Procent) |
Δ Ejerskab (Procent) |
|
|---|---|---|---|---|---|---|---|---|
| 2026-03-27 | VANGUARD GROUP INC | 5,040,893 | 0 | -100.00 | 0.00 | -100.00 |
13F og NPORT arkivering
Detaljer om 13F-arkivering er gratis. Detaljer om NP-ansøgninger kræver et premium-medlemskab. Grønne rækker angiver nye positioner. Røde rækker angiver lukkede positioner. Klik på linket ikon for at se den fulde transaktionshistorik.
Opgrader
for at låse premium-data op og eksportere til Excel ![]() .
.
| Fil dato | Kilde | Investor | Type | Gennemsnitlig pris (Øst) |
Aktier | Δ Aktier (%) |
Rapporteret Værdi ($1000) |
Δ Værdi (%) |
Port Alloc (%) |
|
|---|---|---|---|---|---|---|---|---|---|---|
| 2026-04-09 | 13F | Secure Asset Management, LLC | 0 | -100,00 | 0 | |||||
| 2025-11-13 | 13F | Fuller & Thaler Asset Management, Inc. | 0 | -100,00 | 0 | |||||
| 2026-02-18 | 13F | GWM Advisors LLC | 16.231 | -4,35 | 1.312 | -5,75 | ||||
| 2026-02-09 | 13F | Keating Financial Advisory Services, Inc. | 42 | 3 | ||||||
| 2026-02-09 | 13F | New Age Alpha Advisors, LLC | 5.322 | 0,76 | 430 | -0,46 | ||||
| 2026-01-28 | 13F | DekaBank Deutsche Girozentrale | 1.526 | 0,00 | 0 | |||||
| 2026-02-17 | 13F | IHT Wealth Management, LLC | 0 | -100,00 | 0 | |||||
| 2025-11-13 | 13F | Quadrature Capital Ltd | 0 | -100,00 | 0 | |||||
| 2026-02-17 | 13F | Ameriprise Financial Inc | 98.493 | -4,63 | 7.959 | -5,98 | ||||
| 2026-02-17 | 13F | Modern Wealth Management, LLC | 5.163 | 15,14 | 417 | 13,62 | ||||
| 2026-01-28 | 13F | Teacher Retirement System Of Texas | 0 | -100,00 | 0 | |||||
| 2025-11-14 | 13F | Texas Permanent School Fund | 0 | -100,00 | 0 | |||||
| 2026-04-24 | 13F | Private Advisor Group, LLC | 7.739 | 63,62 | 679 | 77,75 | ||||
| 2026-02-13 | 13F | Bridgewater Associates, LP | 0 | -100,00 | 0 | -100,00 | ||||
| 2026-04-06 | 13F | GAMMA Investing LLC | 739 | 33,63 | 65 | 45,45 | ||||
| 2026-02-17 | 13F | California State Teachers Retirement System | 35.754 | 2,59 | 2.889 | 1,16 | ||||
| 2026-04-17 | 13F | Fifth Third Wealth Advisors LLC | 4.518 | 1,28 | 397 | 10,00 | ||||
| 2026-04-24 | 13F | Profund Advisors Llc | 0 | -100,00 | 0 | |||||
| 2026-04-14 | 13F | Nbc Securities, Inc. | 0 | -100,00 | 0 | |||||
| 2026-02-09 | 13F | Integrity Alliance, Llc. | 2.809 | 227 | ||||||
| 2026-02-12 | 13F | New York State Common Retirement Fund | 69.282 | -0,15 | 5.599 | -1,56 | ||||
| 2026-02-03 | 13F | International Assets Investment Management, Llc | 1.009 | 82 | ||||||
| 2026-02-19 | 13F | Invesco Ltd. | 231.178 | -2,31 | 18.681 | -3,69 | ||||
| 2026-04-15 | 13F | Exchange Traded Concepts, Llc | 12.673 | -14,25 | 1.112 | -6,87 | ||||
| 2026-02-09 | 13F | Quest Partners LLC | 30.566 | 52,00 | 2.470 | 49,88 | ||||
| 2026-04-23 | 13F | Asset Planning,Inc | 500 | 0,00 | 44 | 7,50 | ||||
| 2026-02-05 | 13F | Gamco Investors, Inc. Et Al | 272.350 | 0,00 | 22.009 | -1,42 | ||||
| 2026-01-27 | 13F | Fortis Capital Advisors, LLC | 9.748 | 788 | ||||||
| 2026-04-21 | 13F | Foster & Motley Inc | 7.750 | -4,14 | 1 | |||||
| 2026-02-10 | 13F | Commonwealth Of Pennsylvania Public School Empls Retrmt Sys | 10.375 | -2,78 | 838 | -4,12 | ||||
| 2026-04-10 | 13F | Linden Thomas Advisory Services, LLC | 22.663 | 95,78 | 1.989 | 112,73 | ||||
| 2026-02-06 | 13F | Global Retirement Partners, LLC | 1.214 | -3,34 | 98 | -3,92 | ||||
| 2026-02-13 | 13F | Public Sector Pension Investment Board | 0 | -100,00 | 0 | |||||
| 2025-11-14 | 13F | ExodusPoint Capital Management, LP | 0 | -100,00 | 0 | |||||
| 2026-02-18 | 13F | Beacon Pointe Advisors, LLC | 2.790 | 225 | ||||||
| 2025-11-14 | 13F | Holocene Advisors, LP | 0 | -100,00 | 0 | |||||
| 2026-01-15 | 13F | Allspring Global Investments Holdings, LLC | 11.126 | 9,57 | 906 | 10,76 | ||||
| 2026-02-13 | 13F | Ossiam | 0 | -100,00 | 0 | |||||
| 2026-02-10 | 13F | Lido Advisors, LLC | 4.737 | 2,78 | 387 | 2,65 | ||||
| 2025-11-14 | 13F | Point72 (DIFC) Ltd | 0 | -100,00 | 0 | |||||
| 2026-04-22 | 13F | Janney Montgomery Scott LLC | 6.049 | 46,50 | 1 | |||||
| 2025-11-14 | 13F | National Bank Of Canada /fi/ | 0 | -100,00 | 0 | -100,00 | ||||
| 2025-10-30 | 13F | Twin Peaks Wealth Advisors, LLC | 0 | -100,00 | 0 | -100,00 | ||||
| 2026-01-28 | 13F | Eagle Global Advisors Llc | 10.480 | 847 | ||||||
| 2025-11-14 | 13F | Point72 Asia (Singapore) Pte. Ltd. | 0 | -100,00 | 0 | |||||
| 2025-11-14 | 13F | Brevan Howard Capital Management LP | 0 | -100,00 | 0 | |||||
| 2026-01-29 | 13F | UBS Group AG | 95.588 | -35,48 | 7.724 | -36,39 | ||||
| 2026-02-12 | 13F | Financial Engines Advisors L.L.C. | 30.590 | 2,00 | 2.472 | 0,53 | ||||
| 2026-04-24 | 13F | Bayban | 5.201 | 11,39 | 456 | 20,95 | ||||
| 2026-02-17 | 13F | Voloridge Investment Management, Llc | 112.021 | -2,48 | 9.052 | -3,86 | ||||
| 2026-02-06 | 13F | EverSource Wealth Advisors, LLC | 376 | 129,27 | 30 | 130,77 | ||||
| 2026-02-11 | 13F | Brandywine Global Investment Management, LLC | 82.701 | -3,49 | 6.683 | -4,85 | ||||
| 2026-02-17 | 13F | Public Employees Retirement System Of Ohio | 640 | -0,78 | 52 | -1,92 | ||||
| 2026-02-13 | 13F | Edgestream Partners, L.P. | 0 | -100,00 | 0 | |||||
| 2026-04-20 | 13F | Louisiana State Employees Retirement System | 18.600 | -3,12 | 1.633 | 5,22 | ||||
| 2026-04-27 | 13F | Sound Income Strategies, LLC | 286 | 248,78 | 25 | 257,14 | ||||
| 2026-02-10 | 13F/A | Northwestern Mutual Wealth Management Co | 950 | 43,72 | 77 | 40,74 | ||||
| 2026-04-22 | 13F | Pictet Asset Management Holding SA | 7.080 | 9,50 | 621 | 18,97 | ||||
| 2026-02-13 | 13F | Victory Capital Management Inc | 128.413 | 1,19 | 10.377 | -0,24 | ||||
| 2026-04-23 | 13F | SJS Investment Consulting Inc. | 3 | 0,00 | 0 | |||||
| 2026-04-22 | 13F | Goodman Advisory Group, LLC | 667 | 0,00 | 59 | 9,43 | ||||
| 2026-02-17 | 13F | RMB Capital Management, LLC | 8.350 | 675 | ||||||
| 2026-01-30 | 13F | Wealth Forward, LLC | 4.238 | 0,00 | 342 | -1,44 | ||||
| 2026-02-12 | 13F | Alps Advisors Inc | 21.695 | -6,38 | 1.753 | -7,69 | ||||
| 2026-02-03 | 13F | Denali Advisors Llc | 88.703 | 2,99 | 7.168 | 1,54 | ||||
| 2026-02-13 | 13F | Healthcare Of Ontario Pension Plan Trust Fund | 62.918 | 123,23 | 5.084 | 120,09 | ||||
| 2026-02-10 | 13F | Acadian Asset Management Llc | 0 | -100,00 | 0 | |||||
| 2026-02-12 | 13F | Voya Investment Management Llc | 9.320 | -1,59 | 753 | -2,96 | ||||
| 2026-02-09 | 13F | Huntington National Bank | 0 | -100,00 | 0 | |||||
| 2026-02-11 | 13F | Vestcor Inc | 4.969 | 67,36 | 0 | |||||
| 2026-02-17 | 13F | Creative Planning | 6.048 | 0,60 | 489 | -0,81 | ||||
| 2026-01-26 | 13F | Whittier Trust Co | 90.046 | 0,12 | 7.375 | 2,82 | ||||
| 2026-02-13 | 13F | Rhumbline Advisers | 97.311 | -5,38 | 7.864 | -6,73 | ||||
| 2026-03-06 | 13F | Hsbc Holdings Plc | 0 | -100,00 | 0 | |||||
| 2026-01-06 | 13F | Sanctuary Advisors, LLC | 0 | -100,00 | 0 | |||||
| 2026-02-17 | 13F | Atom Investors LP | 10.412 | -28,04 | 841 | -29,09 | ||||
| 2026-02-17 | 13F | ISAM Funds (UK) Ltd | 0 | -100,00 | 0 | |||||
| 2025-11-14 | 13F | Occudo Quantitative Strategies Lp | 0 | -100,00 | 0 | |||||
| 2026-01-26 | 13F/A | Phocas Financial Corp. | 97.678 | -0,24 | 7.893 | -1,64 | ||||
| 2026-02-17 | 13F | Cetera Investment Advisers | 16.583 | 1,17 | 1.340 | -0,22 | ||||
| 2026-04-23 | 13F | Bell Bank | 4.086 | 0,00 | 359 | 8,48 | ||||
| 2026-02-17 | 13F | Jump Financial, LLC | 4.115 | -73,45 | 333 | -73,86 | ||||
| 2026-02-13 | 13F | Charles Schwab Investment Management Inc | 532.691 | -1,62 | 43.047 | -3,01 | ||||
| 2026-02-10 | 13F | IAG Wealth Partners, LLC | 100 | -50,00 | 8 | -50,00 | ||||
| 2026-02-12 | 13F | Xponance, Inc. | 3.030 | 0,90 | 245 | -0,81 | ||||
| 2026-04-14 | 13F | USA Financial Portformulas Corp | 810 | -41,13 | 71 | -36,04 | ||||
| 2026-03-04 | 13F | SHP Wealth Management | 500 | 40 | ||||||
| 2026-02-17 | 13F | Qube Research & Technologies Ltd | 201.274 | 20,87 | 16.265 | 19,16 | ||||
| 2026-02-13 | 13F | Y-Intercept (Hong Kong) Ltd | 0 | -100,00 | 0 | |||||
| 2026-02-11 | 13F | Simplex Trading, Llc | 399 | 12,08 | 32 | |||||
| 2026-02-12 | 13F | Jane Street Group, Llc | 139.137 | 268,89 | 11.244 | 263,73 | ||||
| 2026-02-11 | 13F | Simplex Trading, Llc | Call | 100 | 8 | |||||
| 2025-11-14 | 13F | Twinbeech Capital Lp | 0 | -100,00 | 0 | |||||
| 2026-02-12 | 13F | Federated Hermes, Inc. | 205.346 | 27,39 | 16.594 | 25,59 | ||||
| 2026-04-13 | 13F | Hm Payson & Co | 1.172 | 0,00 | 103 | 8,51 | ||||
| 2026-02-10 | 13F | Quantbot Technologies LP | 7.998 | -65,52 | 646 | -66,02 | ||||
| 2026-04-01 | 13F | Bangor Savings Bank | 0 | -100,00 | 0 | |||||
| 2026-04-09 | 13F | Vista Investment Partners Llc | 9.787 | 0,00 | 859 | 8,73 | ||||
| 2026-04-24 | 13F | Mann Financial Group, Inc. | 3.129 | 0,00 | 275 | 8,73 | ||||
| 2026-02-17 | 13F | Millennium Management Llc | 146.518 | 12,46 | 11.840 | 10,87 | ||||
| 2026-02-05 | 13F | Bessemer Group Inc | 300 | 9,89 | 0 | |||||
| 2026-04-22 | 13F | Sterling Capital Management LLC | 6.332 | -37,64 | 556 | -32,32 | ||||
| 2025-11-14 | 13F | Toroso Investments, LLC | 0 | -100,00 | 0 | -100,00 | ||||
| 2026-02-17 | 13F | Aqr Capital Management Llc | 15.930 | 9,34 | 1.287 | 7,79 | ||||
| 2026-02-17 | 13F | Hotchkis & Wiley Capital Management Llc | 83.569 | 0,27 | 6.753 | -1,14 | ||||
| 2026-02-17 | 13F | Advisory Services Network, LLC | 0 | -100,00 | 0 | |||||
| 2026-04-24 | 13F | ProShare Advisors LLC | 74.889 | -5,96 | 6.573 | 2,14 | ||||
| 2026-02-11 | 13F | Picton Mahoney Asset Management | 15 | 0,00 | 1 | |||||
| 2026-01-29 | 13F | Teachers Retirement System Of The State Of Kentucky | 10.544 | -11,92 | 1 | |||||
| 2026-02-10 | 13F | Rothschild Investment Llc | 55 | -8,33 | 4 | 0,00 | ||||
| 2026-02-17 | 13F | State Of Wisconsin Investment Board | 22.401 | -6,84 | 1.810 | -8,12 | ||||
| 2026-02-11 | 13F | SOUTH STATE Corp | 0 | -100,00 | 0 | |||||
| 2026-02-06 | 13F | BOK Financial Private Wealth, Inc. | 0 | -100,00 | 0 | |||||
| 2026-02-11 | 13F | Illinois Municipal Retirement Fund | 22.205 | 1,39 | 1.794 | -0,06 | ||||
| 2026-04-22 | 13F | Smallwood Wealth Investment Management, LLC | 197 | 0,51 | 17 | 13,33 | ||||
| 2026-02-17 | 13F | D. E. Shaw & Co., Inc. | 248.239 | -4,53 | 20.060 | -5,88 | ||||
| 2026-02-04 | 13F | Virginia Retirement Systems Et Al | 20.454 | -36,19 | 1.653 | -37,11 | ||||
| 2026-02-11 | 13F | Simplex Trading, Llc | Put | 1.000 | -9,09 | 81 | ||||
| 2026-02-10 | 13F | CIBC Asset Management Inc | 2.856 | 1,10 | 231 | -0,43 | ||||
| 2026-02-24 | 13F | Alternative Investment Advisors, LLC. | 4.737 | 0,62 | 383 | -0,78 | ||||
| 2026-01-26 | 13F | Whittier Trust Co Of Nevada Inc | 48.186 | 1,52 | 3.946 | 4,25 | ||||
| 2026-02-06 | 13F | Gsa Capital Partners Llp | 18.086 | 44,53 | 1 | 0,00 | ||||
| 2026-02-12 | 13F | Quadrant Capital Group Llc | 4.538 | -0,26 | 367 | -1,61 | ||||
| 2026-02-04 | 13F | Independent Advisor Alliance | 4.236 | -0,45 | 342 | -1,72 | ||||
| 2026-02-17 | 13F | First Manhattan Co | 0 | -100,00 | 0 | |||||
| 2026-02-04 | 13F | Swiss Life Asset Management Ltd | 3.844 | 311 | ||||||
| 2026-02-12 | 13F | MetLife Investment Management, LLC | 21.098 | -6,81 | 1.705 | -8,14 | ||||
| 2026-04-17 | 13F | AdvisorNet Financial, Inc | 650 | 0,00 | 57 | 9,62 | ||||
| 2026-02-03 | 13F | Bokf, Na | 6.267 | -0,41 | 506 | -1,75 | ||||
| 2026-02-17 | 13F | Gotham Asset Management, LLC | 6.689 | 541 | ||||||
| 2026-02-12 | 13F | Commonwealth Equity Services, Llc | 23.685 | -16,28 | 1.914 | 95.550,00 | ||||
| 2026-02-05 | 13F | Allworth Financial LP | 1.342 | 10,45 | 108 | 9,09 | ||||
| 2026-02-13 | 13F | Sei Investments Co | 5.924 | 0,00 | 479 | -1,44 | ||||
| 2025-11-12 | 13F | Group One Trading, L.p. | Call | 0 | -100,00 | 0 | -100,00 | |||
| 2026-02-17 | 13F | Tudor Investment Corp Et Al | 75.005 | 6.061 | ||||||
| 2026-02-13 | 13F | Verition Fund Management LLC | 6.100 | -72,49 | 493 | -72,92 | ||||
| 2026-02-06 | 13F | Envestnet Portfolio Solutions, Inc. | 3.629 | -0,79 | 293 | -2,01 | ||||
| 2026-04-24 | 13F | Strs Ohio | 800 | 33,33 | 70 | 45,83 | ||||
| 2026-02-11 | 13F | Winton Capital Group Ltd | 14.554 | 1,08 | 1.176 | -0,34 | ||||
| 2026-02-12 | 13F | Renaissance Technologies Llc | 13.298 | -87,68 | 1.075 | -87,86 | ||||
| 2026-02-13 | 13F | Cynosure Management, Llc | 5.808 | 18,41 | 469 | 16,67 | ||||
| 2026-04-06 | 13F | Versant Capital Management, Inc | 45 | 7,14 | 4 | 0,00 | ||||
| 2026-02-02 | 13F | Benjamin Edwards Inc | 38.294 | -0,14 | 3.095 | -1,56 | ||||
| 2026-02-11 | 13F | Parallel Advisors, LLC | 0 | -100,00 | 0 | |||||
| 2026-02-13 | 13F | Kestra Advisory Services, LLC | 0 | -100,00 | 0 | |||||
| 2026-02-10 | 13F | Natixis Advisors, L.p. | 11.512 | 6,18 | 1 | |||||
| 2025-11-07 | 13F | Shell Asset Management Co | 676 | -61,08 | 0 | |||||
| 2026-04-16 | 13F | SG Americas Securities, LLC | 25.504 | 86,79 | 2 | 100,00 | ||||
| 2026-02-13 | 13F | BNP Paribas Asset Management Holding S.A. | 1.856 | 0 | ||||||
| 2026-02-17 | 13F | Tower Research Capital LLC (TRC) | 3.488 | 124,60 | 282 | 121,26 | ||||
| 2026-02-13 | 13F | Pinnacle Wealth Planning Services, Inc. | 1.981 | 160 | ||||||
| 2026-02-06 | 13F | Bare Financial Services, Inc | 88 | 76,00 | 7 | 75,00 | ||||
| 2026-02-09 | 13F | Valtinson Bruner Financial Planning LLC | 4.817 | -2,43 | 389 | -3,71 | ||||
| 2026-02-17 | 13F | Wiley Bros.-aintree Capital, Llc | 2.808 | 0,11 | 227 | -1,31 | ||||
| 2026-02-06 | 13F | Covestor Ltd | 1.581 | -33,07 | 0 | |||||
| 2026-02-12 | 13F | Swiss National Bank | 74.400 | 1,78 | 6.012 | 0,33 | ||||
| 2026-02-17 | 13F | Wellington Management Group Llp | 35.029 | 2.831 | ||||||
| 2026-02-17 | 13F | Aster Capital Management (DIFC) Ltd | 510 | 41 | ||||||
| 2026-02-10 | 13F | Nomura Asset Management Co Ltd | 220 | 0,00 | 18 | -5,56 | ||||
| 2026-04-13 | 13F | Massmutual Trust Co Fsb/adv | 34 | 0,00 | 3 | 0,00 | ||||
| 2026-02-09 | 13F | Atlantic Trust, LLC | 0 | -100,00 | 0 | |||||
| 2026-01-21 | 13F | Crews Bank & Trust | 1.092 | 0,00 | 88 | -1,12 | ||||
| 2026-02-17 | 13F | Susquehanna International Group, Llp | Put | 8.900 | -7,29 | 719 | -8,52 | |||
| 2026-02-13 | 13F | Police & Firemen's Retirement System of New Jersey | 10.636 | -0,37 | 859 | -1,83 | ||||
| 2026-02-17 | 13F | Susquehanna International Group, Llp | Call | 5.500 | -22,54 | 444 | -23,58 | |||
| 2026-02-17 | 13F | Susquehanna International Group, Llp | 12.175 | 984 | ||||||
| 2026-02-10 | 13F | Connor, Clark & Lunn Investment Management Ltd. | 31.911 | -2,74 | 2.579 | -4,13 | ||||
| 2026-02-12 | 13F | Jane Street Group, Llc | Call | 0 | -100,00 | 0 | -100,00 | |||
| 2026-04-22 | 13F | Bravera Wealth | 5.399 | 12,50 | 474 | 22,22 | ||||
| 2026-02-13 | 13F | Aigen Investment Management, Lp | 0 | -100,00 | 0 | |||||
| 2026-02-17 | 13F | Voleon Capital Management Lp | 15.344 | 23,61 | 1.240 | 21,83 | ||||
| 2026-02-13 | 13F | Caitong International Asset Management Co., Ltd | 239 | 19 | ||||||
| 2026-01-27 | 13F | WealthCollab, LLC | 119 | 46,91 | 10 | 50,00 | ||||
| 2026-02-13 | 13F | Inspire Advisors, LLC | 0 | -100,00 | 0 | |||||
| 2026-02-05 | 13F | Amalgamated Bank | 12.070 | 0,96 | 1 | |||||
| 2026-01-26 | 13F | Hendershot Investments Inc. | 5.000 | 0,00 | 404 | -1,22 | ||||
| 2026-01-16 | 13F | Trust Co Of Vermont | 904 | -62,40 | 73 | -62,94 | ||||
| 2026-02-18 | 13F | First Citizens Bank & Trust Co | 3.769 | -0,89 | 305 | -2,25 | ||||
| 2026-02-13 | 13F | Prudential Financial Inc | 92.524 | -7,59 | 7.477 | -8,91 | ||||
| 2026-04-13 | 13F | IFP Advisors, Inc | 190 | -2,06 | 17 | 6,67 | ||||
| 2026-02-02 | 13F | Fifth Third Bancorp | 936 | 5,64 | 76 | 4,17 | ||||
| 2026-04-22 | 13F | JNBA Financial Advisors | 1.715 | 0,00 | 151 | 8,70 | ||||
| 2025-11-21 | 13F | Nebula Research & Development LLC | 0 | -100,00 | 0 | |||||
| 2026-02-18 | 13F | Mackenzie Financial Corp | 0 | -100,00 | 0 | |||||
| 2026-02-10 | 13F | Cherry Tree Wealth Management, LLC | 454 | 0,00 | 37 | -2,70 | ||||
| 2026-01-27 | 13F | Zurcher Kantonalbank (Zurich Cantonalbank) | 12.181 | 0,00 | 984 | -1,40 | ||||
| 2026-02-09 | 13F | Geode Capital Management, Llc | 1.019.262 | 0,41 | 82.385 | -1,01 | ||||
| 2025-11-14 | 13F | Point72 Asset Management, L.P. | 0 | -100,00 | 0 | |||||
| 2026-02-17 | 13F | Price T Rowe Associates Inc /md/ | 44.543 | 4,20 | 4 | 0,00 | ||||
| 2026-04-02 | 13F | MJT & Associates Financial Advisory Group, Inc. | 420 | 0,00 | 37 | 9,09 | ||||
| 2025-11-14 | 13F | Mount Yale Investment Advisors, LLC | 0 | -100,00 | 0 | -100,00 | ||||
| 2026-02-10 | 13F | Bank of New York Mellon Corp | 358.577 | -3,42 | 28.977 | -4,79 | ||||
| 2026-04-21 | 13F | Old National Bancorp /in/ | 3.285 | 0,00 | 288 | 8,68 | ||||
| 2026-01-16 | 13F | Empirical Financial Services, LLC d.b.a. Empirical Wealth Management | 4.055 | 328 | ||||||
| 2026-01-28 | 13F | Geneos Wealth Management Inc. | 742 | 0,00 | 60 | -1,67 | ||||
| 2026-02-13 | 13F | Morgan Stanley | 562.289 | 5,76 | 45.439 | 4,26 | ||||
| 2026-02-12 | 13F | Wealthspire Advisors, LLC | 0 | -100,00 | 0 | |||||
| 2026-02-11 | 13F | Hughes Financial Services, LLC | 1 | 0 | ||||||
| 2025-11-10 | 13F | Optiver Holding B.V. | 0 | -100,00 | 0 | |||||
| 2026-01-27 | 13F | Belpointe Asset Management LLC | 9.748 | 788 | ||||||
| 2026-02-05 | 13F | John G Ullman & Associates Inc | 24.950 | 20,82 | 2.016 | 19,15 | ||||
| 2026-02-13 | 13F | First Trust Advisors Lp | 810.638 | -44,65 | 65.508 | -45,44 | ||||
| 2026-02-20 | 13F | Kovitz Investment Group Partners, LLC | 0 | -100,00 | 0 | |||||
| 2026-01-26 | 13F | Greenwood Capital Associates Llc | 4.120 | 333 | ||||||
| 2026-02-17 | 13F | Ancora Advisors, LLC | 38 | 0,00 | 3 | 0,00 | ||||
| 2026-02-02 | 13F | Hussman Strategic Advisors, Inc. | 1.000 | 0,00 | 81 | -1,23 | ||||
| 2026-02-09 | 13F | Legal & General Group Plc | 103.327 | -6,37 | 8.350 | -7,69 | ||||
| 2025-11-13 | 13F | Clear Street Markets Llc | 0 | -100,00 | 0 | |||||
| 2026-04-14 | 13F | Bay Harbor Wealth Management, LLC | 6 | 100,00 | 1 | |||||
| 2026-04-24 | 13F | Root Financial Partners, LLC | 79 | 16,18 | 7 | 20,00 | ||||
| 2026-02-17 | 13F | MIRAE ASSET GLOBAL ETFS HOLDINGS Ltd. | 17.897 | -0,10 | 1.446 | -1,50 | ||||
| 2026-04-23 | 13F | North Star Investment Management Corp. | 14.236 | 0,00 | 1.249 | 8,61 | ||||
| 2025-11-12 | 13F | Bellwether Advisors, LLC | 0 | -100,00 | 0 | |||||
| 2026-02-17 | 13F | Engineers Gate Manager LP | 6.716 | 543 | ||||||
| 2026-02-17 | 13F | Royal Bank Of Canada | 136.237 | 4,43 | 11.010 | 2,97 | ||||
| 2026-02-12 | 13F | Ensign Peak Advisors, Inc | 2.060 | -59,29 | 166 | -59,90 | ||||
| 2026-01-28 | 13F | Universal- Beteiligungs- und Servicegesellschaft mbH | 56.235 | 786,43 | 4.550 | 774,81 | ||||
| 2026-02-11 | 13F | O'shaughnessy Asset Management, Llc | 10.435 | 14,23 | 843 | 12,70 | ||||
| 2026-02-12 | 13F | denkapparat Operations GmbH | 2.586 | 209 | ||||||
| 2026-02-17 | 13F | Mercer Global Advisors Inc /adv | 3.521 | 2,83 | 285 | 1,43 | ||||
| 2026-02-06 | 13F | Lsv Asset Management | 536.941 | 217,58 | 43 | 230,77 | ||||
| 2026-02-13 | 13F | Ubs Asset Management Americas Inc | 93.303 | 128,35 | 7.540 | 125,11 | ||||
| 2026-02-13 | 13F | Virtus ETF Advisers LLC | 6.854 | 0,00 | 554 | -1,43 | ||||
| 2026-02-02 | 13F | Principal Financial Group Inc | 199.623 | -1,24 | 16.132 | -2,64 | ||||
| 2026-02-12 | 13F | EntryPoint Capital, LLC | 0 | -100,00 | 0 | |||||
| 2026-02-18 | 13F | State of Tennessee, Treasury Department | 9.490 | -20,42 | 846 | -13,41 | ||||
| 2026-01-28 | 13F | N.E.W. Advisory Services LLC | 200 | 0,00 | 16 | 0,00 | ||||
| 2026-02-13 | 13F | Umb Bank N A/mo | 644 | 302,50 | 52 | 300,00 | ||||
| 2026-02-13 | 13F | State Street Corp | 1.561.440 | -0,25 | 126.180 | -1,66 | ||||
| 2026-04-17 | 13F | Vermillion Wealth Management, Inc. | 303 | 1,00 | 27 | 8,33 | ||||
| 2026-02-10 | 13F | State of Wyoming | 1.674 | 104,15 | 135 | 101,49 | ||||
| 2026-02-13 | 13F | C M Bidwell & Associates Ltd | 740 | 0,00 | 60 | -1,67 | ||||
| 2026-02-10 | 13F | MUFG Securities EMEA plc | 44.000 | 3.556 | ||||||
| 2026-02-05 | 13F | Gabelli Funds Llc | 469.100 | 0,00 | 37.908 | -1,42 | ||||
| 2026-02-12 | 13F | Advisors Asset Management, Inc. | 17.762 | 11,73 | 1.435 | 10,13 | ||||
| 2026-02-10 | 13F | Mutual Of America Capital Management Llc | 4.790 | 2,05 | 387 | 0,78 | ||||
| 2026-02-10 | 13F | Intech Investment Management Llc | 18.064 | 0,00 | 1.460 | -1,42 | ||||
| 2026-02-17 | 13F | Infrastructure Capital Advisors, Llc | 5.884 | 0,00 | 475 | 4,63 | ||||
| 2026-02-18 | 13F | Caitlin John, LLC | 0 | -100,00 | 0 | |||||
| 2026-01-20 | 13F | Independence Bank of Kentucky | 200 | 0,00 | 16 | 0,00 | ||||
| 2026-02-17 | 13F | Signature Equity Partners, LLC | 4 | 0 | ||||||
| 2026-04-16 | 13F | Evolve Private Wealth, Llc | 4.772 | 3,81 | 419 | 12,67 | ||||
| 2026-02-13 | 13F | Barclays Plc | 65.900 | 4,20 | 5.325 | 2,74 | ||||
| 2026-02-13 | 13F | Mml Investors Services, Llc | 8.331 | 7,05 | 673 | 5,65 | ||||
| 2026-01-30 | 13F | Us Bancorp \de\ | 36.733 | 12,69 | 2.968 | 11,12 | ||||
| 2026-02-04 | 13F | Oregon Public Employees Retirement Fund | 9.592 | 1,79 | 775 | 0,39 | ||||
| 2026-04-23 | 13F | Farmers & Merchants Investments Inc | 28 | 0,00 | 2 | 0,00 | ||||
| 2026-01-30 | 13F | New York State Teachers Retirement System | 13.986 | -2,86 | 1 | 0,00 | ||||
| 2026-04-17 | 13F | Atlas Brown,Inc. | 3.491 | 0,00 | 306 | 8,51 | ||||
| 2026-02-13 | 13F | Great West Life Assurance Co /can/ | 36.314 | 5,46 | 3 | 0,00 | ||||
| 2026-02-13 | 13F | SRS Capital Advisors, Inc. | 379 | 7,37 | 31 | 7,14 | ||||
| 2026-02-11 | 13F | Harvest Fund Management Co., Ltd | 90 | 0,00 | 0 | |||||
| 2026-01-30 | 13F | Mitsubishi UFJ Trust & Banking Corp | 3.531 | 22,60 | 285 | 20,76 | ||||
| 2026-01-27 | 13F | Compass Financial Group, INC/SD | 2.682 | 0,60 | 217 | -0,92 | ||||
| 2026-02-03 | 13F | SBI Securities Co., Ltd. | 10 | 0,00 | 1 | |||||
| 2026-02-17 | 13F | Jones Financial Companies Lllp | 6.637 | 15,65 | 536 | 13,56 | ||||
| 2026-02-17 | 13F | XTX Topco Ltd | 32.434 | 538,34 | 2.621 | 529,81 | ||||
| 2026-02-17 | 13F | Fmr Llc | 7.835 | 23,29 | 633 | 21,73 | ||||
| 2026-02-09 | 13F | Hartland & Co., LLC | 0 | -100,00 | 0 | |||||
| 2026-02-17 | 13F | Balyasny Asset Management Llc | 15.313 | -64,10 | 1.237 | -64,62 | ||||
| 2026-02-12 | 13F | Principal Securities, Inc. | 0 | -100,00 | 0 | -100,00 | ||||
| 2026-01-08 | 13F | True Wealth Design, LLC | 0 | -100,00 | 0 | |||||
| 2026-04-23 | 13F | CBOE Vest Financial, LLC | 41.054 | -24,64 | 3.603 | -18,15 | ||||
| 2026-02-13 | 13F | MAI Capital Management | 0 | -100,00 | 0 | |||||
| 2026-04-03 | 13F | Global Wealth Strategies & Associates | 55 | 0,00 | 5 | 0,00 | ||||
| 2026-02-13 | 13F | Squarepoint Ops LLC | 83.926 | 399,74 | 6.782 | 392,88 | ||||
| 2026-02-12 | 13F | State Board Of Administration Of Florida Retirement System | 13.500 | 17,89 | 1.091 | 16,20 | ||||
| 2026-02-17 | 13F | Maryland State Retirement & Pension System | 6.110 | 1,43 | 494 | 0,00 | ||||
| 2026-02-03 | 13F | Costello Asset Management, INC | 718 | -0,69 | 58 | -3,39 | ||||
| 2026-02-17 | 13F | Adage Capital Partners Gp, L.l.c. | 344.149 | 108,58 | 27.811 | 105,62 | ||||
| 2026-04-16 | 13F | Lifelong Wealth Advisors, Inc. | 3.164 | 0,00 | 278 | 8,63 | ||||
| 2026-02-11 | 13F | Manchester Capital Management LLC | 0 | -100,00 | 0 | |||||
| 2026-04-13 | 13F | Bank & Trust Co | 119.236 | -2,28 | 10.465 | 6,14 | ||||
| 2026-04-20 | 13F | Jfs Wealth Advisors, Llc | 25 | -30,56 | 2 | 0,00 | ||||
| 2026-02-17 | 13F | Capstone Investment Advisors, Llc | 0 | -100,00 | 0 | -100,00 | ||||
| 2026-04-23 | 13F | Johnson Wealth Management, LLC | 6.727 | 0,00 | 590 | 8,66 | ||||
| 2025-11-14 | 13F | Centiva Capital, LP | 0 | -100,00 | 0 | |||||
| 2026-02-11 | 13F | Ameritas Investment Partners, Inc. | 3.222 | 260 | ||||||
| 2026-04-10 | 13F | Armstrong Advisory Group, Inc | 1.660 | 0,00 | 146 | 8,21 | ||||
| 2026-01-15 | 13F | Nisa Investment Advisors, Llc | 1.044 | 4,71 | 84 | 3,70 | ||||
| 2026-04-22 | 13F | Ifrah Financial Services, Inc. | 3.474 | -2,96 | 305 | 5,19 | ||||
| 2026-02-11 | 13F | Jpmorgan Chase & Co | 418.928 | -30,81 | 33.854 | -31,79 | ||||
| 2026-02-13 | 13F | Alerus Financial Na | 9.028 | 7,50 | 730 | 5,96 | ||||
| 2026-02-05 | 13F | High Note Wealth, LLC | 677 | -43,01 | 55 | -44,33 | ||||
| 2026-02-13 | 13F | Stifel Financial Corp | 3.327 | -1,42 | 269 | -2,90 | ||||
| 2026-02-13 | 13F | Mariner, LLC | 25.546 | 7,12 | 2.064 | 5,58 | ||||
| 2026-02-17 | 13F | Northern Trust Corp | 414.778 | -6,34 | 33.518 | -7,67 | ||||
| 2026-02-17 | 13F | Captrust Financial Advisors | 3.402 | 1,07 | 275 | -0,36 | ||||
| 2026-02-17 | 13F | Schonfeld Strategic Advisors LLC | 0 | -100,00 | 0 | |||||
| 2026-02-12 | 13F | Elo Mutual Pension Insurance Co | 23.106 | 1.867 | ||||||
| 2026-01-21 | 13F | Flagship Harbor Advisors, Llc | 1.317 | 106 | ||||||
| 2026-01-26 | 13F | KBC Group NV | 1.227 | 0,00 | 0 | |||||
| 2026-02-09 | 13F | Coldstream Capital Management Inc | 5.856 | -5,09 | 473 | -6,34 | ||||
| 2026-01-23 | 13F | Assetmark, Inc | 40 | -35,48 | 3 | -40,00 | ||||
| 2026-04-13 | 13F | Chesley Taft & Associates LLC | 3.680 | 0,00 | 323 | 8,42 | ||||
| 2026-02-12 | 13F | Hrt Financial Lp | 111.894 | 79,95 | 9 | 80,00 | ||||
| 2026-02-03 | 13F | Crossmark Global Holdings, Inc. | 2.765 | 0,00 | 223 | -1,33 | ||||
| 2026-02-17 | 13F | Two Sigma Advisers, Lp | 161.100 | 334,23 | 13.018 | 328,08 | ||||
| 2026-04-24 | 13F | James Investment Research Inc | 10.631 | 0,12 | 933 | 8,74 | ||||
| 2026-02-17 | 13F | Leonteq Securities AG | 0 | -100,00 | 0 | |||||
| 2026-02-13 | 13F | Wells Fargo & Company/mn | 77.728 | 27,63 | 6.281 | 25,82 | ||||
| 2026-02-17 | 13F | Aquatic Capital Management LLC | 0 | -100,00 | 0 | |||||
| 2026-02-13 | 13F | Entropy Technologies, LP | 6.567 | -28,28 | 531 | -29,33 | ||||
| 2026-02-05 | 13F | Cambridge Investment Research Advisors, Inc. | 7.942 | -2,46 | 1 | |||||
| 2026-02-11 | 13F | Franklin Resources Inc | 36.993 | 17,07 | 2.989 | 15,41 | ||||
| 2025-11-21 | 13F/A | CIBC Bancorp USA Inc. | 4.111 | 337 | ||||||
| 2026-01-30 | 13F | Archer Investment Corp | 12 | 0,00 | 1 | |||||
| 2026-02-17 | 13F | Prelude Capital Management, Llc | 2.496 | 202 | ||||||
| 2026-01-28 | 13F | Salomon & Ludwin, LLC | 256 | 41,44 | 21 | 42,86 | ||||
| 2026-04-08 | 13F | West Financial Advisors, LLC | 334 | 0,00 | 29 | 11,54 | ||||
| 2026-01-28 | 13F | Arizona State Retirement System | 10.530 | -5,43 | 851 | -6,80 | ||||
| 2026-04-21 | 13F | Gilpin Wealth Management, Llc | 4 | 33,33 | 0 | |||||
| 2026-02-17 | 13F | Janus Henderson Group Plc | 15.542 | 0,00 | 1.256 | -1,41 | ||||
| 2026-02-05 | 13F | Thrivent Financial For Lutherans | 41.187 | 26,64 | 3 | 50,00 | ||||
| 2026-02-13 | 13F | Quarry LP | 0 | -100,00 | 0 | |||||
| 2026-02-05 | 13F | HFM Investment Advisors, LLC | 2 | 0,00 | 0 | |||||
| 2026-01-29 | 13F | Dunhill Financial, LLC | 1 | 0 | ||||||
| 2026-02-17 | 13F | Jain Global LLC | 6.210 | 502 | ||||||
| 2026-02-10 | 13F | Measured Wealth Private Client Group, LLC | 19 | 0,00 | 2 | 0,00 | ||||
| 2026-01-29 | 13F | Concord Wealth Partners | 39 | -2,50 | 3 | 0,00 | ||||
| 2026-02-17 | 13F | Dark Forest Capital Management Lp | 25.090 | 2.028 | ||||||
| 2026-02-17 | 13F | Kemnay Advisory Services Inc. | 67 | 5 | ||||||
| 2026-02-12 | 13F | Chilton Capital Management Llc | 426 | 0,00 | 34 | 0,00 | ||||
| 2026-02-06 | 13F | HighTower Advisors, LLC | 9.841 | -3,59 | 795 | -4,90 | ||||
| 2026-02-11 | 13F | Financiere des Professionnels - Fonds d,investissement inc. | 2.683 | 0,00 | 217 | -1,37 | ||||
| 2026-02-13 | 13F | Motiv8 Investments LLC | 422 | 0 | ||||||
| 2025-11-06 | 13F | Ameritas Advisory Services, LLC | 0 | -100,00 | 0 | |||||
| 2026-02-13 | 13F | Colony Group, LLC | 10.186 | 45,10 | 823 | 43,13 | ||||
| 2026-04-17 | 13F | Bell Investment Advisors, Inc | 15 | 0,00 | 1 | 0,00 | ||||
| 2026-01-12 | 13F | Rialto Wealth Management, LLC | 2 | 100,00 | 0 | |||||
| 2026-01-22 | 13F/A | Cresset Asset Management, LLC | 0 | -100,00 | 0 | |||||
| 2026-02-09 | 13F | Royce & Associates Lp | 31.728 | -0,66 | 2.564 | -2,10 | ||||
| 2026-02-05 | 13F | HighMark Wealth Management LLC | 336 | 0,90 | 27 | 0,00 | ||||
| 2026-02-11 | 13F | Fox Run Management, L.l.c. | 0 | -100,00 | 0 | |||||
| 2026-01-30 | 13F | NJ State Employees Deferred Compensation Plan | 0 | -100,00 | 0 | |||||
| 2026-02-12 | 13F | Cibc World Markets Corp | 2.551 | -46,31 | 206 | -43,72 | ||||
| 2026-02-17 | 13F | Citadel Advisors Llc | 115.209 | -3,01 | 9.310 | -4,38 | ||||
| 2026-02-12 | 13F | Cloud Capital Management, LLC | 0 | -100,00 | 0 | |||||
| 2025-11-13 | 13F | Farringdon Capital, Ltd. | 0 | -100,00 | 0 | |||||
| 2026-02-06 | 13F | Pnc Financial Services Group, Inc. | 5.393 | 6,02 | 436 | 4,57 | ||||
| 2026-02-12 | 13F | CIBC Private Wealth Group, LLC | 1.310 | 0,77 | 106 | -0,94 | ||||
| 2026-02-17 | 13F | NorthRock Partners, LLC | 8.237 | -0,42 | 666 | -1,92 | ||||
| 2026-02-12 | 13F | Colonial Trust Co / SC | 34 | 3 | ||||||
| 2026-02-03 | 13F | Buck Wealth Strategies, LLC | 72.905 | 7,55 | 5.891 | 6,03 | ||||
| 2026-02-14 | 13F | Rockefeller Capital Management L.P. | 588 | -6,52 | 48 | -7,84 | ||||
| 2026-02-05 | 13F | Accredited Investors Inc. | 4.379 | 0,64 | 354 | -0,84 | ||||
| 2026-02-13 | 13F | Manufacturers Life Insurance Company, The | 0 | -100,00 | 0 | |||||
| 2026-02-10 | 13F | Goldman Sachs Group Inc | 329.157 | 1,99 | 26.599 | 0,54 | ||||
| 2026-02-10 | 13F | Savant Capital, LLC | 2.550 | -34,92 | 206 | -35,83 | ||||
| 2026-02-11 | 13F | Deutsche Bank Ag\ | 35.017 | 3,70 | 2.830 | 2,20 | ||||
| 2026-04-14 | 13F | SNS Financial Group, LLC | 7.459 | 0,00 | 655 | 8,64 | ||||
| 2026-02-10 | 13F | Gw Henssler & Associates Ltd | 2.883 | 2,09 | 233 | 0,43 | ||||
| 2026-02-17 | 13F | Man Group plc | 47.320 | -22,82 | 3.824 | -23,92 | ||||
| 2026-02-11 | 13F | Group One Trading, L.p. | Put | 100 | 0,00 | 8 | 0,00 | |||
| 2026-02-12 | 13F | Great Valley Advisor Group, Inc. | 10.201 | 0,01 | 825 | -1,44 | ||||
| 2026-01-26 | 13F | Cwm, Llc | 8.443 | -13,99 | 1 | |||||
| 2026-02-12 | 13F | Skopos Labs, Inc. | 5.191 | 429 | ||||||
| 2026-04-10 | 13F | Abound Wealth Management | 1.151 | 0,00 | 101 | 8,70 | ||||
| 2026-02-12 | 13F | BlackRock, Inc. | 6.391.447 | 0,47 | 516.493 | -0,95 | ||||
| 2026-04-15 | 13F | Fortitude Family Office, LLC | 26 | 271,43 | 2 | |||||
| 2026-02-13 | 13F | Citigroup Inc | 38.463 | -5,27 | 3.108 | -6,61 | ||||
| 2026-02-09 | 13F | Harbour Investments, Inc. | 4.302 | 0,21 | 348 | -1,14 | ||||
| 2026-02-12 | 13F | Brown Brothers Harriman & Co | 62 | 0,00 | 5 | 0,00 | ||||
| 2026-04-14 | 13F | Focus Financial Network, Inc. | 16.945 | 7,84 | 1.487 | 17,18 | ||||
| 2026-02-18 | 13F | Vident Advisory, LLC | 5.218 | -7,30 | 422 | -8,68 | ||||
| 2026-02-13 | 13F | Dynamic Technology Lab Private Ltd | 4.410 | -67,58 | 356 | -68,07 | ||||
| 2026-02-12 | 13F | Steward Partners Investment Advisory, Llc | 3.791 | 0,00 | 306 | -1,29 | ||||
| 2026-01-30 | 13F | State of New Jersey Common Pension Fund D | 26.319 | 2,81 | 2.127 | 1,33 | ||||
| 2026-02-19 | 13F | Birchwood Financial Partners, Inc. | 500 | 40 | ||||||
| 2026-04-07 | 13F | Signaturefd, Llc | 1.115 | 869,57 | 98 | 977,78 | ||||
| 2025-11-05 | 13F | BI Asset Management Fondsmaeglerselskab A/S | 0 | -100,00 | 0 | |||||
| 2026-04-20 | 13F | Ronald Blue Trust, Inc. | 24 | -22,58 | 2 | 0,00 | ||||
| 2026-02-13 | 13F | Parkside Financial Bank & Trust | 33 | 0,00 | 3 | 0,00 | ||||
| 2026-01-29 | 13F | D.a. Davidson & Co. | 5.869 | 0,00 | 474 | -1,46 | ||||
| 2026-02-03 | 13F | Broadwater Capital Management Llc | 95 | 0,00 | 8 | 0,00 | ||||
| 2026-02-10 | 13F | Bnp Paribas Arbitrage, Sa | 76.766 | -12,66 | 6.203 | -13,90 | ||||
| 2026-02-13 | 13F | American Century Companies Inc | 39.917 | 147,84 | 3.226 | 144,32 | ||||
| 2026-04-07 | 13F | Farther Finance Advisors, LLC | 1.123 | -10,45 | 99 | -1,98 | ||||
| 2026-02-17 | 13F | Caisse De Depot Et Placement Du Quebec | 554.733 | -0,20 | 44.828 | -1,62 | ||||
| 2026-02-13 | 13F | Marshall Wace, Llp | 173.429 | 14.015 | ||||||
| 2026-02-09 | 13F | Hantz Financial Services, Inc. | 621 | 195,71 | 0 | |||||
| 2026-02-17 | 13F | Bank Of America Corp /de/ | 325.120 | -13,81 | 26.273 | -15,04 | ||||
| 2025-11-14 | 13F | Weiss Asset Management LP | 0 | -100,00 | 0 | -100,00 | ||||
| 2026-02-09 | 13F | Jefferies Financial Group Inc. | 16.500 | 1.333 | ||||||
| 2026-04-23 | 13F | CWM Advisors, LLC | 1 | 0,00 | 0 | |||||
| 2026-01-29 | 13F | Comerica Bank | 17.017 | -12,44 | 1.375 | -13,68 | ||||
| 2026-02-09 | 13F | Jackson Creek Investment Advisors LLC | 4.989 | -1,42 | 0 | |||||
| 2026-02-17 | 13F | Trexquant Investment LP | 23.894 | -57,47 | 1.931 | -58,09 | ||||
| 2026-02-12 | 13F | Ankerstar Wealth, LLC | 4 | 0 | ||||||
| 2026-02-11 | 13F | LPL Financial LLC | 64.048 | -3,18 | 5.176 | -4,56 | ||||
| 2026-02-20 | 13F | Sunbelt Securities, Inc. | 0 | -100,00 | 0 | |||||
| 2026-02-13 | 13F | Smartleaf Asset Management LLC | 138 | 38,00 | 11 | 37,50 | ||||
| 2026-02-17 | 13F | Capital Fund Management S.a. | 15.373 | -11,11 | 1.242 | -12,35 | ||||
| 2026-02-17 | 13F | Russell Investments Group, Ltd. | 3.595 | -78,67 | 291 | -79,00 | ||||
| 2026-04-20 | 13F | State of Alaska, Department of Revenue | 20.684 | -3,06 | 2 | 0,00 | ||||
| 2026-02-17 | 13F | Two Sigma Investments, Lp | 271.653 | 97,39 | 21.952 | 94,59 | ||||
| 2026-04-14 | 13F | Opal Wealth Advisors, LLC | 230 | 20 | ||||||
| 2026-04-09 | 13F | Wealth Alliance Advisory Group, LLC | 2.779 | 0,00 | 244 | 8,48 | ||||
| 2026-02-17 | 13F | Quantinno Capital Management LP | 10.470 | 32,90 | 846 | 31,16 | ||||
| 2026-02-12 | 13F | Dimensional Fund Advisors Lp | 850.729 | -0,96 | 68.751 | -2,36 | ||||
| 2026-02-17 | 13F | Alliancebernstein L.p. | 45.887 | 5,13 | 3.708 | 3,66 | ||||
| 2026-04-24 | 13F | Yousif Capital Management, Llc | 11.135 | -1,09 | 977 | -0,61 | ||||
| 2026-02-12 | 13F | Nuveen, LLC | 152.022 | -1,05 | 12.285 | -2,45 | ||||
| 2026-02-05 | 13F | Plante Moran Financial Advisors, LLC | 160 | 0,00 | 13 | -7,69 | ||||
| 2025-11-14 | 13F | Citadel Advisors Llc | Call | 0 | -100,00 | 0 | -100,00 | |||
| 2025-11-14 | 13F | Citadel Advisors Llc | Put | 0 | -100,00 | 0 | -100,00 | |||
| 2026-04-08 | 13F | DiNuzzo Private Wealth, Inc. | 6 | 0,00 | 1 | |||||
| 2026-01-28 | 13F | Financial Perspectives, Inc | 1.155 | 0,00 | 93 | -1,06 | ||||
| 2026-01-29 | 13F | Vanguard Group Inc | 5.059.480 | -0,72 | 408.857 | -2,12 | ||||
| 2026-02-06 | 13F | Larson Financial Group LLC | 102 | -58,20 | 8 | -60,00 | ||||
| 2026-04-08 | 13F | Wealth Enhancement Advisory Services, Llc | 15.833 | -9,86 | 1.403 | -2,50 | ||||
| 2026-04-22 | 13F | RBA Wealth Management, LLC | 6.042 | -2,14 | 530 | 6,43 | ||||
| 2026-02-17 | 13F | Advisor Group Holdings, Inc. | 34.482 | 8,30 | 2.788 | 4,54 | ||||
| 2026-02-17 | 13F | Raymond James Financial Inc | 42.650 | -0,07 | 3.447 | -1,49 | ||||
| 2026-02-11 | 13F | Los Angeles Capital Management Llc | 12.560 | 0,00 | 974 | -5,34 | ||||
| 2026-02-13 | 13F | Public Employees Retirement Association Of Colorado | 4.608 | 0,00 | 0 | |||||
| 2026-02-17 | 13F | Guggenheim Capital Llc | 3.834 | -18,74 | 310 | -19,95 | ||||
| 2026-02-10 | 13F | Envestnet Asset Management Inc | 3.322 | -38,50 | 268 | -39,37 | ||||
| 2026-02-12 | 13F | Bank Of Montreal /can/ | 8.431 | -1,08 | 681 | -2,44 | ||||
| 2026-01-20 | 13F | Palisades Investment Partners, LLC | 40.891 | 1,74 | 3.304 | 0,30 | ||||
| 2026-02-17 | 13F | Amundi | 5.586 | -22,74 | 451 | -21,29 | ||||
| 2026-02-17 | 13F | Bridgeway Capital Management Inc | 35.600 | -6,56 | 2.877 | -7,91 | ||||
| 2026-04-21 | 13F | OneAscent Financial Services LLC | 25.018 | 1,47 | 2.196 | 8,66 | ||||
| 2026-01-30 | 13F | Opus Capital Group, LLC | 5.266 | 0,00 | 0 | |||||
| 2026-02-13 | 13F | Martingale Asset Management L P | 33.241 | 2,33 | 2.686 | 0,90 | ||||
| 2026-02-13 | 13F | Glen Eagle Advisors, LLC | 11 | 0,00 | 1 |
Other Listings
| DE:OT4 | 74,50 € |