Grundlæggende statistik
| Institutionelle ejere | 104 total, 104 long only, 0 short only, 0 long/short - change of 3,96% MRQ |
| Gennemsnitlig porteføljeallokering | 0.4495 % - change of -1,85% MRQ |
| Institutionelle aktier (lange) | 104.654.235 (ex 13D/G) - change of 10,18MM shares 10,78% MRQ |
| Institutionel værdi (lang) | $ 2.513.303 USD ($1000) |
Institutionelt ejerskab og aktionærer
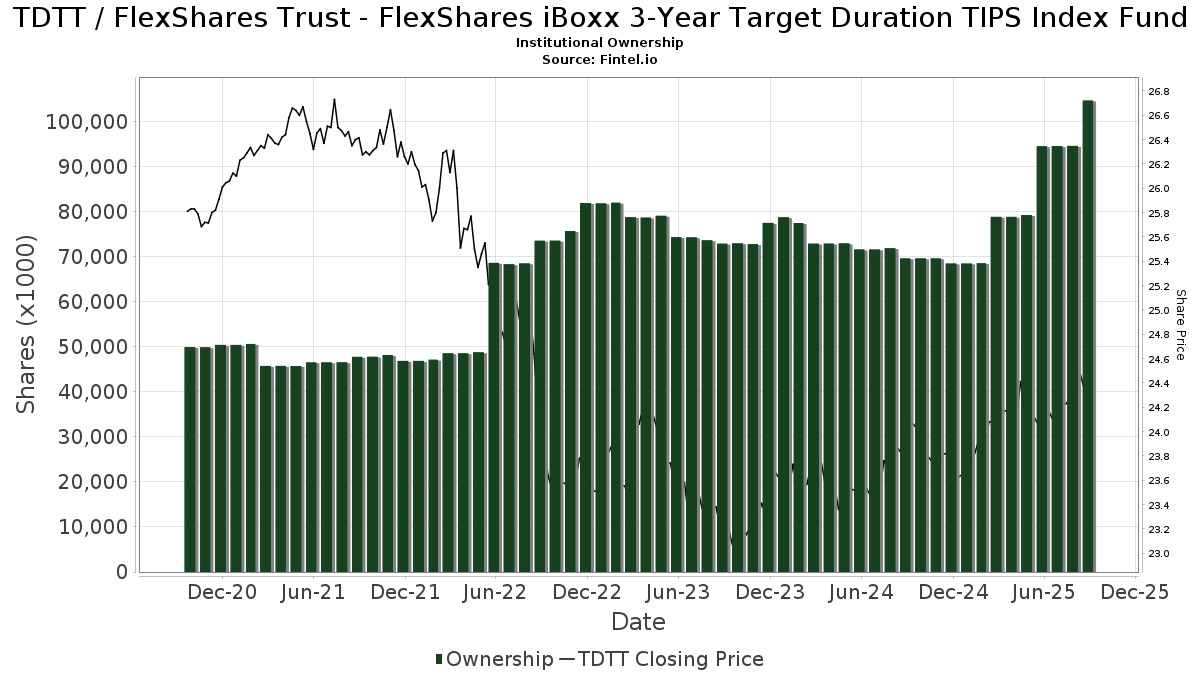
FlexShares Trust - FlexShares iBoxx 3-Year Target Duration TIPS Index Fund (US:TDTT) har 104 institutionelle ejere og aktionærer, der har indsendt 13D/G- eller 13F-formularer til Securities Exchange Commission (SEC). Disse institutioner har i alt 104,654,235 aktier. Største aktionærer omfatter Northern Trust Corp, Bell Investment Advisors, Inc, Envestnet Asset Management Inc, West Paces Advisors Inc., Wells Fargo & Company/mn, Morgan Stanley, Boltwood Capital Management, Mml Investors Services, Llc, Valmark Advisers, Inc., and 5th Street Advisors, LLC .
FlexShares Trust - FlexShares iBoxx 3-Year Target Duration TIPS Index Fund (ARCA:TDTT) institutionel ejerskabsstruktur viser aktuelle positioner i virksomheden efter institutioner og fonde, samt seneste ændringer i positionsstørrelse. Større aktionærer kan omfatte individuelle investorer, investeringsforeninger, hedgefonde eller institutioner. Skema 13D angiver, at investoren besidder (eller besidder) mere end 5 % af virksomheden og har til hensigt (eller har til hensigt at) aktivt at forfølge en ændring i forretningsstrategi. Skema 13G indikerer en passiv investering på over 5%.
The share price as of September 8, 2025 is 24,43 / share. Previously, on September 9, 2024, the share price was 23,88 / share. This represents an increase of 2,32% over that period.
Fondens stemningsscore
Fund Sentiment Score (fka Ownership Accumulation Score) finder de aktier, der bliver mest købt af fonde. Det er resultatet af en sofistikeret, multi-faktor kvantitativ model, der identificerer virksomheder med de højeste niveauer af institutionel akkumulering. Scoringsmodellen bruger en kombination af den samlede stigning i oplyste ejere, ændringerne i porteføljeallokeringer i disse ejere og andre målinger. Tallet går fra 0 til 100, hvor højere tal indikerer et højere niveau af akkumulering for sine jævnaldrende, og 50 er gennemsnittet.
Opdateringsfrekvens: Dagligt
Se Ownership Explorer, som giver en liste over højest rangerende virksomheder.
Institutionel Put/Call-forhold
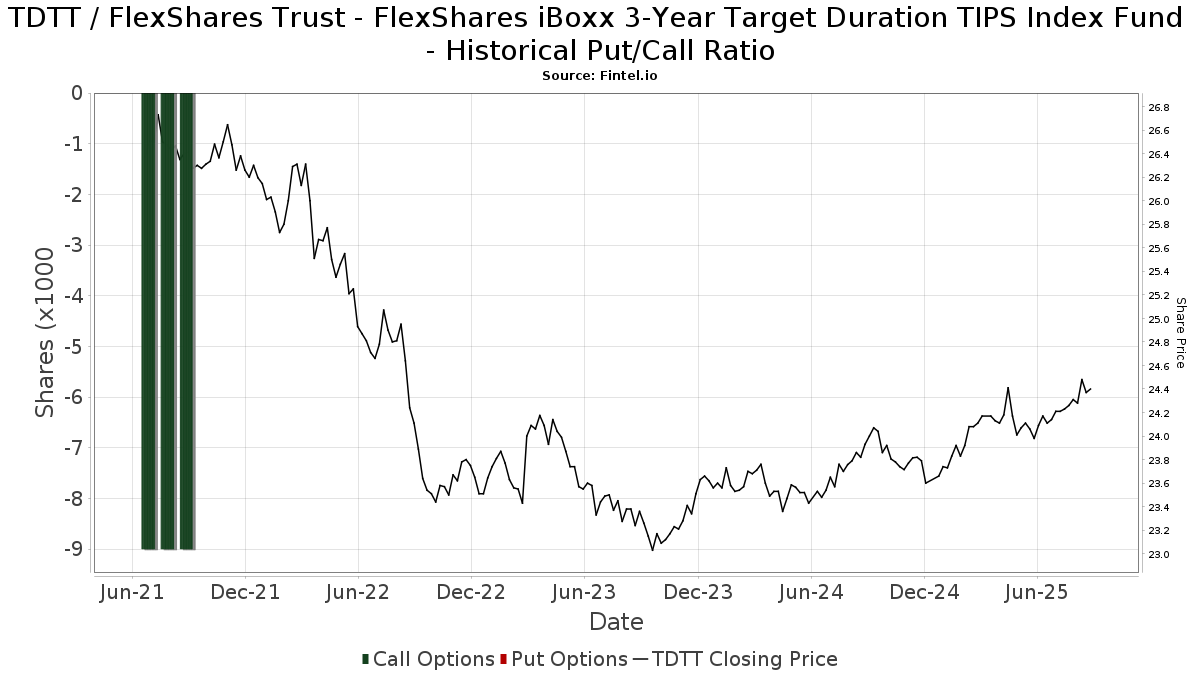
Ud over at indberette standardaktie- og gældsudstedelser skal institutter med mere end 100 mill. aktiver under forvaltning også oplyse deres put- og call-optionsbeholdninger. Da salgsoptioner generelt indikerer negativ stemning, og købsoptioner indikerer positiv stemning, kan vi få en fornemmelse af den overordnede institutionelle stemning ved at plotte forholdet mellem put og kald. Diagrammet til højre viser det historiske put/call-forhold for dette instrument.
Brug af Put/Call Ratio som en indikator for investorernes stemning overvinder en af de vigtigste mangler ved at bruge totalt institutionelt ejerskab, som er, at en betydelig mængde af aktiver under forvaltning investeres passivt for at spore indekser. Passivt forvaltede fonde køber typisk ikke optioner, så indikatoren for put/call-forholdet følger mere nøje følelsen af aktivt forvaltede fonde.
13F og NPORT arkivering
Detaljer om 13F-arkivering er gratis. Detaljer om NP-ansøgninger kræver et premium-medlemskab. Grønne rækker angiver nye positioner. Røde rækker angiver lukkede positioner. Klik på linket ikon for at se den fulde transaktionshistorik.
Opgrader
for at låse premium-data op og eksportere til Excel ![]() .
.
| Fil dato | Kilde | Investor | Type | Gennemsnitlig pris (Øst) |
Aktier | Δ Aktier (%) |
Rapporteret Værdi ($1000) |
Δ Værdi (%) |
Port Alloc (%) |
|
|---|---|---|---|---|---|---|---|---|---|---|
| 2025-07-17 | 13F | Sound Income Strategies, LLC | 16 | 0,00 | 0 | |||||
| 2025-07-31 | 13F | Hanlon Investment Management, Inc. | 62.673 | -8,11 | 1.519 | -8,60 | ||||
| 2025-07-29 | 13F | Empirical Asset Management, LLC | 31.326 | 2,25 | 759 | 1,74 | ||||
| 2025-08-13 | 13F | F/M Investments LLC | 45.541 | 44,45 | 1.104 | 43,62 | ||||
| 2025-07-30 | 13F | Granite Harbor Advisors, Inc. | 31.808 | -8,94 | 771 | -9,40 | ||||
| 2025-05-09 | 13F | Blair William & Co/il | 0 | -100,00 | 0 | -100,00 | ||||
| 2025-05-15 | 13F | Two Sigma Securities, Llc | 0 | -100,00 | 0 | -100,00 | ||||
| 2025-07-25 | 13F | Concurrent Investment Advisors, LLC | 9.539 | 231 | ||||||
| 2025-04-22 | 13F/A | NorthRock Partners, LLC | 0 | -100,00 | 0 | -100,00 | ||||
| 2025-08-15 | 13F | Tower Research Capital LLC (TRC) | 102 | 325,00 | 2 | |||||
| 2025-08-13 | 13F | Jones Financial Companies Lllp | 1.578 | -40,61 | 38 | -40,62 | ||||
| 2025-08-15 | 13F | Fft Wealth Management Llc | 25.400 | 8,84 | 616 | 8,45 | ||||
| 2025-08-13 | 13F | Northwestern Mutual Wealth Management Co | 2.241 | 33,23 | 54 | 31,71 | ||||
| 2025-07-29 | 13F | Morgan Dempsey Capital Management Llc | 4.926 | 119 | ||||||
| 2025-08-12 | 13F | CIBC Private Wealth Group, LLC | 5.251 | -8,30 | 127 | -7,97 | ||||
| 2025-04-08 | 13F | Parallel Advisors, LLC | 0 | -100,00 | 0 | |||||
| 2025-07-01 | 13F | Park National Corp /oh/ | 132.207 | 18,74 | 3.205 | 18,05 | ||||
| 2025-08-01 | 13F | Envestnet Asset Management Inc | 1.474.559 | 1,34 | 35.743 | 0,76 | ||||
| 2025-08-12 | 13F | Jpmorgan Chase & Co | 109 | -94,56 | 3 | -95,83 | ||||
| 2025-07-29 | 13F | Activest Wealth Management | 323 | 1,57 | 8 | 0,00 | ||||
| 2025-08-27 | NP | XRLX - FundX Conservative ETF | 44.042 | 1.068 | ||||||
| 2025-04-17 | 13F | Highline Wealth Partners Llc | 0 | -100,00 | 0 | |||||
| 2025-08-12 | 13F | Steward Partners Investment Advisory, Llc | 3.358 | 0,00 | 81 | 0,00 | ||||
| 2025-08-07 | 13F | Allworth Financial LP | 1.395 | -9,59 | 34 | -10,81 | ||||
| 2025-08-14 | 13F | Trace Wealth Advisors, LLC | 29.726 | 0,00 | 721 | -0,55 | ||||
| 2025-08-15 | 13F | CI Private Wealth, LLC | 0 | -100,00 | 0 | |||||
| 2025-07-09 | 13F | Bank of New Hampshire | 435 | 0,00 | 11 | 0,00 | ||||
| 2025-07-25 | 13F | M.e. Allison & Co., Inc. | 15.815 | -0,98 | 383 | -1,54 | ||||
| 2025-08-14 | 13F | Old Mission Capital Llc | 0 | -100,00 | 0 | |||||
| 2025-08-11 | 13F | Wealthspire Advisors, LLC | 12.634 | 306 | ||||||
| 2025-07-18 | 13F | Trust Co Of Vermont | 197 | 5 | ||||||
| 2025-08-19 | 13F | National Asset Management, Inc. | 0 | -100,00 | 0 | |||||
| 2025-08-05 | 13F | Bank Of Montreal /can/ | 18.765 | 16,95 | 455 | 16,11 | ||||
| 2025-04-15 | 13F | Wealthcare Advisory Partners LLC | 0 | -100,00 | 0 | -100,00 | ||||
| 2025-07-28 | 13F | Harbour Investments, Inc. | 495 | 41,83 | 12 | 37,50 | ||||
| 2025-05-06 | 13F | AE Wealth Management LLC | 0 | -100,00 | 0 | -100,00 | ||||
| 2025-08-14 | 13F | Comerica Bank | 6.428 | 114,27 | 156 | 112,33 | ||||
| 2025-08-13 | 13F | MONECO Advisors, LLC | 32.357 | 3,92 | 784 | 3,29 | ||||
| 2025-04-17 | 13F | Grove Bank & Trust | 0 | -100,00 | 0 | |||||
| 2025-07-08 | 13F | Holcombe Financial, Inc. | 15.397 | 15,99 | 373 | 15,48 | ||||
| 2025-07-22 | 13F | Awm Capital, Llc | 13.042 | 1,54 | 316 | 0,96 | ||||
| 2025-08-11 | 13F | Dorsey & Whitney Trust CO LLC | 26.653 | 23,09 | 646 | 22,58 | ||||
| 2025-07-09 | 13F | Burt Wealth Advisors | 126.836 | -1,37 | 3.075 | -1,95 | ||||
| 2025-08-12 | 13F | PSI Advisors, LLC | 0 | -100,00 | 0 | |||||
| 2025-08-13 | 13F | Northern Trust Corp | 92.737.606 | 11,18 | 2.247.960 | 10,54 | ||||
| 2025-08-11 | 13F | Lake Street Financial Llc | 164.204 | 6,03 | 3.980 | 5,43 | ||||
| 2025-08-11 | 13F | Bell Investment Advisors, Inc | 1.820.715 | 2,23 | 44.134 | 1,65 | ||||
| 2025-08-14 | 13F | Citadel Advisors Llc | 126.706 | -22,82 | 3.071 | -23,26 | ||||
| 2025-08-12 | 13F | Archer Investment Corp | 14.348 | 0,00 | 348 | -0,57 | ||||
| 2025-07-28 | 13F | BRYN MAWR TRUST Co | 2.737 | 714,58 | 66 | 725,00 | ||||
| 2025-08-27 | NP | XFLX - FundX Flexible ETF | 107.500 | 2.606 | ||||||
| 2025-08-14 | 13F | Bnp Paribas Arbitrage, Sa | 0 | -100,00 | 0 | |||||
| 2025-08-08 | 13F | Hartland & Co., LLC | 0 | -100,00 | 0 | |||||
| 2025-08-06 | 13F | Wedbush Securities Inc | 16.822 | 0,00 | 0 | |||||
| 2025-08-12 | 13F | Proequities, Inc. | 0 | 0 | ||||||
| 2025-07-18 | 13F | Lynx Investment Advisory | 33.132 | 0,98 | 803 | 0,50 | ||||
| 2025-08-14 | 13F | Fmr Llc | 337 | 0,00 | 8 | 0,00 | ||||
| 2025-08-04 | 13F | IFG Advisory, LLC | 88.107 | -2,32 | 2.136 | -2,91 | ||||
| 2025-04-30 | 13F | Cornerstone Planning Group LLC | 0 | -100,00 | 0 | |||||
| 2025-07-17 | 13F | Beacon Capital Management, LLC | 1.032 | 25 | ||||||
| 2025-08-14 | 13F | Mml Investors Services, Llc | 532.731 | 3,68 | 13 | 0,00 | ||||
| 2025-08-14 | 13F | Colony Group, LLC | 47.398 | 1.149 | ||||||
| 2025-08-06 | 13F | OneAscent Wealth Management LLC | 0 | -100,00 | 0 | |||||
| 2025-07-25 | 13F | Sequoia Financial Advisors, LLC | 0 | -100,00 | 0 | |||||
| 2025-08-04 | 13F | Creative Financial Designs Inc /adv | 70 | 2 | ||||||
| 2025-08-08 | 13F | Tiemann Investment Advisors, Llc | 46.387 | 13,37 | 1.124 | 12,74 | ||||
| 2025-08-14 | 13F | Royal Bank Of Canada | 3.710 | -96,19 | 90 | -96,21 | ||||
| 2025-07-29 | 13F | Interactive Financial Advisors | 27.423 | -0,05 | 665 | -0,60 | ||||
| 2025-08-04 | 13F | Kovack Advisors, Inc. | 11.000 | -21,43 | 267 | -21,99 | ||||
| 2025-07-30 | 13F | Cullen/frost Bankers, Inc. | 0 | -100,00 | 0 | |||||
| 2025-07-23 | 13F | West Paces Advisors Inc. | 1.157.668 | 0,39 | 28.062 | -0,19 | ||||
| 2025-07-30 | 13F | Gables Capital Management Inc. | 1.502 | 36 | ||||||
| 2025-07-31 | 13F | Cambridge Investment Research Advisors, Inc. | 31.512 | -6,82 | 1 | |||||
| 2025-07-30 | 13F | Klingman & Associates, LLC | 284.315 | -6,58 | 6.892 | -7,12 | ||||
| 2025-04-01 | 13F | Massmutual Trust Co Fsb/adv | 0 | -100,00 | 0 | |||||
| 2025-08-08 | 13F | Cetera Investment Advisers | 35.485 | -1,75 | 860 | -2,27 | ||||
| 2025-08-14 | 13F | UBS Group AG | 22.600 | 112,87 | 548 | 112,02 | ||||
| 2025-05-15 | 13F | Mercer Global Advisors Inc /adv | 0 | -100,00 | 0 | |||||
| 2025-08-14 | 13F | Susquehanna International Group, Llp | 0 | -100,00 | 0 | |||||
| 2025-07-10 | 13F | Focus Financial Network, Inc. | 11.234 | 1,37 | 272 | 0,74 | ||||
| 2025-08-14 | 13F | Gerber Kawasaki Wealth & Investment Management | 8.544 | -6,06 | 207 | -6,33 | ||||
| 2025-09-04 | 13F/A | Advisor Group Holdings, Inc. | 25.439 | 26,53 | 617 | 25,71 | ||||
| 2025-08-13 | 13F | Cerity Partners LLC | 38.907 | -8,20 | 943 | -8,71 | ||||
| 2025-07-16 | 13F | ORG Partners LLC | 0 | -100,00 | 0 | |||||
| 2025-08-13 | 13F | Virtue Capital Management, LLC | 0 | -100,00 | 0 | |||||
| 2025-08-11 | 13F | Principal Securities, Inc. | 1.000 | 0,00 | 24 | 4,35 | ||||
| 2025-08-19 | 13F | Advisory Services Network, LLC | 16.371 | 0,00 | 396 | -0,75 | ||||
| 2025-07-30 | 13F | Eqis Capital Management, Inc. | 27.976 | 5,43 | 678 | 4,95 | ||||
| 2025-08-14 | 13F | Bank Of America Corp /de/ | 99.958 | 13,19 | 2.423 | 12,55 | ||||
| 2025-08-14 | 13F | Raymond James Financial Inc | 99.551 | -6,72 | 2.413 | -7,23 | ||||
| 2025-07-08 | 13F | Boltwood Capital Management | 683.782 | 6,29 | 16.575 | 5,67 | ||||
| 2025-07-24 | 13F | Horizon Bancorp Inc /in/ | 323.599 | -1,95 | 8 | -12,50 | ||||
| 2025-07-16 | 13F | American National Bank | 10.754 | 261 | ||||||
| 2025-08-12 | 13F | Absolute Capital Management, LLC | 15.051 | -4,53 | 365 | -5,21 | ||||
| 2025-04-29 | 13F | Bolthouse Investments, LLC | 0 | -100,00 | 0 | |||||
| 2025-07-28 | 13F | 5th Street Advisors, LLC | 479.594 | -1,66 | 11.625 | -2,23 | ||||
| 2025-08-15 | 13F | Morgan Stanley | 705.507 | -5,38 | 17.102 | -5,92 | ||||
| 2025-08-13 | 13F/A | StoneX Group Inc. | 11.305 | 262 | ||||||
| 2025-08-19 | 13F | Delos Wealth Advisors, LLC | 153.716 | -20,04 | 3.726 | -20,50 | ||||
| 2025-08-13 | 13F | Flow Traders U.s. Llc | 32.877 | 1 | ||||||
| 2025-08-14 | 13F | Stifel Financial Corp | 16.333 | -33,61 | 396 | -34,06 | ||||
| 2025-07-28 | 13F | Mutual Advisors, LLC | 40.540 | 6,36 | 982 | 6,05 | ||||
| 2025-08-14 | 13F | CoreCap Advisors, LLC | 14.655 | 7,48 | 355 | 6,93 | ||||
| 2025-08-12 | 13F | Bokf, Na | 3.949 | -33,97 | 96 | -34,48 | ||||
| 2025-08-12 | 13F | MAI Capital Management | 6.082 | 28,39 | 147 | 27,83 | ||||
| 2025-07-25 | 13F | Cwm, Llc | 851 | 0,00 | 0 | |||||
| 2025-06-24 | NP | BNDC - FlexShares Core Select Bond Fund | 111.785 | -12,95 | 2.729 | -11,00 | ||||
| 2025-08-05 | 13F | Key FInancial Inc | 481 | 0,00 | 12 | 0,00 | ||||
| 2025-07-07 | 13F | Versant Capital Management, Inc | 0 | -100,00 | 0 | |||||
| 2025-08-14 | 13F | Jane Street Group, Llc | 38.792 | -57,96 | 940 | -58,20 | ||||
| 2025-08-12 | 13F | LPL Financial LLC | 177.939 | 0,09 | 4.313 | -0,48 | ||||
| 2025-08-05 | 13F | Cherry Tree Wealth Management, LLC | 17.452 | 0,00 | 423 | -0,47 | ||||
| 2025-07-25 | 13F | Hemington Wealth Management | 896 | 0 | ||||||
| 2025-08-06 | 13F | Commonwealth Equity Services, Llc | 23.930 | -29,33 | 1 | |||||
| 2025-08-08 | 13F | Union Savings Bank | 81 | 0,00 | 2 | 0,00 | ||||
| 2025-08-14 | 13F | Goldman Sachs Group Inc | 9.899 | 0,00 | 240 | -0,83 | ||||
| 2025-08-05 | 13F | Huntington National Bank | 0 | |||||||
| 2025-08-08 | 13F | VeraBank, N.A. | 421.149 | 11,95 | 10.209 | 11,31 | ||||
| 2025-08-13 | 13F | Rsm Us Wealth Management Llc | 15.000 | 0,00 | 364 | -0,55 | ||||
| 2025-08-29 | 13F | Centaurus Financial, Inc. | 5.333 | -11,56 | 0 | |||||
| 2025-08-14 | 13F | Camden Capital, LLC | 12.600 | 0,00 | 305 | -0,65 | ||||
| 2025-05-15 | 13F | EP Wealth Advisors, Inc. | 0 | -100,00 | 0 | -100,00 | ||||
| 2025-08-14 | 13F | Wells Fargo & Company/mn | 934.247 | 315,10 | 22.646 | 312,72 | ||||
| 2025-07-31 | 13F | Optimum Investment Advisors | 0 | -100,00 | 0 | |||||
| 2025-07-17 | 13F | Greenleaf Trust | 9.328 | -8,11 | 226 | -8,50 | ||||
| 2025-08-14 | 13F | Smartleaf Asset Management LLC | 7.815 | 189 | ||||||
| 2025-07-18 | 13F | Forza Wealth Management, LLC | 10.000 | -28,57 | 242 | -29,03 | ||||
| 2025-08-11 | 13F | One Capital Management, LLC | 101.509 | 2.461 | ||||||
| 2025-08-14 | 13F | Marquette Associates, Inc. | 1.447 | -5,11 | 35 | -5,41 | ||||
| 2025-08-14 | 13F | Hrt Financial Lp | 0 | -100,00 | 0 | |||||
| 2025-07-09 | 13F | Dynamic Advisor Solutions LLC | 14.622 | -33,95 | 354 | -34,32 | ||||
| 2025-07-23 | 13F | Valmark Advisers, Inc. | 512.356 | 0,69 | 12.420 | 0,11 | ||||
| 2025-07-24 | 13F | Us Bancorp \de\ | 1.589 | -34,61 | 39 | -35,59 | ||||
| 2025-07-30 | 13F | Whittier Trust Co | 19.974 | 484 |