Grundlæggende statistik
| Institutionelle ejere | 84 total, 82 long only, 0 short only, 2 long/short - change of 4,94% MRQ |
| Gennemsnitlig porteføljeallokering | 0.2217 % - change of 14,84% MRQ |
| Institutionelle aktier (lange) | 4.200.602 (ex 13D/G) - change of -0,75MM shares -15,11% MRQ |
| Institutionel værdi (lang) | $ 73.696 USD ($1000) |
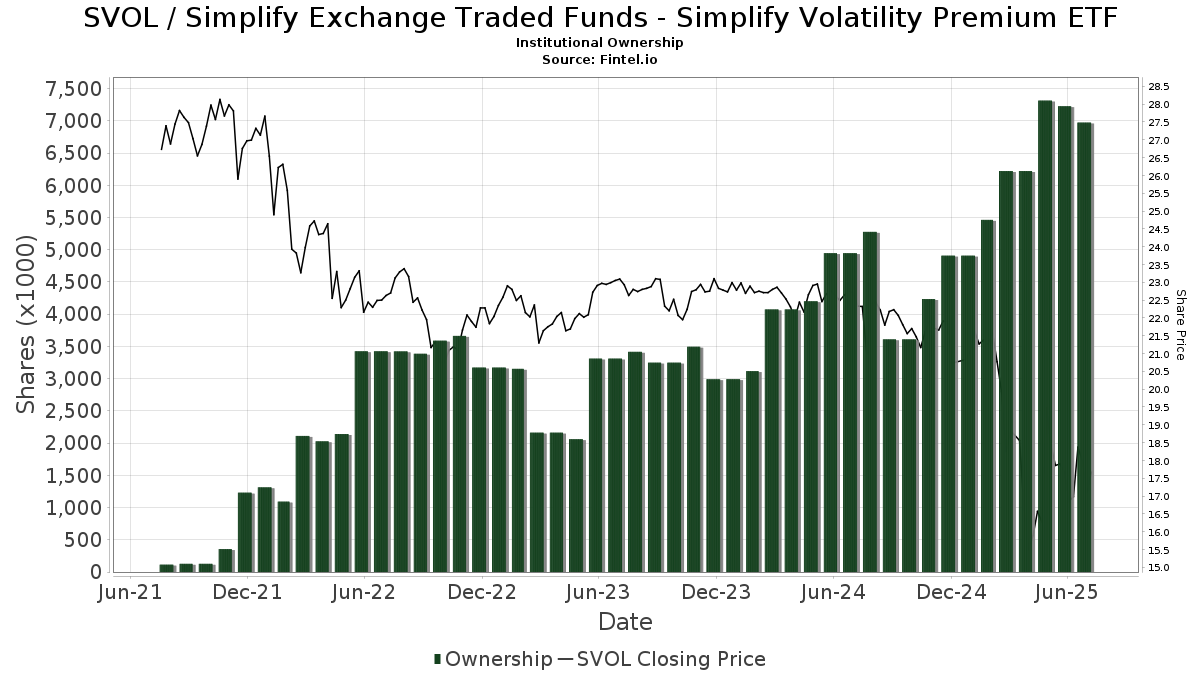
Institutionelt ejerskab og aktionærer
Simplify Exchange Traded Funds - Simplify Volatility Premium ETF (US:SVOL) har 84 institutionelle ejere og aktionærer, der har indsendt 13D/G- eller 13F-formularer til Securities Exchange Commission (SEC). Disse institutioner har i alt 4,200,602 aktier. Største aktionærer omfatter AE Wealth Management LLC, Elevated Capital Advisors, LLC, Owen LaRue, LLC, POM Investment Strategies, LLC, Visionary Wealth Advisors, Commonwealth Equity Services, Llc, Key Capital Management, INC, Beacon Capital Management, LLC, One Capital Management, LLC, and Howard Bailey Securities, Llc .
Simplify Exchange Traded Funds - Simplify Volatility Premium ETF (ARCA:SVOL) institutionel ejerskabsstruktur viser aktuelle positioner i virksomheden efter institutioner og fonde, samt seneste ændringer i positionsstørrelse. Større aktionærer kan omfatte individuelle investorer, investeringsforeninger, hedgefonde eller institutioner. Skema 13D angiver, at investoren besidder (eller besidder) mere end 5 % af virksomheden og har til hensigt (eller har til hensigt at) aktivt at forfølge en ændring i forretningsstrategi. Skema 13G indikerer en passiv investering på over 5%.
The share price as of March 6, 2026 is 16,04 / share. Previously, on March 10, 2025, the share price was 18,58 / share. This represents a decline of 13,67% over that period.
Fondens stemningsscore
Fund Sentiment Score (fka Ownership Accumulation Score) finder de aktier, der bliver mest købt af fonde. Det er resultatet af en sofistikeret, multi-faktor kvantitativ model, der identificerer virksomheder med de højeste niveauer af institutionel akkumulering. Scoringsmodellen bruger en kombination af den samlede stigning i oplyste ejere, ændringerne i porteføljeallokeringer i disse ejere og andre målinger. Tallet går fra 0 til 100, hvor højere tal indikerer et højere niveau af akkumulering for sine jævnaldrende, og 50 er gennemsnittet.
Opdateringsfrekvens: Dagligt
Se Ownership Explorer, som giver en liste over højest rangerende virksomheder.
AI+ Ask Fintel’s AI assistant about Simplify Exchange Traded Funds - Simplify Volatility Premium ETF.
Select a question to share a public post with an AI-crafted answer.
Thinking of good questions…
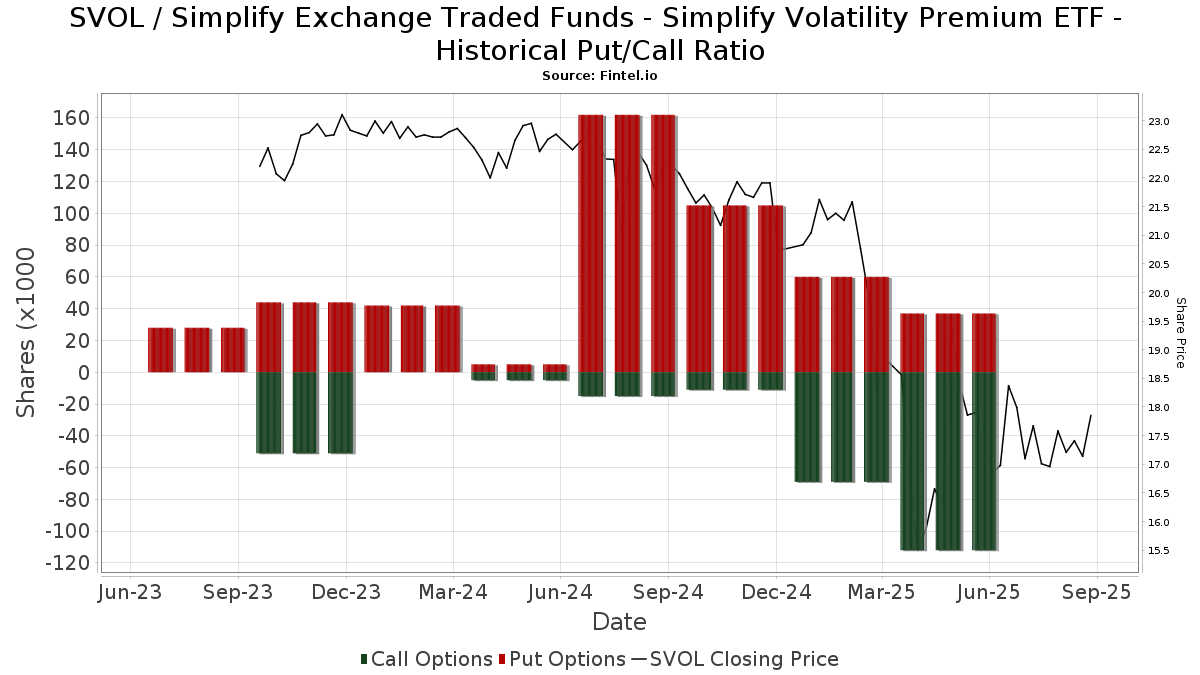
Institutionel Put/Call-forhold
Ud over at indberette standardaktie- og gældsudstedelser skal institutter med mere end 100 mill. aktiver under forvaltning også oplyse deres put- og call-optionsbeholdninger. Da salgsoptioner generelt indikerer negativ stemning, og købsoptioner indikerer positiv stemning, kan vi få en fornemmelse af den overordnede institutionelle stemning ved at plotte forholdet mellem put og kald. Diagrammet til højre viser det historiske put/call-forhold for dette instrument.
Brug af Put/Call Ratio som en indikator for investorernes stemning overvinder en af de vigtigste mangler ved at bruge totalt institutionelt ejerskab, som er, at en betydelig mængde af aktiver under forvaltning investeres passivt for at spore indekser. Passivt forvaltede fonde køber typisk ikke optioner, så indikatoren for put/call-forholdet følger mere nøje følelsen af aktivt forvaltede fonde.
13F og NPORT arkivering
Detaljer om 13F-arkivering er gratis. Detaljer om NP-ansøgninger kræver et premium-medlemskab. Grønne rækker angiver nye positioner. Røde rækker angiver lukkede positioner. Klik på linket ikon for at se den fulde transaktionshistorik.
Opgrader
for at låse premium-data op og eksportere til Excel ![]() .
.
| Fil dato | Kilde | Investor | Type | Gennemsnitlig pris (Øst) |
Aktier | Δ Aktier (%) |
Rapporteret Værdi ($1000) |
Δ Værdi (%) |
Port Alloc (%) |
|
|---|---|---|---|---|---|---|---|---|---|---|
| 2026-02-03 | 13F | Anfield Capital Management, LLC | 2.654 | 0,00 | 47 | -2,13 | ||||
| 2026-02-09 | 13F | Huntington National Bank | 35 | -2,78 | ||||||
| 2026-02-10 | 13F | Root Financial Partners, LLC | 257 | -90,71 | 5 | -91,84 | ||||
| 2025-11-19 | 13F | Stance Capital Llc | 512 | 9 | ||||||
| 2026-02-12 | 13F | Jane Street Group, Llc | 0 | -100,00 | 0 | -100,00 | ||||
| 2026-01-27 | 13F | Elevated Capital Advisors, LLC | 413.589 | 19,66 | 7.263 | 16,73 | ||||
| 2026-02-13 | 13F | Beacon Capital Management, LLC | 113.534 | -81,21 | 1.994 | -81,68 | ||||
| 2026-02-10 | 13F | One Capital Management, LLC | 108.269 | -1,11 | 1.901 | -3,50 | ||||
| 2026-01-26 | 13F | AE Wealth Management LLC | 764.407 | -20,81 | 13.423 | -22,75 | ||||
| 2026-02-12 | 13F | Triumph Capital Management | 520 | 0,00 | 9 | 0,00 | ||||
| 2026-02-02 | 13F | FSA Advisors, Inc. | 86.628 | 1.521 | ||||||
| 2026-02-10 | 13F | Belvedere Trading LLC | Put | 0 | -100,00 | 0 | ||||
| 2026-02-12 | 13F | Mosley Wealth Management | 14.311 | 259 | ||||||
| 2026-02-17 | 13F | Private Advisor Group, LLC | Put | 0 | -100,00 | 0 | ||||
| 2026-02-14 | 13F | Whipplewood Advisors, LLC | 5.534 | 6,42 | 97 | 4,30 | ||||
| 2026-01-22 | 13F | Greenberg Financial Group | 56.080 | 985 | ||||||
| 2026-02-12 | 13F | Steward Partners Investment Advisory, Llc | 0 | -100,00 | 0 | |||||
| 2026-02-10 | 13F | Belvedere Trading LLC | Call | 0 | -100,00 | 0 | ||||
| 2026-02-10 | 13F | Belvedere Trading LLC | 0 | -100,00 | 0 | |||||
| 2025-11-12 | 13F | Transce3nd, LLC | 0 | -100,00 | 0 | -100,00 | ||||
| 2026-02-02 | 13F | B.O.S.S. Retirement Advisors, LLC | 94.136 | 75,46 | 1.653 | 71,30 | ||||
| 2025-11-14 | 13F | Hrt Financial Lp | 0 | -100,00 | 0 | |||||
| 2026-01-27 | 13F | Duncker Streett & Co Inc | 200 | 0,00 | 4 | 0,00 | ||||
| 2026-01-30 | 13F | Us Bancorp \de\ | 900 | 16 | ||||||
| 2026-02-06 | 13F | Authentikos Wealth Advisory, LLC | 65.040 | -27,78 | 1.142 | -29,55 | ||||
| 2026-02-06 | 13F | Larson Financial Group LLC | 1 | 0,00 | 0 | |||||
| 2026-02-06 | 13F | Ignite Planners, LLC | 10.487 | 183 | ||||||
| 2026-02-13 | 13F | Ieq Capital, Llc | 73.342 | 0,31 | 1.288 | -2,20 | ||||
| 2026-02-11 | 13F | Janney Montgomery Scott LLC | 0 | -100,00 | 0 | |||||
| 2026-02-03 | 13F | Legacy Wealth Managment, LLC/ID | 102.049 | -5,41 | 1.792 | -7,73 | ||||
| 2026-02-11 | 13F | Howard Bailey Securities, Llc | 108.091 | 1.898 | ||||||
| 2026-02-13 | 13F | Aptus Capital Advisors, LLC | 9.247 | 0,00 | 162 | -2,41 | ||||
| 2025-11-12 | 13F | Napa Wealth Management | 39.025 | 0,56 | 702 | -1,54 | ||||
| 2026-01-26 | 13F | Key Capital Management, INC | 147.552 | 2.591 | ||||||
| 2026-02-09 | 13F | Hartland & Co., LLC | 1.265 | 22 | ||||||
| 2026-02-09 | 13F | MRP Capital Investments, LLC | 200 | 4 | ||||||
| 2026-03-04 | 13F | SHP Wealth Management | 1.603 | 28 | ||||||
| 2026-02-05 | 13F | Allworth Financial LP | 10.000 | 0,00 | 176 | -2,78 | ||||
| 2026-02-03 | 13F | Koshinski Asset Management, Inc. | 11.766 | 16,95 | 207 | 13,81 | ||||
| 2026-02-12 | 13F | Bank Of Montreal /can/ | 32.215 | 8,46 | 566 | 5,81 | ||||
| 2026-02-12 | 13F | Commonwealth Equity Services, Llc | 158.792 | 1,12 | 2.788 | 139.300,00 | ||||
| 2026-01-26 | 13F | Decker Retirement Planning Inc. | 12.125 | -58,57 | 213 | -59,70 | ||||
| 2026-02-06 | 13F | Blackston Financial Advisory Group, LLC | 46.019 | 13,75 | 808 | 10,99 | ||||
| 2026-02-06 | 13F | IFP Advisors, Inc | 3.656 | -22,80 | 64 | -24,71 | ||||
| 2025-11-07 | 13F | Vista Investment Management | 0 | -100,00 | 0 | |||||
| 2025-11-12 | 13F | Group One Trading, L.p. | 0 | -100,00 | 0 | |||||
| 2026-02-05 | 13F | Owen LaRue, LLC | 333.339 | 94,62 | 5.853 | 89,85 | ||||
| 2026-01-29 | 13F | UBS Group AG | 605 | 11 | ||||||
| 2025-11-12 | 13F | Tounjian Advisory Partners, Llc | 0 | -100,00 | 0 | |||||
| 2025-11-14 | 13F | Citadel Advisors Llc | 0 | -100,00 | 0 | -100,00 | ||||
| 2026-02-13 | 13F | Morgan Stanley | 2 | -99,72 | 0 | -100,00 | ||||
| 2026-01-21 | 13F | Guild Investment Management, Inc. | 19.187 | 337 | ||||||
| 2026-02-13 | 13F | Ausdal Financial Partners, Inc. | 0 | -100,00 | 0 | |||||
| 2026-01-21 | 13F | Sound Income Strategies, LLC | 1.461 | 45,66 | 26 | 44,44 | ||||
| 2026-02-12 | 13F | Jane Street Group, Llc | Call | 67.900 | -18,49 | 1.192 | -20,48 | |||
| 2026-02-14 | 13F | POM Investment Strategies, LLC | 205.239 | -34,84 | 3.604 | -36,44 | ||||
| 2026-02-12 | 13F | Jane Street Group, Llc | Put | 19.100 | -19,07 | 335 | -20,99 | |||
| 2026-01-09 | 13F | Tactive Advisors, LLC | 60.585 | -47,32 | 1.064 | -48,62 | ||||
| 2026-01-13 | 13F | CoreCap Advisors, LLC | 5.672 | -8,72 | 100 | -10,81 | ||||
| 2026-02-04 | 13F | Advisor OS, LLC | 11.766 | 16,95 | 207 | 13,81 | ||||
| 2026-02-12 | 13F | Summit Financial, LLC | 29.334 | -20,52 | 515 | -22,44 | ||||
| 2026-01-21 | 13F | Cambridge Advisors Inc. | 47.854 | 0,76 | 840 | -1,64 | ||||
| 2026-02-11 | 13F | Straight Path Wealth Management | 0 | -100,00 | 0 | |||||
| 2026-02-17 | 13F | Creative Planning | 0 | -100,00 | 0 | |||||
| 2025-11-12 | 13F | Park Square Financial Group, LLC | 0 | -100,00 | 0 | |||||
| 2026-02-03 | 13F | RFG Advisory, LLC | 18.223 | 0,00 | 320 | -2,74 | ||||
| 2026-02-09 | 13F | Collaborative Wealth Managment Inc. | 16.567 | -49,77 | 291 | -51,10 | ||||
| 2026-02-13 | 13F | Kestra Advisory Services, LLC | 3.125 | 55 | ||||||
| 2025-11-12 | 13F | Brinker Capital Investments, LLC | 0 | -100,00 | 0 | |||||
| 2026-02-17 | 13F | Captrust Financial Advisors | 72.135 | -8,47 | 1.267 | -10,72 | ||||
| 2026-01-26 | 13F | Cwm, Llc | 3.116 | 2,57 | 0 | |||||
| 2026-02-06 | 13F | HighTower Advisors, LLC | 0 | -100,00 | 0 | |||||
| 2026-01-23 | 13F | Farther Finance Advisors, LLC | 17.620 | 418,39 | 309 | 406,56 | ||||
| 2025-11-13 | 13F | Parallel Advisors, LLC | 0 | -100,00 | 0 | |||||
| 2026-02-13 | 13F | SRS Capital Advisors, Inc. | 9.917 | 174 | ||||||
| 2026-02-13 | 13F | Visionary Wealth Advisors | 187.674 | -6,85 | 3.296 | -9,13 | ||||
| 2026-02-11 | 13F | Stirlingshire Investments, Inc. | 34.319 | 603 | ||||||
| 2026-01-28 | 13F | Financial Perspectives, Inc | 3.365 | 59 | ||||||
| 2026-02-17 | 13F | Citadel Advisors Llc | Call | 60.300 | -7,52 | 1.059 | -9,80 | |||
| 2025-11-12 | 13F | JT Stratford LLC | 0 | -100,00 | 0 | |||||
| 2026-02-17 | 13F | Citadel Advisors Llc | Put | 24.200 | -29,45 | 425 | -31,28 | |||
| 2025-11-03 | 13F | TD Waterhouse Canada Inc. | 0 | -100,00 | 0 | |||||
| 2026-02-12 | 13F | BlackRock, Inc. | 1.188 | 0,00 | 21 | -4,76 | ||||
| 2026-02-12 | 13F | Compass Capital Corp /ma/ /adv | 16.424 | 0,68 | 285 | -1,72 | ||||
| 2026-02-17 | 13F | Royal Bank Of Canada | 49 | 0,00 | 1 | 0,00 | ||||
| 2026-01-22 | 13F | Fiduciary Alliance LLC | 17.259 | -49,56 | 303 | -50,73 | ||||
| 2026-02-06 | 13F | Lloyd Advisory Services, LLC. | 14.112 | 248 | ||||||
| 2026-02-11 | 13F | TCTC Holdings, LLC | 8 | 0,00 | 0 | |||||
| 2025-11-14 | 13F | Susquehanna International Group, Llp | 0 | -100,00 | 0 | -100,00 | ||||
| 2026-01-16 | 13F | Park Edge Advisors, LLC | 95.179 | 5,97 | 1.671 | 3,40 | ||||
| 2026-02-17 | 13F | Advisor Group Holdings, Inc. | 1.372 | -17,60 | 24 | -17,24 | ||||
| 2025-11-14 | 13F | National Bank Of Canada /fi/ | 0 | -100,00 | 0 | |||||
| 2025-11-10 | 13F | Aspen Wealth Strategies, LLC | 0 | -100,00 | 0 | |||||
| 2026-02-13 | 13F | J Hagan Capital, Inc. | 11.105 | -86,41 | 195 | -86,74 | ||||
| 2025-11-10 | 13F | Parkside Investments, LLC | 0 | -100,00 | 0 | -100,00 | ||||
| 2026-02-11 | 13F | LPL Financial LLC | 55.976 | -8,87 | 983 | -11,13 | ||||
| 2026-02-13 | 13F | MAI Capital Management | 0 | -100,00 | 0 | |||||
| 2025-11-25 | 13F | Arq Wealth Advisors, Llc | 0 | -100,00 | 0 | |||||
| 2026-02-05 | 13F | Soltis Investment Advisors LLC | 14.715 | -48,67 | 258 | -50,00 | ||||
| 2026-02-17 | 13F | Scarborough Advisors, LLC | 0 | -100,00 | 0 | |||||
| 2026-02-17 | 13F | Strive Financial Group ,LLC | 3.622 | 64 | ||||||
| 2026-02-13 | 13F | Mml Investors Services, Llc | 29.217 | -1,69 | 513 | -3,93 | ||||
| 2025-11-04 | 13F | Guerra Advisors Inc | 14.130 | -52,08 | 254 | -53,14 | ||||
| 2026-02-05 | 13F | Tucker Asset Management Llc | 716 | 13 | ||||||
| 2026-01-16 | 13F | Crewe Advisors LLC | 1.193 | 0,00 | 21 | -4,76 | ||||
| 2026-01-26 | 13F | Discipline Wealth Solutions, LLC | 54.700 | 20,33 | 961 | 17,36 | ||||
| 2026-02-12 | 13F | CIBC Private Wealth Group, LLC | 0 | -100,00 | 0 | |||||
| 2026-01-27 | 13F | Fiscal Wisdom Wealth Management, LLC | 15.715 | 276 | ||||||
| 2026-02-12 | 13F | Andina Capital Management, LLC | 45.676 | -16,07 | 802 | -18,08 | ||||
| 2026-02-04 | 13F | Drive Wealth Management, Llc | 0 | -100,00 | 0 | |||||
| 2026-01-14 | 13F | Wealthcare Advisory Partners LLC | 15.652 | 4,46 | 275 | 1,86 | ||||
| 2026-01-30 | 13F | Sigma Planning Corp | 37.456 | 5,17 | 658 | 2,50 | ||||
| 2026-01-22 | 13F | Networth Advisors, LLC | 29.941 | 526 | ||||||
| 2026-02-17 | 13F | Old Mission Capital Llc | 33.300 | -14,00 | 585 | -16,09 | ||||
| 2025-10-29 | 13F | CAP Partners, LLC | 0 | -100,00 | 0 | |||||
| 2026-02-17 | 13F | Private Advisor Group, LLC | 0 | -100,00 | 0 | |||||
| 2025-11-14 | 13F | Raymond James Financial Inc | 0 | -100,00 | 0 | |||||
| 2026-02-10 | 13F | Envestnet Asset Management Inc | 31.888 | 9,80 | 560 | 7,09 | ||||
| 2026-02-13 | 13F | Luminist Capital LLC | 5.344 | -74,40 | 94 | -75,40 | ||||
| 2026-02-02 | 13F | Avidian Wealth Solutions, LLC | 31.065 | 0,00 | 546 | -2,50 | ||||
| 2026-02-19 | 13F | Claris Financial LLC | 48.489 | 10,30 | 851 | 5,32 | ||||
| 2025-11-17 | 13F | Pin Oak Investment Advisors Inc | 0 | -100,00 | 0 |