Grundlæggende statistik
| Institutionelle ejere | 113 total, 113 long only, 0 short only, 0 long/short - change of -5,00% MRQ |
| Gennemsnitlig porteføljeallokering | 0.2577 % - change of 22,09% MRQ |
| Institutionelle aktier (lange) | 7.866.651 (ex 13D/G) - change of -9,70MM shares -55,23% MRQ |
| Institutionel værdi (lang) | $ 258.725 USD ($1000) |
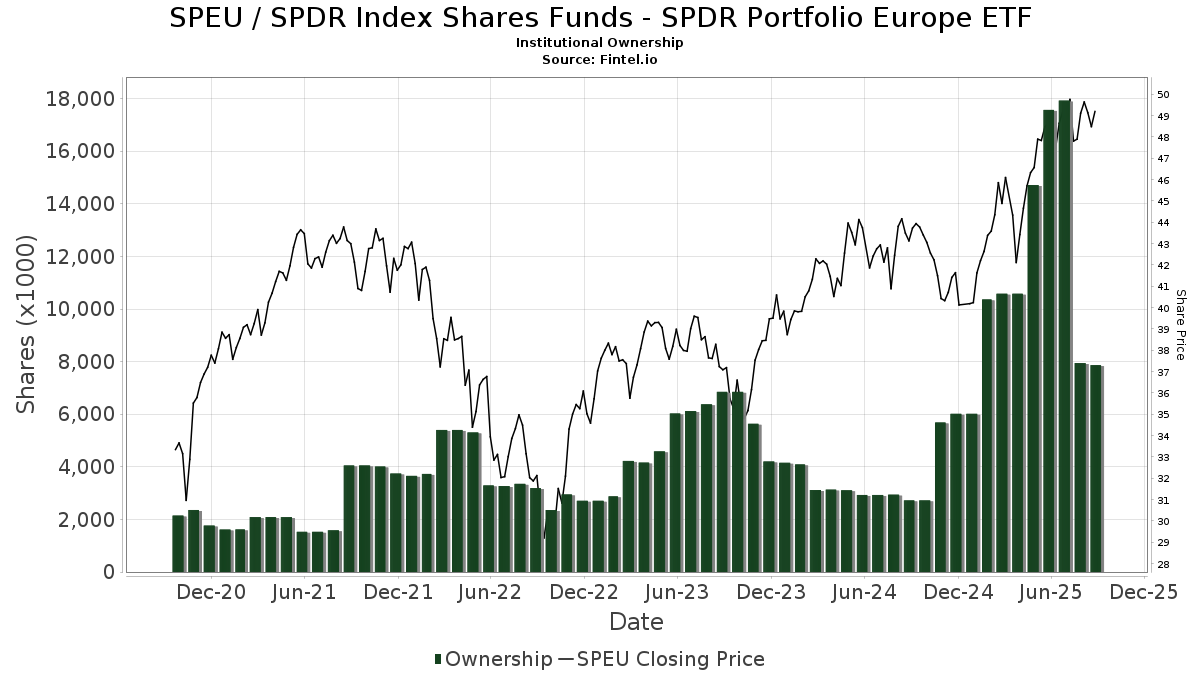
Institutionelt ejerskab og aktionærer
SPDR Index Shares Funds - SPDR Portfolio Europe ETF (US:SPEU) har 113 institutionelle ejere og aktionærer, der har indsendt 13D/G- eller 13F-formularer til Securities Exchange Commission (SEC). Disse institutioner har i alt 7,866,651 aktier. Største aktionærer omfatter Cwm, Llc, Morgan Stanley, Jane Street Group, Llc, Advisor Group Holdings, Inc., INTL - Main International ETF, Main Management ETF Advisors, LLC, LPL Financial LLC, Bank Of America Corp /de/, Jacobi Capital Management LLC, and Charles Schwab Investment Management Inc .
SPDR Index Shares Funds - SPDR Portfolio Europe ETF (ARCA:SPEU) institutionel ejerskabsstruktur viser aktuelle positioner i virksomheden efter institutioner og fonde, samt seneste ændringer i positionsstørrelse. Større aktionærer kan omfatte individuelle investorer, investeringsforeninger, hedgefonde eller institutioner. Skema 13D angiver, at investoren besidder (eller besidder) mere end 5 % af virksomheden og har til hensigt (eller har til hensigt at) aktivt at forfølge en ændring i forretningsstrategi. Skema 13G indikerer en passiv investering på over 5%.
The share price as of September 15, 2025 is 49,93 / share. Previously, on September 16, 2024, the share price was 43,98 / share. This represents an increase of 13,54% over that period.
Fondens stemningsscore
Fund Sentiment Score (fka Ownership Accumulation Score) finder de aktier, der bliver mest købt af fonde. Det er resultatet af en sofistikeret, multi-faktor kvantitativ model, der identificerer virksomheder med de højeste niveauer af institutionel akkumulering. Scoringsmodellen bruger en kombination af den samlede stigning i oplyste ejere, ændringerne i porteføljeallokeringer i disse ejere og andre målinger. Tallet går fra 0 til 100, hvor højere tal indikerer et højere niveau af akkumulering for sine jævnaldrende, og 50 er gennemsnittet.
Opdateringsfrekvens: Dagligt
Se Ownership Explorer, som giver en liste over højest rangerende virksomheder.
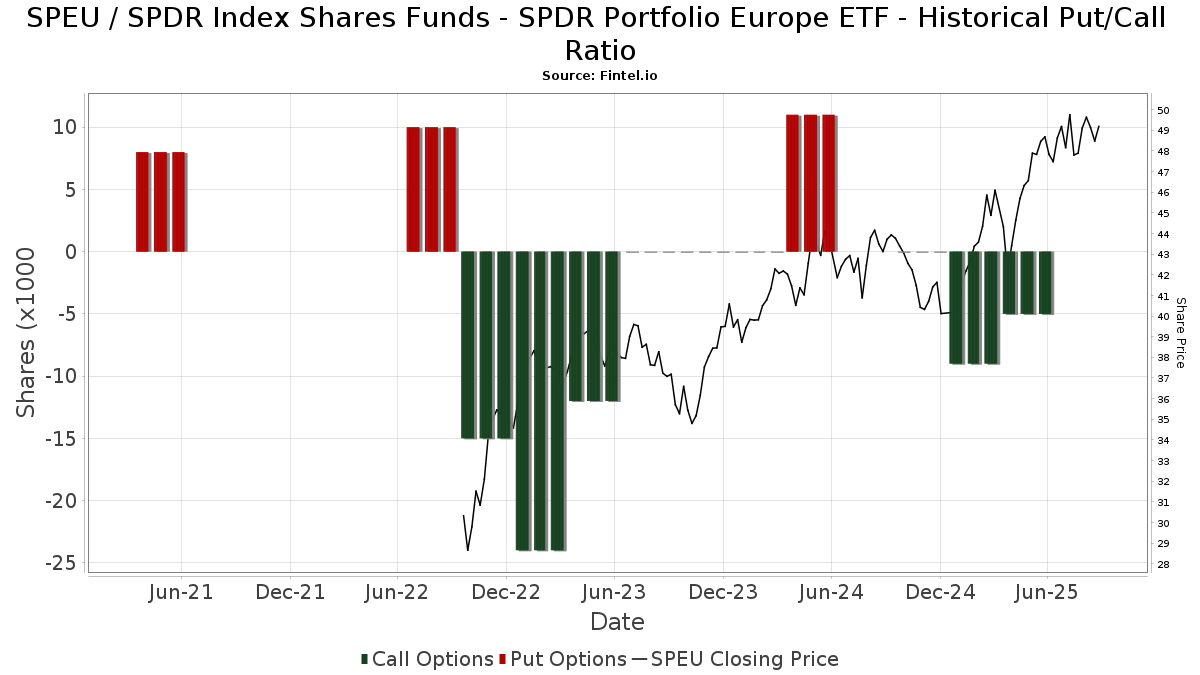
Institutionel Put/Call-forhold
Ud over at indberette standardaktie- og gældsudstedelser skal institutter med mere end 100 mill. aktiver under forvaltning også oplyse deres put- og call-optionsbeholdninger. Da salgsoptioner generelt indikerer negativ stemning, og købsoptioner indikerer positiv stemning, kan vi få en fornemmelse af den overordnede institutionelle stemning ved at plotte forholdet mellem put og kald. Diagrammet til højre viser det historiske put/call-forhold for dette instrument.
Brug af Put/Call Ratio som en indikator for investorernes stemning overvinder en af de vigtigste mangler ved at bruge totalt institutionelt ejerskab, som er, at en betydelig mængde af aktiver under forvaltning investeres passivt for at spore indekser. Passivt forvaltede fonde køber typisk ikke optioner, så indikatoren for put/call-forholdet følger mere nøje følelsen af aktivt forvaltede fonde.
13F og NPORT arkivering
Detaljer om 13F-arkivering er gratis. Detaljer om NP-ansøgninger kræver et premium-medlemskab. Grønne rækker angiver nye positioner. Røde rækker angiver lukkede positioner. Klik på linket ikon for at se den fulde transaktionshistorik.
Opgrader
for at låse premium-data op og eksportere til Excel ![]() .
.
| Fil dato | Kilde | Investor | Type | Gennemsnitlig pris (Øst) |
Aktier | Δ Aktier (%) |
Rapporteret Værdi ($1000) |
Δ Værdi (%) |
Port Alloc (%) |
|
|---|---|---|---|---|---|---|---|---|---|---|
| 2025-08-11 | 13F | Perennial Investment Advisors, LLC | 7.508 | 24,08 | 364 | 36,47 | ||||
| 2025-08-12 | 13F | Jacobi Capital Management LLC | 239.484 | 11.605 | ||||||
| 2025-08-08 | 13F | Avantax Advisory Services, Inc. | 4.954 | 240 | ||||||
| 2025-07-24 | 13F | IFP Advisors, Inc | 300 | 0,00 | 15 | 7,69 | ||||
| 2025-08-11 | 13F | Outlook Wealth Advisors, LLC | 0 | -100,00 | 0 | |||||
| 2025-07-25 | 13F | Richardson Financial Services Inc. | 0 | -100,00 | 0 | |||||
| 2025-08-14 | 13F | Novus Advisors, Llc | 0 | -100,00 | 0 | |||||
| 2025-08-18 | 13F | N.E.W. Advisory Services LLC | 190 | 1,60 | 9 | 12,50 | ||||
| 2025-07-25 | 13F | Envestnet Portfolio Solutions, Inc. | 0 | -100,00 | 0 | |||||
| 2025-05-12 | 13F | Independent Advisor Alliance | 0 | -100,00 | 0 | |||||
| 2025-07-25 | 13F | Johnson Investment Counsel Inc | 36.334 | 320,58 | 1.761 | 363,16 | ||||
| 2025-07-21 | 13F | Crews Bank & Trust | 500 | 0,00 | 24 | 9,09 | ||||
| 2025-08-14 | 13F | Williams Jones Wealth Management, LLC. | 46.800 | 2.268 | ||||||
| 2025-07-28 | 13F | Harbour Investments, Inc. | 631 | -97,85 | 31 | -97,68 | ||||
| 2025-08-14 | 13F | Treasure Coast Financial Planning | 118.562 | 7,77 | 5.746 | 18,67 | ||||
| 2025-08-14 | 13F | Sargent Investment Group, LLC | 9.835 | 73,00 | 471 | 88,00 | ||||
| 2025-05-15 | 13F | Citadel Advisors Llc | Put | 0 | -100,00 | 0 | -100,00 | |||
| 2025-08-12 | 13F | SRS Capital Advisors, Inc. | 38 | 0,00 | 2 | 0,00 | ||||
| 2025-07-10 | 13F | Sharkey, Howes & Javer | 38.127 | 1.848 | ||||||
| 2025-08-12 | 13F | Main Management LLC | 2.024 | 0,00 | 0 | |||||
| 2025-08-12 | 13F | Global Retirement Partners, LLC | 676 | -22,30 | 33 | -5,88 | ||||
| 2025-08-11 | 13F | Strategic Wealth Partners, Ltd. | 69 | 3 | ||||||
| 2025-08-05 | 13F | Key FInancial Inc | 0 | -100,00 | 0 | |||||
| 2025-05-01 | 13F | Quest 10 Wealth Builders, Inc. | 5 | 0 | ||||||
| 2025-07-16 | 13F | Castleview Partners, Llc | 6.931 | -5,83 | 336 | 3,72 | ||||
| 2025-08-13 | 13F | Flow Traders U.s. Llc | 49.300 | -83,51 | 2 | -84,62 | ||||
| 2025-08-11 | 13F | Hexagon Capital Partners LLC | 0 | -100,00 | 0 | |||||
| 2025-08-14 | 13F | Raymond James Financial Inc | 37.358 | 0,77 | 1.810 | 10,97 | ||||
| 2025-05-28 | NP | GAL - SPDR SSGA Global Allocation ETF This fund is a listed as child fund of State Street Corp and if that institution has disclosed ownership in this security, then these positions will not be double counted when calculating total shares and total value | 216.497 | -43,71 | 9.528 | -35,67 | ||||
| 2025-07-22 | 13F | Aspire Private Capital, LLC | 0 | -100,00 | 0 | |||||
| 2025-07-29 | 13F | Tradewinds Capital Management, LLC | 1.459 | 1,81 | 71 | 11,11 | ||||
| 2025-08-12 | 13F | Steward Partners Investment Advisory, Llc | 150 | 0,00 | 7 | 16,67 | ||||
| 2025-08-05 | 13F | GPS Wealth Strategies Group, LLC | 917 | 45,79 | 44 | 62,96 | ||||
| 2025-08-14 | 13F | Arete Wealth Advisors, LLC | 5.866 | 0,00 | 0 | |||||
| 2025-08-13 | 13F | Keystone Financial Group | 6.400 | -3,03 | 310 | 6,90 | ||||
| 2025-08-14 | 13F | Mml Investors Services, Llc | 8.093 | -4,33 | 0 | |||||
| 2025-08-14 | 13F | Fmr Llc | 3.382 | 4,13 | 164 | 14,79 | ||||
| 2025-07-30 | 13F | Bogart Wealth, LLC | 15 | 0,00 | 1 | |||||
| 2025-08-13 | 13F | Continuum Advisory, LLC | 0 | -100,00 | 0 | -100,00 | ||||
| 2025-07-31 | 13F | Ssa Swiss Advisors Ag | 1.500 | 0,00 | 75 | 12,12 | ||||
| 2025-08-01 | 13F | Austin Private Wealth, LLC | 0 | -100,00 | 0 | |||||
| 2025-06-27 | NP | INTL - Main International ETF | 355.515 | 16.247 | ||||||
| 2025-08-14 | 13F | Smartleaf Asset Management LLC | 42 | -82,64 | 2 | -80,00 | ||||
| 2025-04-23 | 13F | Crewe Advisors LLC | 0 | -100,00 | 0 | |||||
| 2025-08-27 | 13F | Barnes Wealth Management Group, Inc | 5.970 | 289 | ||||||
| 2025-08-06 | 13F | SOUTH STATE Corp | 20 | 1 | ||||||
| 2025-07-17 | 13F | Worth Financial Advisory Group, LLC | 4.641 | 225 | ||||||
| 2025-07-31 | 13F | Cambridge Investment Research Advisors, Inc. | 0 | -100,00 | 0 | |||||
| 2025-07-14 | 13F | Iams Wealth Management, Llc | 0 | -100,00 | 0 | |||||
| 2025-07-14 | 13F | U.S. Capital Wealth Advisors, LLC | 4.861 | 1,84 | 236 | 11,90 | ||||
| 2025-08-14 | 13F | Jane Street Group, Llc | 831.260 | 389,50 | 40.283 | 439,03 | ||||
| 2025-08-12 | 13F | Eldridge Investment Advisors, Inc. | 33.888 | 20,26 | 1.642 | 32,42 | ||||
| 2025-08-14 | 13F | Royal Bank Of Canada | 38.862 | 629,80 | 1.883 | 704,70 | ||||
| 2025-08-04 | 13F | Assetmark, Inc | 5.358 | -98,46 | 260 | -98,30 | ||||
| 2025-07-21 | 13F | Pacific Financial Group Inc | 14.972 | -1,87 | 726 | 8,05 | ||||
| 2025-05-15 | 13F | IHT Wealth Management, LLC | 0 | -100,00 | 0 | |||||
| 2025-08-14 | 13F | Citadel Advisors Llc | 12.889 | 625 | ||||||
| 2025-08-14 | 13F | Susquehanna International Group, Llp | Call | 5.400 | -43,16 | 262 | -37,56 | |||
| 2025-08-12 | 13F | Jpmorgan Chase & Co | 231 | 131,00 | 11 | 175,00 | ||||
| 2025-08-14 | 13F | Susquehanna International Group, Llp | 102.006 | 537,50 | 4.943 | 602,13 | ||||
| 2025-08-14 | 13F | Qube Research & Technologies Ltd | 2.103 | -11,71 | 102 | -2,88 | ||||
| 2025-07-30 | 13F | Atlantic Edge Private Wealth Management, LLC | 203.124 | 0,99 | 9.843 | 11,21 | ||||
| 2025-04-29 | 13F | Lee Danner & Bass Inc | 0 | -100,00 | 0 | |||||
| 2025-08-14 | 13F | Wells Fargo & Company/mn | 146.681 | 15,07 | 7.108 | 26,72 | ||||
| 2025-08-15 | 13F | WealthCollab, LLC | 839 | 1,70 | 41 | 11,11 | ||||
| 2025-07-08 | 13F | Parallel Advisors, LLC | 0 | -100,00 | 0 | |||||
| 2025-07-14 | 13F | AdvisorNet Financial, Inc | 9 | 0,00 | 0 | |||||
| 2025-08-07 | 13F | Allworth Financial LP | 33 | 0,00 | 2 | 0,00 | ||||
| 2025-08-11 | 13F | Principal Securities, Inc. | 74 | 0,00 | 4 | 50,00 | ||||
| 2025-08-18 | 13F | Hollencrest Capital Management | 15 | 0,00 | 1 | |||||
| 2025-08-14 | 13F | CoreCap Advisors, LLC | 15 | 1 | ||||||
| 2025-08-14 | 13F | Paces Ferry Wealth Advisors, Llc | 16.518 | -3,53 | 800 | 6,24 | ||||
| 2025-07-10 | 13F | Global Financial Private Client, LLC | 0 | -100,00 | 0 | |||||
| 2025-07-30 | 13F | Whittier Trust Co | 334 | 0,00 | 16 | 14,29 | ||||
| 2025-07-21 | 13F | Ascent Group, LLC | 0 | -100,00 | 0 | |||||
| 2025-04-28 | 13F | American Capital Advisory, LLC | 0 | -100,00 | 0 | |||||
| 2025-08-12 | 13F | Change Path, LLC | 4.509 | -82,69 | 219 | -80,98 | ||||
| 2025-08-14 | 13F | Bank Of America Corp /de/ | 295.524 | -4,43 | 14.321 | 5,24 | ||||
| 2025-08-12 | 13F | Integrated Advisors Network LLC | 5.235 | -0,70 | 254 | 9,05 | ||||
| 2025-08-08 | 13F | Larson Financial Group LLC | 1.063 | 0,00 | 52 | 10,87 | ||||
| 2025-08-18 | 13F/A | National Bank Of Canada /fi/ | 1.100 | 0,00 | 53 | 12,77 | ||||
| 2025-08-14 | 13F | Ameriprise Financial Inc | 4.758 | 231 | ||||||
| 2025-08-05 | 13F | NewSquare Capital LLC | 2 | 0,00 | 0 | |||||
| 2025-05-02 | 13F | Capital A Wealth Management, LLC | 8 | 0 | ||||||
| 2025-07-11 | 13F | International Private Wealth Advisors LLC | 0 | -100,00 | 0 | |||||
| 2025-08-11 | 13F | Private Advisor Group, LLC | 58.098 | 713,24 | 2.815 | 796,50 | ||||
| 2025-08-14 | 13F | State Street Corp | 0 | -100,00 | 0 | |||||
| 2025-09-04 | 13F/A | Advisor Group Holdings, Inc. | 400.941 | 16,27 | 19.181 | 26,40 | ||||
| 2025-07-16 | 13F | Diversified Enterprises, LLC | 4.811 | -12,53 | 233 | -3,72 | ||||
| 2025-08-11 | 13F | HighTower Advisors, LLC | 0 | -100,00 | 0 | |||||
| 2025-07-29 | 13F | Balboa Wealth Partners | 0 | -100,00 | 0 | |||||
| 2025-08-07 | 13F | Zions Bancorporation, National Association /ut/ | 39 | 0,00 | 2 | 0,00 | ||||
| 2025-08-06 | 13F | AE Wealth Management LLC | 101 | -99,44 | 5 | -99,50 | ||||
| 2025-08-15 | 13F | Equitable Holdings, Inc. | 101.425 | 4.915 | ||||||
| 2025-08-11 | 13F | Covestor Ltd | 0 | -100,00 | 0 | |||||
| 2025-07-03 | 13F | Garde Capital, Inc. | 993 | 28,79 | 48 | 45,45 | ||||
| 2025-07-22 | 13F | Cedar Mountain Advisors, LLC | 181 | 0,00 | 9 | 14,29 | ||||
| 2025-08-08 | 13F | TD Capital Management LLC | 1.022 | 0,00 | 50 | 11,36 | ||||
| 2025-08-12 | 13F | Allen Capital Group, LLC | 22.474 | -0,77 | 1.089 | 9,34 | ||||
| 2025-08-14 | 13F | Goldman Sachs Group Inc | 22.759 | 1.103 | ||||||
| 2025-08-12 | 13F | Main Management ETF Advisors, LLC | 353.460 | -0,58 | 17 | 13,33 | ||||
| 2025-08-14 | 13F | Betterment LLC | 0 | -100,00 | 0 | |||||
| 2025-08-08 | 13F | Cetera Investment Advisers | 52.452 | -1,72 | 2.542 | 8,22 | ||||
| 2025-08-05 | 13F | Simplex Trading, Llc | 166 | 245,83 | 0 | |||||
| 2025-08-12 | 13F | LPL Financial LLC | 346.640 | -58,74 | 16.798 | -54,56 | ||||
| 2025-08-14 | 13F | Family Management Corp | 16.188 | 0,00 | 784 | 10,11 | ||||
| 2025-08-14 | 13F | UBS Group AG | 49.373 | -35,82 | 2.393 | -29,34 | ||||
| 2025-07-11 | 13F | Farther Finance Advisors, LLC | 340 | -48,25 | 16 | -44,83 | ||||
| 2025-08-13 | 13F | Scotia Capital Inc. | 79.598 | -16,01 | 3.857 | -7,51 | ||||
| 2025-08-14 | 13F | Federation des caisses Desjardins du Quebec | 568 | 0,00 | 28 | 12,50 | ||||
| 2025-08-14 | 13F | MGB Wealth Management, LLC | 3.872 | 80,85 | 188 | 98,94 | ||||
| 2025-07-29 | 13F | Kraft, Davis & Associates, LLC | 0 | -100,00 | 0 | |||||
| 2025-08-19 | 13F | Cape Investment Advisory, Inc. | 297 | 1,71 | 14 | 16,67 | ||||
| 2025-07-25 | 13F | Lodestar Private Asset Management Llc | 13.586 | 114,70 | 658 | 136,69 | ||||
| 2025-08-13 | 13F | Transce3nd, LLC | 151 | -54,52 | 7 | -50,00 | ||||
| 2025-07-11 | 13F | Grove Bank & Trust | 3.000 | 0,00 | 145 | 9,85 | ||||
| 2025-07-14 | 13F | Park Avenue Securities Llc | 0 | -100,00 | 0 | |||||
| 2025-08-05 | 13F | Landmark Wealth Management, Inc. | 0 | -100,00 | 0 | |||||
| 2025-07-10 | 13F | Worth Asset Management, LLC | 20.536 | 995 | ||||||
| 2025-07-18 | 13F | Lockerman Financial Group, Inc. | 0 | -100,00 | 0 | |||||
| 2025-08-15 | 13F | Morgan Stanley | 896.565 | -4,40 | 43.448 | 5,26 | ||||
| 2025-08-12 | 13F | Richard W. Paul & Associates, LLC | 128 | -94,97 | 6 | -94,64 | ||||
| 2025-08-13 | 13F | Jones Financial Companies Lllp | 4.139 | -21,85 | 200 | -15,25 | ||||
| 2025-07-15 | 13F | Armis Advisers, LLC | 70.717 | 1,26 | 3.435 | 7,62 | ||||
| 2025-08-04 | 13F | Spire Wealth Management | 419 | 20 | ||||||
| 2025-07-28 | 13F | Axxcess Wealth Management, Llc | 0 | -100,00 | 0 | |||||
| 2025-07-15 | 13F | Mather Group, Llc. | 192.661 | -98,10 | 9.336 | -97,91 | ||||
| 2025-08-04 | 13F | Creative Financial Designs Inc /adv | 110 | 0,92 | 5 | 25,00 | ||||
| 2025-08-06 | 13F | Commonwealth Equity Services, Llc | 4.903 | 1,55 | 0 | |||||
| 2025-07-28 | 13F | Frazier Financial Advisors, LLC | 175 | 1,74 | 8 | 14,29 | ||||
| 2025-08-12 | 13F | Virtu Financial LLC | 32.732 | 2 | ||||||
| 2025-08-14 | 13F | Comerica Bank | 7.177 | -2,07 | 348 | 7,76 | ||||
| 2025-08-13 | 13F | GeoWealth Management, LLC | 0 | -100,00 | 0 | |||||
| 2025-08-12 | 13F | Proequities, Inc. | 0 | 0 | ||||||
| 2025-08-15 | 13F | Captrust Financial Advisors | 7.076 | 343 | ||||||
| 2025-08-01 | 13F | Envestnet Asset Management Inc | 36.739 | -90,94 | 1.780 | -90,03 | ||||
| 2025-08-06 | 13F | Csenge Advisory Group | 8.434 | -5,17 | 405 | 4,11 | ||||
| 2025-07-17 | 13F | Raleigh Capital Management Inc. | 0 | -100,00 | 0 | -100,00 | ||||
| 2025-08-14 | 13F | Mariner, LLC | 5.441 | 264 | ||||||
| 2025-07-29 | 13F | Private Trust Co Na | 5.005 | 925,61 | 243 | 1.052,38 | ||||
| 2025-07-25 | 13F | Cwm, Llc | 2.047.116 | 150,68 | 99 | 182,86 | ||||
| 2025-08-08 | 13F | Good Life Advisors, LLC | 6.585 | 319 | ||||||
| 2025-07-24 | 13F | Blair William & Co/il | 167 | 94,19 | 8 | 166,67 | ||||
| 2025-08-15 | 13F | Kestra Advisory Services, LLC | 10.395 | -41,49 | 504 | -11,29 | ||||
| 2025-08-12 | 13F | Charles Schwab Investment Management Inc | 228.076 | 11.053 | ||||||
| 2025-08-14 | 13F | Hrt Financial Lp | 0 | -100,00 | 0 | |||||
| 2025-07-22 | 13F | Merit Financial Group, LLC | 6.413 | 311 | ||||||
| 2025-07-17 | 13F | K2 Financial Inc. | 15.022 | 7,28 | 722 | 18,36 | ||||
| 2025-08-14 | 13F | GWM Advisors LLC | 7.518 | -89,38 | 364 | -88,31 |
Other Listings
| MX:SPEU |