Grundlæggende statistik
| Institutionelle ejere | 111 total, 111 long only, 0 short only, 0 long/short - change of 3,67% MRQ |
| Gennemsnitlig porteføljeallokering | 0.0303 % - change of 6,54% MRQ |
| Institutionelle aktier (lange) | 688.883 (ex 13D/G) - change of -0,03MM shares -4,51% MRQ |
| Institutionel værdi (lang) | $ 77.866 USD ($1000) |
Institutionelt ejerskab og aktionærer
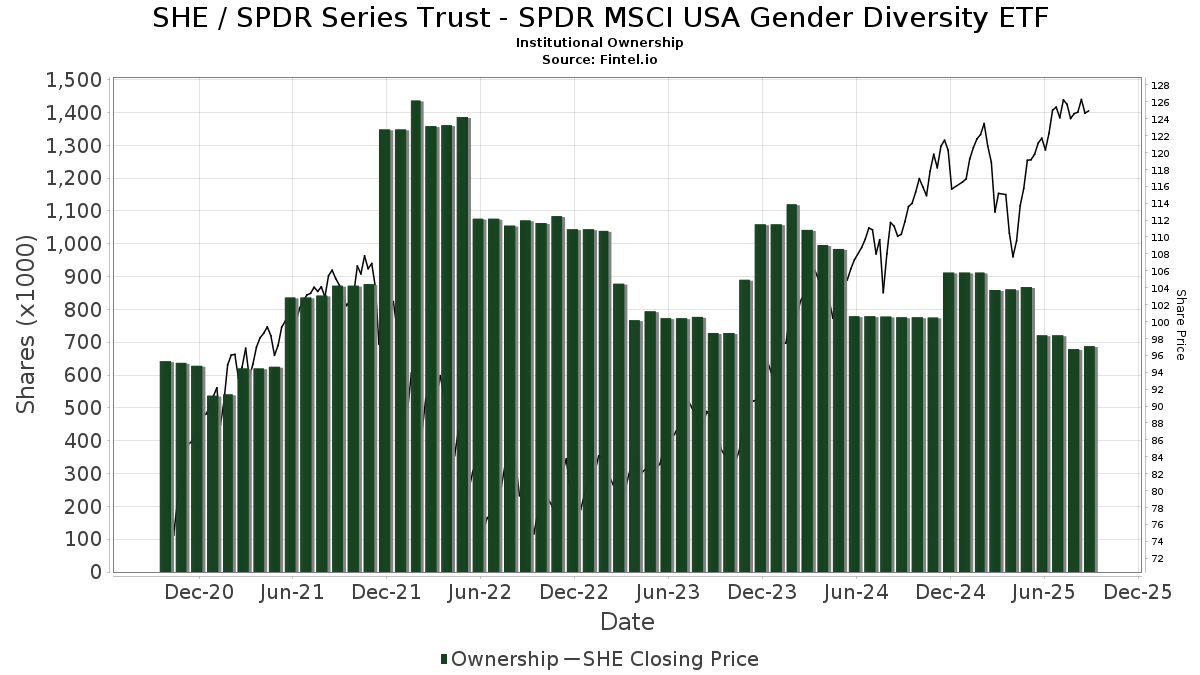
SPDR Series Trust - SPDR MSCI USA Gender Diversity ETF (US:SHE) har 111 institutionelle ejere og aktionærer, der har indsendt 13D/G- eller 13F-formularer til Securities Exchange Commission (SEC). Disse institutioner har i alt 688,883 aktier. Største aktionærer omfatter LPL Financial LLC, Morgan Stanley, Bank Of America Corp /de/, Jpmorgan Chase & Co, Betterment LLC, Albion Financial Group /ut, Cetera Investment Advisers, UBS Group AG, Commonwealth Equity Services, Llc, and Royal Bank Of Canada .
SPDR Series Trust - SPDR MSCI USA Gender Diversity ETF (ARCA:SHE) institutionel ejerskabsstruktur viser aktuelle positioner i virksomheden efter institutioner og fonde, samt seneste ændringer i positionsstørrelse. Større aktionærer kan omfatte individuelle investorer, investeringsforeninger, hedgefonde eller institutioner. Skema 13D angiver, at investoren besidder (eller besidder) mere end 5 % af virksomheden og har til hensigt (eller har til hensigt at) aktivt at forfølge en ændring i forretningsstrategi. Skema 13G indikerer en passiv investering på over 5%.
The share price as of September 17, 2025 is 126,17 / share. Previously, on September 18, 2024, the share price was 111,81 / share. This represents an increase of 12,85% over that period.
Fondens stemningsscore
Fund Sentiment Score (fka Ownership Accumulation Score) finder de aktier, der bliver mest købt af fonde. Det er resultatet af en sofistikeret, multi-faktor kvantitativ model, der identificerer virksomheder med de højeste niveauer af institutionel akkumulering. Scoringsmodellen bruger en kombination af den samlede stigning i oplyste ejere, ændringerne i porteføljeallokeringer i disse ejere og andre målinger. Tallet går fra 0 til 100, hvor højere tal indikerer et højere niveau af akkumulering for sine jævnaldrende, og 50 er gennemsnittet.
Opdateringsfrekvens: Dagligt
Se Ownership Explorer, som giver en liste over højest rangerende virksomheder.
Institutionel Put/Call-forhold
Ud over at indberette standardaktie- og gældsudstedelser skal institutter med mere end 100 mill. aktiver under forvaltning også oplyse deres put- og call-optionsbeholdninger. Da salgsoptioner generelt indikerer negativ stemning, og købsoptioner indikerer positiv stemning, kan vi få en fornemmelse af den overordnede institutionelle stemning ved at plotte forholdet mellem put og kald. Diagrammet til højre viser det historiske put/call-forhold for dette instrument.
Brug af Put/Call Ratio som en indikator for investorernes stemning overvinder en af de vigtigste mangler ved at bruge totalt institutionelt ejerskab, som er, at en betydelig mængde af aktiver under forvaltning investeres passivt for at spore indekser. Passivt forvaltede fonde køber typisk ikke optioner, så indikatoren for put/call-forholdet følger mere nøje følelsen af aktivt forvaltede fonde.
13F og NPORT arkivering
Detaljer om 13F-arkivering er gratis. Detaljer om NP-ansøgninger kræver et premium-medlemskab. Grønne rækker angiver nye positioner. Røde rækker angiver lukkede positioner. Klik på linket ikon for at se den fulde transaktionshistorik.
Opgrader
for at låse premium-data op og eksportere til Excel ![]() .
.
| Fil dato | Kilde | Investor | Type | Gennemsnitlig pris (Øst) |
Aktier | Δ Aktier (%) |
Rapporteret Værdi ($1000) |
Δ Værdi (%) |
Port Alloc (%) |
|
|---|---|---|---|---|---|---|---|---|---|---|
| 2025-07-30 | 13F | Fingerlakes Wealth Management, Inc. | 3.870 | -0,08 | 483 | 9,28 | ||||
| 2025-07-30 | 13F | Pittenger & Anderson Inc | 2.475 | 0,00 | 309 | 9,22 | ||||
| 2025-08-14 | 13F | Mariner, LLC | 3.000 | 0,10 | 374 | 9,36 | ||||
| 2025-06-30 | NP | VWITX - Vanguard Intermediate-Term Tax-Exempt Fund Investor Shares This fund is a listed as child fund of Vanguard Group Inc and if that institution has disclosed ownership in this security, then these positions will not be double counted when calculating total shares and total value | 1.167 | 0,00 | ||||||
| 2025-08-01 | 13F | Redwood Park Advisors LLC | 1 | 0,00 | 0 | |||||
| 2025-08-14 | 13F | Mendel Capital Management LLC | 4.037 | 0,00 | 504 | 9,35 | ||||
| 2025-07-25 | 13F | Johnson Investment Counsel Inc | 2.500 | -19,35 | 312 | -11,61 | ||||
| 2025-08-14 | 13F | Sunbelt Securities, Inc. | 548 | -0,18 | 63 | 1,61 | ||||
| 2025-08-14 | 13F | Integrated Wealth Concepts LLC | 3.693 | 21,20 | 461 | 32,56 | ||||
| 2025-08-08 | 13F | Smithfield Trust Co | 24 | 0,00 | 0 | |||||
| 2025-08-06 | 13F | Commonwealth Equity Services, Llc | 12.391 | 36,69 | 2 | 0,00 | ||||
| 2025-07-18 | 13F | Bartlett & Co. Wealth Management Llc | 570 | 0,00 | 71 | 9,23 | ||||
| 2025-08-14 | 13F | Goldman Sachs Group Inc | 0 | -100,00 | 0 | |||||
| 2025-08-18 | 13F | Geneos Wealth Management Inc. | 100 | 0,00 | 12 | 9,09 | ||||
| 2025-07-23 | 13F | Traphagen Investment Advisors Llc | 2.108 | -8,39 | 263 | 0,38 | ||||
| 2025-04-23 | 13F | Financial Life Planners | 0 | -100,00 | 0 | |||||
| 2025-05-08 | 13F | Us Financial Advisors, Llc | 4.363 | 4,68 | 498 | 3,11 | ||||
| 2025-08-12 | 13F | Proequities, Inc. | 0 | 0 | ||||||
| 2025-08-14 | 13F | UBS Group AG | 23.194 | -10,63 | 2.895 | -2,26 | ||||
| 2025-07-31 | 13F | Cambridge Investment Research Advisors, Inc. | 7.497 | 8,75 | 1 | |||||
| 2025-07-29 | 13F | Private Trust Co Na | 1.146 | 0,00 | 143 | 10,00 | ||||
| 2025-07-21 | 13F | Ameritas Advisory Services, LLC | 214 | 27 | ||||||
| 2025-08-14 | 13F | Aprio Wealth Management, LLC | 2.793 | -5,93 | 349 | 2,96 | ||||
| 2025-08-19 | 13F | Asset Dedication, LLC | 12 | 0,00 | 1 | 0,00 | ||||
| 2025-07-24 | 13F | Blair William & Co/il | 1.894 | -94,66 | 236 | -94,17 | ||||
| 2025-08-14 | 13F | Mercer Global Advisors Inc /adv | 2.995 | -2,06 | 374 | 6,88 | ||||
| 2025-08-14 | 13F | Marshall Investment Management, Llc | 0 | -100,00 | 0 | |||||
| 2025-08-01 | 13F | Envestnet Asset Management Inc | 4.509 | -2,82 | 563 | 6,24 | ||||
| 2025-08-05 | 13F | Bank Of Montreal /can/ | 700 | 0,00 | 87 | 10,13 | ||||
| 2025-08-14 | 13F | Camden Capital, LLC | 3.429 | 0,32 | 428 | 9,74 | ||||
| 2025-07-10 | 13F | Global Financial Private Client, LLC | 0 | -100,00 | 0 | |||||
| 2025-08-14 | 13F | Ameriprise Financial Inc | 5.132 | 32,17 | 640 | 33,13 | ||||
| 2025-07-30 | 13F | Princeton Global Asset Management LLC | 523 | 0,38 | 65 | 10,17 | ||||
| 2025-08-14 | 13F | AllSquare Wealth Management LLC | 47 | 0,00 | 6 | 0,00 | ||||
| 2025-07-10 | 13F | CWC Advisors, LLC. | 3.257 | -0,25 | 407 | 9,14 | ||||
| 2025-08-05 | 13F | Bank of New York Mellon Corp | 3.651 | -0,03 | 456 | 9,38 | ||||
| 2025-08-08 | 13F | Laurel Wealth Planning LLC | 5.371 | 2,27 | 670 | 11,85 | ||||
| 2025-07-28 | 13F | Harbour Investments, Inc. | 162 | 0,00 | 20 | 11,11 | ||||
| 2025-07-23 | 13F | Valmark Advisers, Inc. | 2.352 | 4,30 | 294 | 14,01 | ||||
| 2025-08-11 | 13F | Citigroup Inc | 3.852 | -1,83 | 481 | 7,38 | ||||
| 2025-07-28 | 13F | BRYN MAWR TRUST Co | 6.088 | -0,07 | 760 | 9,21 | ||||
| 2025-08-12 | 13F | Steward Partners Investment Advisory, Llc | 460 | 0,00 | 57 | 9,62 | ||||
| 2025-07-17 | 13F | Vermillion Wealth Management, Inc. | 975 | 0,21 | 122 | 9,01 | ||||
| 2025-08-15 | 13F | Kestra Advisory Services, LLC | 5.934 | -2,45 | 741 | 6,63 | ||||
| 2025-08-13 | 13F | Russell Investments Group, Ltd. | 429 | 0,00 | 54 | 10,42 | ||||
| 2025-08-14 | 13F | Comerica Bank | 609 | 0,33 | 76 | 10,14 | ||||
| 2025-09-04 | 13F/A | Advisor Group Holdings, Inc. | 6.587 | -18,12 | 822 | -10,46 | ||||
| 2025-07-25 | 13F | Mitchell Sinkler & Starr/pa | 2.625 | 0,00 | 328 | 9,36 | ||||
| 2025-07-31 | 13F | CVA Family Office, LLC | 8 | 1 | ||||||
| 2025-07-17 | 13F | Wolff Wiese Magana Llc | 5 | 1 | ||||||
| 2025-08-13 | 13F | Twin Peaks Wealth Advisors, LLC | 80 | 10 | ||||||
| 2025-08-13 | 13F | KilterHowling LLC | 2.126 | 0,33 | 265 | 7,72 | ||||
| 2025-08-06 | 13F | Golden State Wealth Management, LLC | 175 | 0,00 | 22 | 10,53 | ||||
| 2025-08-14 | 13F | Bank Of America Corp /de/ | 52.785 | 13,66 | 6.589 | 24,30 | ||||
| 2025-08-14 | 13F | Colony Group, LLC | 3.538 | 442 | ||||||
| 2025-08-26 | 13F/A | Thrivent Financial For Lutherans | 2.180 | 0 | ||||||
| 2025-07-11 | 13F | Caldwell Securities, Inc | 18 | 0,00 | 2 | 0,00 | ||||
| 2025-07-29 | 13F | Mattson Financial Services, LLC | 0 | -100,00 | 0 | |||||
| 2025-08-12 | 13F | MAI Capital Management | 657 | 42,83 | 82 | 57,69 | ||||
| 2025-08-12 | 13F | O'shaughnessy Asset Management, Llc | 0 | -100,00 | 0 | |||||
| 2025-08-04 | 13F | Bristlecone Advisors, LLC | 487 | 0,00 | 61 | 9,09 | ||||
| 2025-08-12 | 13F | Howe & Rusling Inc | 1.562 | 0,00 | 195 | 8,99 | ||||
| 2025-08-12 | 13F | Jpmorgan Chase & Co | 40.949 | -0,07 | 5.111 | 9,28 | ||||
| 2025-07-08 | 13F | Gradient Investments LLC | 6.312 | -19,44 | 788 | -11,97 | ||||
| 2025-07-31 | 13F | Buckingham Strategic Partners | 3.225 | 30,20 | 403 | 42,55 | ||||
| 2025-08-08 | 13F | SBI Securities Co., Ltd. | 108 | 0,00 | 13 | 8,33 | ||||
| 2025-08-12 | 13F | Wood Tarver Financial Group, LLC | 1.687 | 0,00 | 0 | -100,00 | ||||
| 2025-07-10 | 13F | Atticus Wealth Management, Llc | 886 | 0,34 | 111 | 10,00 | ||||
| 2025-08-14 | 13F | Abound Financial, Llc | 1.958 | -13,59 | 244 | -5,43 | ||||
| 2025-08-01 | 13F | Rossby Financial, LCC | 156 | 0,00 | 19 | 11,76 | ||||
| 2025-08-13 | 13F | Jones Financial Companies Lllp | 4.523 | 9,54 | 560 | 19,66 | ||||
| 2025-08-12 | 13F | Franklin Resources Inc | 210 | 0,00 | 26 | 13,04 | ||||
| 2025-08-04 | 13F | Assetmark, Inc | 2.421 | 302 | ||||||
| 2025-08-11 | 13F | Principal Securities, Inc. | 69 | 0,00 | 9 | 14,29 | ||||
| 2025-08-14 | 13F | Betterment LLC | 37.319 | 1,51 | 5 | 0,00 | ||||
| 2025-07-08 | 13F | Parallel Advisors, LLC | 11 | 1 | ||||||
| 2025-08-14 | 13F | Sei Investments Co | 6.501 | -3,89 | 811 | 5,05 | ||||
| 2025-08-14 | 13F | Guardian Wealth Advisors, Llc / Nc | 59 | 0,00 | 7 | 16,67 | ||||
| 2025-08-15 | 13F | Morgan Stanley | 95.528 | -1,67 | 11.924 | 7,54 | ||||
| 2025-07-18 | 13F/A | MJT & Associates Financial Advisory Group, Inc. | 1.062 | -15,91 | 133 | -8,33 | ||||
| 2025-07-11 | 13F | Farther Finance Advisors, LLC | 1 | 0,00 | 0 | |||||
| 2025-08-07 | 13F | Allworth Financial LP | 7 | -41,67 | 1 | -100,00 | ||||
| 2025-08-11 | 13F | HighTower Advisors, LLC | 2.202 | 0,00 | 275 | 9,16 | ||||
| 2025-05-05 | 13F | Lindbrook Capital, Llc | 250 | 0,00 | 29 | 0,00 | ||||
| 2025-07-17 | 13F | Albion Financial Group /ut | 35.429 | 0,39 | 4.422 | 9,81 | ||||
| 2025-07-29 | 13F | Mountain Capital Investment Advisors, Inc | 3.543 | -2,80 | 443 | 8,85 | ||||
| 2025-08-14 | 13F | Clifford Group, LLC | 1.675 | 209 | ||||||
| 2025-07-25 | 13F | Stephens Consulting, LLC | 1.542 | -24,49 | 192 | -17,60 | ||||
| 2025-08-05 | 13F | Huntington National Bank | 0 | |||||||
| 2025-08-12 | 13F | Ameritas Investment Partners, Inc. | 682 | 0,29 | 85 | 10,39 | ||||
| 2025-08-08 | 13F | TD Capital Management LLC | 191 | 0,53 | 24 | 9,52 | ||||
| 2025-08-12 | 13F | Global Retirement Partners, LLC | 22 | -38,89 | 3 | -50,00 | ||||
| 2025-08-29 | 13F | Centaurus Financial, Inc. | 864 | 0 | ||||||
| 2025-07-18 | 13F | PFG Investments, LLC | 2.371 | 0,21 | 296 | 9,26 | ||||
| 2025-07-22 | 13F | Berkshire Money Management, Inc. | 456 | 57 | ||||||
| 2025-05-15 | 13F | Tower Research Capital LLC (TRC) | 0 | -100,00 | 0 | |||||
| 2025-07-14 | 13F | Sowell Financial Services LLC | 2.421 | -6,63 | 302 | 2,37 | ||||
| 2025-08-13 | 13F | Northwestern Mutual Wealth Management Co | 1.289 | -8,97 | 161 | -0,62 | ||||
| 2025-08-14 | 13F | Wells Fargo & Company/mn | 11.872 | -12,47 | 1.482 | -4,33 | ||||
| 2025-08-12 | 13F | LPL Financial LLC | 115.068 | 5,79 | 14.363 | 15,69 | ||||
| 2025-07-10 | 13F | Wealth Enhancement Advisory Services, Llc | 5.283 | -0,36 | 666 | 9,92 | ||||
| 2025-08-08 | 13F | Creative Planning | 1.959 | 0,26 | 245 | 9,42 | ||||
| 2025-08-14 | 13F | Fmr Llc | 2.552 | 142,13 | 319 | 165,00 | ||||
| 2025-08-08 | 13F | Cetera Investment Advisers | 29.387 | 0,01 | 3.668 | 9,39 | ||||
| 2025-08-08 | 13F | Pnc Financial Services Group, Inc. | 282 | 0,00 | 35 | 9,38 | ||||
| 2025-08-14 | 13F | Federation des caisses Desjardins du Quebec | 115 | 0,00 | 14 | 7,69 | ||||
| 2025-08-04 | 13F | Simon Quick Advisors, Llc | 3.000 | 0,00 | 374 | 9,36 | ||||
| 2025-04-23 | 13F | Security National Bank | 0 | -100,00 | 0 | |||||
| 2025-08-14 | 13F | Citadel Advisors Llc | 0 | -100,00 | 0 | |||||
| 2025-08-14 | 13F | Royal Bank Of Canada | 12.296 | -15,37 | 1.535 | -7,42 | ||||
| 2025-08-14 | 13F | Susquehanna International Group, Llp | 11.107 | 52,32 | 1.386 | 66,59 | ||||
| 2025-07-29 | 13F | Sincerus Advisory, LLC | 1.587 | 201 | ||||||
| 2025-08-12 | 13F | Pathstone Holdings, LLC | 1.841 | 0,00 | 230 | 9,05 | ||||
| 2025-08-11 | 13F | Bell Investment Advisors, Inc | 6.663 | 0,41 | 832 | 9,78 | ||||
| 2025-05-13 | 13F | Rock Creek Group, LP | 0 | -100,00 | 0 | |||||
| 2025-07-25 | 13F | Cwm, Llc | 2.352 | -70,65 | 0 | |||||
| 2025-07-14 | 13F | Sentinel Pension Advisors Inc | 0 | -100,00 | 0 | |||||
| 2025-08-13 | 13F | Congress Wealth Management LLC / DE / | 5.049 | 14,18 | 630 | 25,00 | ||||
| 2025-08-14 | 13F | Raymond James Financial Inc | 10.314 | 16,89 | 1.287 | 27,81 | ||||
| 2025-08-14 | 13F | Glenmede Investment Management, LP | 92 | 11 | ||||||
| 2025-08-15 | 13F | Captrust Financial Advisors | 3.878 | 0,00 | 484 | 9,50 | ||||
| 2025-07-15 | 13F | Compagnie Lombard Odier SCmA | 0 | -100,00 | 0 | |||||
| 2025-07-11 | 13F | Grove Bank & Trust | 1.886 | 0,00 | 235 | 9,30 | ||||
| 2025-07-31 | 13F | Wealthfront Advisers Llc | 6.083 | 2,51 | 759 | 12,11 | ||||
| 2025-08-06 | 13F | AE Wealth Management LLC | 17 | 0,00 | 2 | 100,00 | ||||
| 2025-08-11 | 13F | Aptus Capital Advisors, LLC | 533 | 2,11 | 67 | 11,86 |
Other Listings
| MX:SHE |