Grundlæggende statistik
| Institutionelle ejere | 173 total, 173 long only, 0 short only, 0 long/short - change of 11,61% MRQ |
| Gennemsnitlig porteføljeallokering | 0.7436 % - change of 33,64% MRQ |
| Institutionelle aktier (lange) | 29.578.435 (ex 13D/G) - change of 5,90MM shares 24,92% MRQ |
| Institutionel værdi (lang) | $ 1.068.504 USD ($1000) |
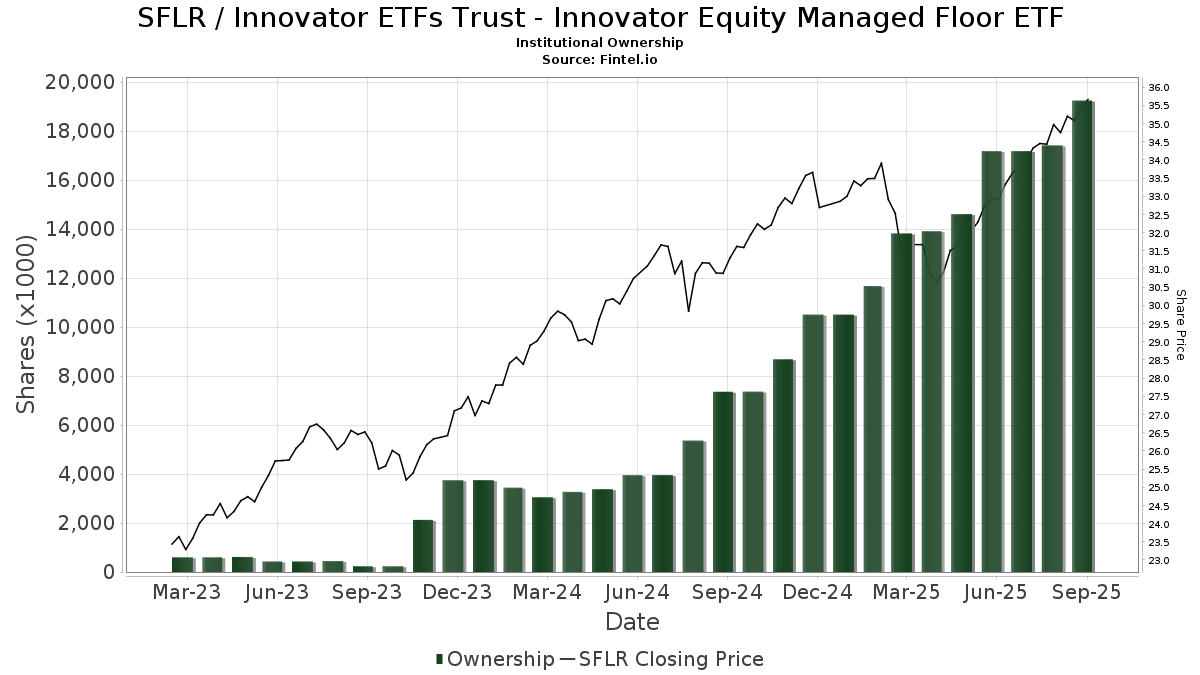
Institutionelt ejerskab og aktionærer
Innovator ETFs Trust - Innovator Equity Managed Floor ETF (US:SFLR) har 173 institutionelle ejere og aktionærer, der har indsendt 13D/G- eller 13F-formularer til Securities Exchange Commission (SEC). Disse institutioner har i alt 29,578,435 aktier. Største aktionærer omfatter Bank Of America Corp /de/, LPL Financial LLC, Commonwealth Equity Services, Llc, Kingsview Wealth Management, LLC, Chicago Partners Investment Group LLC, Delta Investment Management, LLC, Liberty Atlantic Advisors LLC, Advisor Group Holdings, Inc., Wetzel Investment Advisors, Inc., and Envestnet Asset Management Inc .
Innovator ETFs Trust - Innovator Equity Managed Floor ETF (ARCA:SFLR) institutionel ejerskabsstruktur viser aktuelle positioner i virksomheden efter institutioner og fonde, samt seneste ændringer i positionsstørrelse. Større aktionærer kan omfatte individuelle investorer, investeringsforeninger, hedgefonde eller institutioner. Skema 13D angiver, at investoren besidder (eller besidder) mere end 5 % af virksomheden og har til hensigt (eller har til hensigt at) aktivt at forfølge en ændring i forretningsstrategi. Skema 13G indikerer en passiv investering på over 5%.
The share price as of April 20, 2026 is 36,56 / share. Previously, on April 21, 2025, the share price was 30,25 / share. This represents an increase of 20,86% over that period.
Fondens stemningsscore
Fund Sentiment Score (fka Ownership Accumulation Score) finder de aktier, der bliver mest købt af fonde. Det er resultatet af en sofistikeret, multi-faktor kvantitativ model, der identificerer virksomheder med de højeste niveauer af institutionel akkumulering. Scoringsmodellen bruger en kombination af den samlede stigning i oplyste ejere, ændringerne i porteføljeallokeringer i disse ejere og andre målinger. Tallet går fra 0 til 100, hvor højere tal indikerer et højere niveau af akkumulering for sine jævnaldrende, og 50 er gennemsnittet.
Opdateringsfrekvens: Dagligt
Se Ownership Explorer, som giver en liste over højest rangerende virksomheder.
AI+ Ask Fintel’s AI assistant about Innovator ETFs Trust - Innovator Equity Managed Floor ETF.
Select a question to share a public post with an AI-crafted answer.
Thinking of good questions…
Institutionel Put/Call-forhold
Ud over at indberette standardaktie- og gældsudstedelser skal institutter med mere end 100 mill. aktiver under forvaltning også oplyse deres put- og call-optionsbeholdninger. Da salgsoptioner generelt indikerer negativ stemning, og købsoptioner indikerer positiv stemning, kan vi få en fornemmelse af den overordnede institutionelle stemning ved at plotte forholdet mellem put og kald. Diagrammet til højre viser det historiske put/call-forhold for dette instrument.
Brug af Put/Call Ratio som en indikator for investorernes stemning overvinder en af de vigtigste mangler ved at bruge totalt institutionelt ejerskab, som er, at en betydelig mængde af aktiver under forvaltning investeres passivt for at spore indekser. Passivt forvaltede fonde køber typisk ikke optioner, så indikatoren for put/call-forholdet følger mere nøje følelsen af aktivt forvaltede fonde.
13F og NPORT arkivering
Detaljer om 13F-arkivering er gratis. Detaljer om NP-ansøgninger kræver et premium-medlemskab. Grønne rækker angiver nye positioner. Røde rækker angiver lukkede positioner. Klik på linket ikon for at se den fulde transaktionshistorik.
Opgrader
for at låse premium-data op og eksportere til Excel ![]() .
.
| Fil dato | Kilde | Investor | Type | Gennemsnitlig pris (Øst) |
Aktier | Δ Aktier (%) |
Rapporteret Værdi ($1000) |
Δ Værdi (%) |
Port Alloc (%) |
|
|---|---|---|---|---|---|---|---|---|---|---|
| 2026-04-15 | 13F | Occidental Asset Management, LLC | 19.430 | 96,76 | 688 | 89,53 | ||||
| 2026-02-11 | 13F | Gateway Wealth Partners, LLC | 13.053 | 22,61 | 481 | 25,59 | ||||
| 2026-02-11 | 13F | Gilpin Wealth Management, Llc | 2.470 | 91 | ||||||
| 2026-02-13 | 13F | Beacon Financial Advisory LLC | 73.593 | 7,77 | 2.713 | 10,24 | ||||
| 2026-02-14 | 13F | Whipplewood Advisors, LLC | 53.268 | 6,39 | 1.963 | 8,81 | ||||
| 2026-02-05 | 13F | Northwestern Mutual Wealth Management Co | 81.483 | 125.258,46 | 7.894 | 394.600,00 | ||||
| 2026-01-20 | 13F | Savvy Advisors, Inc. | 9.889 | 365 | ||||||
| 2026-02-10 | 13F | Sentinus, LLC | 370.693 | 34,91 | 13.664 | 38,02 | ||||
| 2026-02-05 | 13F | Allworth Financial LP | 2.125 | 0,00 | 78 | 2,63 | ||||
| 2026-04-14 | 13F | Southland Equity Partners LLC | 313.667 | -7,42 | 11.107 | -11,07 | ||||
| 2026-02-10 | 13F | Advisor Resource Council | 69.556 | -6,00 | 2.564 | -3,86 | ||||
| 2026-02-09 | 13F | Atticus Wealth Management, Llc | 10.640 | 392 | ||||||
| 2026-02-19 | 13F | ATX Financial Planning, LLC | 205.526 | 7.576 | ||||||
| 2026-02-17 | 13F | Core Wealth Advisors, Inc. | 24.147 | 890 | ||||||
| 2026-01-22 | 13F | Yarger Wealth Strategies, Llc | 9.009 | 0,09 | 332 | 2,47 | ||||
| 2025-11-14 | 13F | Jane Street Group, Llc | 0 | -100,00 | 0 | |||||
| 2026-02-17 | 13F | Cape Investment Advisory, Inc. | 301 | 11 | ||||||
| 2026-02-18 | 13F | GWM Advisors LLC | 129.287 | -4,68 | 4.766 | -2,48 | ||||
| 2026-04-20 | 13F | Kestra Private Wealth Services, Llc | 12.969 | 0,06 | 459 | -3,77 | ||||
| 2026-02-13 | 13F | SRS Capital Advisors, Inc. | 24.039 | 886 | ||||||
| 2026-04-14 | 13F | Well Done, LLC | 23.993 | 89,31 | 850 | 81,80 | ||||
| 2026-04-01 | 13F | Beacon Financial Group | 117.631 | 0,59 | 4.336 | 2,90 | ||||
| 2026-02-10 | 13F | Evolution Wealth Management Inc. | 243.145 | -2,12 | 8.962 | 0,13 | ||||
| 2026-02-12 | 13F | Summit Financial, LLC | 0 | -100,00 | 0 | |||||
| 2026-02-17 | 13F | Equitable Holdings, Inc. | 7.560 | 14,37 | 279 | 16,81 | ||||
| 2026-01-29 | 13F | UBS Group AG | 500 | 18 | ||||||
| 2026-02-09 | 13F | Hartland & Co., LLC | 25.398 | 108,59 | 936 | 113,70 | ||||
| 2026-01-26 | 13F | Keystone Wealth Services, LLC | 9.822 | -3,91 | 362 | -1,63 | ||||
| 2026-02-04 | 13F | BCJ Capital Management, LLC | 120.655 | -7,78 | 4.447 | -5,64 | ||||
| 2026-04-16 | 13F | Southern Capital Advisors, Llc | 16.618 | -0,14 | 588 | -4,08 | ||||
| 2026-02-13 | 13F | Golden State Wealth Management, LLC | 12.278 | 5,25 | 453 | 7,62 | ||||
| 2026-02-13 | 13F | Centaurus Financial, Inc. | 6.991 | 1,04 | 0 | |||||
| 2026-02-09 | 13F | Keating Financial Advisory Services, Inc. | 2.445 | 90 | ||||||
| 2026-01-08 | 13F | Sound View Wealth Advisors Group, LLC | 5.978 | -7,82 | 220 | -5,58 | ||||
| 2026-02-17 | 13F | Susquehanna International Group, Llp | 13.897 | -53,84 | 512 | -52,77 | ||||
| 2026-04-16 | 13F | Tortuga Wealth Management, Inc | 8.830 | 326 | ||||||
| 2026-02-10 | 13F | Envestnet Asset Management Inc | 406.276 | -7,81 | 14.975 | -5,69 | ||||
| 2026-01-12 | 13F | Castleview Partners, Llc | 25.654 | -6,45 | 946 | -4,35 | ||||
| 2026-04-13 | 13F | Garrett Investment Advisors LLC | 31.429 | 18,69 | 1.113 | 13,93 | ||||
| 2026-02-05 | 13F | Cambridge Investment Research Advisors, Inc. | 108.827 | 4,69 | 4 | 33,33 | ||||
| 2026-02-18 | 13F/A | Virtue Capital Management, LLC | 9.652 | 356 | ||||||
| 2026-04-09 | 13F | CRA Financial Services, LLC | 11.770 | -6,10 | 417 | -9,96 | ||||
| 2026-02-12 | 13F | Concorde Asset Management, LLC | 87.680 | 0,70 | 3.232 | 2,80 | ||||
| 2025-11-10 | 13F | Siligmueller & Norvid Wealth Advisors LLC | 131.037 | 4.721 | ||||||
| 2026-04-08 | 13F | Red Reef Advisors Llc | 40.355 | 1.487 | ||||||
| 2026-01-28 | 13F | Leelyn Smith, LLC | 8.784 | -7,24 | 324 | -5,28 | ||||
| 2026-02-13 | 13F | Johnson Investment Counsel Inc | 6.630 | 0,00 | 244 | 2,52 | ||||
| 2026-04-08 | 13F | Selby Wealth Management, LLC | 62.501 | -0,81 | 2.213 | -4,69 | ||||
| 2025-11-14 | 13F | Citadel Advisors Llc | 0 | -100,00 | 0 | |||||
| 2026-02-06 | 13F | Eqis Capital Management, Inc. | 14.546 | -16,89 | 536 | -14,92 | ||||
| 2026-04-17 | 13F | Worth Asset Management, LLC | 10.547 | -0,94 | 373 | -4,85 | ||||
| 2026-04-07 | 13F | CoreCap Advisors, LLC | 13.081 | 3,46 | 463 | -0,64 | ||||
| 2026-01-23 | 13F | Assetmark, Inc | 175 | 0,00 | 6 | 0,00 | ||||
| 2026-02-17 | 13F | Advisory Services Network, LLC | 273.117 | 2.450,35 | 10.067 | 2.514,81 | ||||
| 2026-02-03 | 13F | Foronjy Financial Llc | 14.749 | 75,37 | 544 | 79,21 | ||||
| 2026-04-08 | 13F | Holos Integrated Wealth LLC | 116.027 | 7,49 | 4.155 | 4,24 | ||||
| 2026-04-13 | 13F | IFP Advisors, Inc | 2.160 | 8,54 | 76 | 4,11 | ||||
| 2026-02-11 | 13F | Gwn Securities Inc. | 64.939 | 26,95 | 2.394 | 29,84 | ||||
| 2026-02-13 | 13F | Lifeworks Advisors, LLC | 37.414 | 17,11 | 1.379 | 19,81 | ||||
| 2026-01-12 | 13F | DAVENPORT & Co LLC | 0 | -100,00 | 0 | |||||
| 2026-02-13 | 13F | Jacobi Capital Management LLC | 21.277 | 0,09 | 784 | 2,48 | ||||
| 2025-10-30 | 13F | Simplicity Wealth,LLC | 0 | -100,00 | 0 | -100,00 | ||||
| 2026-01-30 | 13F | Sigma Planning Corp | 18.686 | 0,30 | 689 | 2,53 | ||||
| 2026-04-16 | 13F | Brookstone Capital Management | 403.720 | 42,16 | 14.296 | 36,56 | ||||
| 2025-11-14 | 13F | Rps Advisory Solutions Llc | 0 | -100,00 | 0 | |||||
| 2026-02-04 | 13F | Ameritas Advisory Services, LLC | 47.375 | 1.746 | ||||||
| 2026-02-05 | 13F | Disciplined Investments, LLC | 8.832 | 326 | ||||||
| 2026-02-17 | 13F | Quantinno Capital Management LP | 15.734 | 153,61 | 580 | 159,64 | ||||
| 2026-02-05 | 13F | Western Wealth Management, LLC | 14.615 | 22,03 | 539 | 24,83 | ||||
| 2026-02-10 | 13F | WCG Wealth Advisors LLC | 15.498 | 571 | ||||||
| 2026-02-11 | 13F | Winnow Wealth Llc | 261.279 | 3,37 | 9.667 | 3,37 | ||||
| 2026-04-07 | 13F | Signaturefd, Llc | 52.845 | -2,69 | 1.871 | -6,50 | ||||
| 2026-02-17 | 13F | First Commonwealth Financial Corp /pa/ | 186.192 | 1,42 | 6.863 | 3,76 | ||||
| 2026-04-15 | 13F | Seacrest Wealth Management, Llc | 36.069 | -1,53 | 1.277 | -6,31 | ||||
| 2026-01-22 | 13F | Ifrah Financial Services, Inc. | 21.413 | 9,77 | 789 | 12,39 | ||||
| 2026-01-26 | 13F | AE Wealth Management LLC | 194.675 | 3,51 | 7.176 | 5,89 | ||||
| 2026-04-15 | 13F | Bright Futures Wealth Management, LLC. | 33.460 | 1.185 | ||||||
| 2026-02-09 | 13F | Kingsview Wealth Management, LLC | 1.886.697 | 7,17 | 69.544 | 9,64 | ||||
| 2026-02-06 | 13F | Americana Partners, LLC | 260.323 | 9.596 | ||||||
| 2026-02-17 | 13F | Jones Financial Companies Lllp | 269 | -83,60 | 10 | -84,48 | ||||
| 2026-02-06 | 13F | HighTower Advisors, LLC | 335.256 | -0,86 | 12.358 | 1,43 | ||||
| 2026-02-03 | 13F | Sequoia Financial Advisors, LLC | 38.197 | 0,00 | 1.408 | 2,25 | ||||
| 2026-02-09 | 13F | Harbour Investments, Inc. | 110.485 | 9,78 | 4.072 | 12,30 | ||||
| 2026-02-11 | 13F | Buckingham Strategic Partners | 15.700 | 579 | ||||||
| 2026-04-13 | 13F | Creative Financial Designs Inc /adv | 3.000 | 106 | ||||||
| 2026-01-29 | 13F | Concurrent Investment Advisors, LLC | 128.850 | 118,15 | 4.749 | 123,17 | ||||
| 2026-04-15 | 13F | Milestone Asset Management, Llc | 59.634 | -0,51 | 2.112 | -4,44 | ||||
| 2026-01-26 | 13F | WorthPointe, LLC | 49.608 | 99,47 | 1.829 | 104,02 | ||||
| 2026-04-10 | 13F | Sar Wealth Management Group, Llc | 21.926 | 0,06 | 776 | -3,84 | ||||
| 2026-02-17 | 13F | Bank Of America Corp /de/ | 5.848.799 | 49,21 | 215.587 | 52,64 | ||||
| 2026-01-30 | 13F | Delta Investment Management, LLC | 585.103 | -31,98 | 21.567 | -30,42 | ||||
| 2026-04-08 | 13F | Ccg Wealth Management, Llc | 255.746 | 457,04 | 9.064 | 435,64 | ||||
| 2026-02-06 | 13F | Global Retirement Partners, LLC | 172.911 | 10,48 | 6.373 | 13,02 | ||||
| 2026-02-11 | 13F | O'shaughnessy Asset Management, Llc | 128 | -63,11 | 5 | -66,67 | ||||
| 2026-02-02 | 13F | Mutual Advisors, LLC | 62.685 | 13,57 | 2.311 | 15,27 | ||||
| 2026-01-05 | 13F | Noble Wealth Management PBC | 0 | -100,00 | 0 | -100,00 | ||||
| 2026-02-13 | 13F | Aptus Capital Advisors, LLC | 29.006 | 68.961,90 | 1.069 | 106.800,00 | ||||
| 2026-01-20 | 13F | Stratos Wealth Partners, LTD. | 117.980 | 9,68 | 4.349 | 12,21 | ||||
| 2026-02-05 | 13F | IMG Wealth Management, Inc. | 18.699 | 689 | ||||||
| 2026-04-17 | 13F | Signal Advisors Wealth, LLC | 74.901 | 10,99 | 2.652 | 6,63 | ||||
| 2026-02-06 | 13F | Authentikos Wealth Advisory, LLC | 207.484 | -4,13 | 7.648 | -1,92 | ||||
| 2026-02-12 | 13F | Compass Capital Corp /ma/ /adv | 161.569 | 6.001 | ||||||
| 2026-04-15 | 13F | Diligent Investors, LLC | 12.475 | -0,12 | 442 | -4,13 | ||||
| 2026-02-13 | 13F | Glen Eagle Advisors, LLC | 35.100 | 4,14 | 1.294 | 6,51 | ||||
| 2026-02-17 | 13F | Old Mission Capital Llc | 0 | -100,00 | 0 | |||||
| 2026-02-03 | 13F | Liberty Atlantic Advisors LLC | 555.375 | 20.483 | ||||||
| 2026-04-15 | 13F | Archford Capital Strategies, LLC | 21.829 | -6,94 | 773 | -10,65 | ||||
| 2026-04-16 | 13F | Ballast Rock Private Wealth LLC | 50.337 | 26,75 | 1.784 | 21,79 | ||||
| 2026-01-21 | 13F | Flagship Harbor Advisors, Llc | 63.888 | 16,89 | 2.355 | 19,55 | ||||
| 2026-02-10 | 13F | COFG Advisors, LLC | 132.904 | 4.899 | ||||||
| 2026-01-22 | 13F | Wetzel Investment Advisors, Inc. | 436.484 | 5,69 | 16.098 | 8,10 | ||||
| 2026-02-13 | 13F | Change Path, LLC | 34.285 | 1.264 | ||||||
| 2026-02-17 | 13F | Private Advisor Group, LLC | 192.308 | 21,83 | 7.088 | 24,64 | ||||
| 2026-02-13 | 13F | Visionary Wealth Advisors | 149.562 | 77,37 | 5.513 | 81,44 | ||||
| 2026-01-23 | 13F | Smith, Moore & Co. | 8.533 | 0,00 | 315 | 2,28 | ||||
| 2026-04-13 | 13F | John W. Brooker & Co., CPAs | 11.329 | -4,15 | 401 | -7,82 | ||||
| 2026-02-13 | 13F | Luminist Capital LLC | 359 | -98,99 | 13 | -98,99 | ||||
| 2026-01-30 | 13F | Secured Retirement Advisors, Llc | 27.472 | -10,64 | 1.013 | -8,58 | ||||
| 2026-04-10 | 13F | Perigon Wealth Management, LLC | 0 | -100,00 | 0 | |||||
| 2026-04-07 | 13F | Farther Finance Advisors, LLC | 232.287 | 40,66 | 8.295 | 36,26 | ||||
| 2026-01-29 | 13F | Dunhill Financial, LLC | 382 | 0,00 | 14 | 7,69 | ||||
| 2025-11-14 | 13F | City National Bank Of Florida /msd | 0 | -100,00 | 0 | |||||
| 2026-01-16 | 13F | HFG Wealth Management, LLC | 172.485 | 0,33 | 6.358 | 2,63 | ||||
| 2026-02-11 | 13F | LPL Financial LLC | 4.257.434 | 16,46 | 156.929 | 19,15 | ||||
| 2026-01-14 | 13F | Kraft, Davis & Associates, LLC | 43.610 | -3,98 | 1.628 | -1,15 | ||||
| 2026-01-29 | 13F | Comerica Bank | 3.878 | 0,00 | 143 | 2,16 | ||||
| 2026-02-17 | 13F | Raymond James Financial Inc | 205.597 | 191,63 | 7.578 | 198,35 | ||||
| 2026-04-14 | 13F | William Mack & Associates, Inc. | 0 | -100,00 | 0 | |||||
| 2026-02-17 | 13F | IHT Wealth Management, LLC | 84.616 | 6,87 | 3.127 | 8,92 | ||||
| 2026-02-11 | 13F | Wealthgarden F.s. Llc | 10.468 | 0,00 | 389 | 2,37 | ||||
| 2026-02-12 | 13F | Steward Partners Investment Advisory, Llc | 152.898 | -20,27 | 5.636 | -18,44 | ||||
| 2026-02-05 | 13F | Thrivent Financial For Lutherans | 212.824 | 76,48 | 8 | 75,00 | ||||
| 2026-02-17 | 13F | VestGen Advisors, LLC | 12.086 | -39,40 | 445 | -38,02 | ||||
| 2026-02-17 | 13F | Snowden Capital Advisors LLC | 149.869 | 5.524 | ||||||
| 2026-01-22 | 13F | Columbia Advisory Partners Llc | 73.268 | 80,37 | 2.701 | 84,55 | ||||
| 2026-01-16 | 13F | Worth Financial Advisory Group, LLC | 153.961 | -6,39 | 5.675 | -4,24 | ||||
| 2026-02-17 | 13F | Perennial Investment Advisors, LLC | 173.594 | 23,48 | 6.399 | 26,32 | ||||
| 2026-02-17 | 13F | Mpwm Advisory Solutions, Llc | 26.249 | -82,49 | 968 | -82,09 | ||||
| 2025-11-03 | 13F | TD Waterhouse Canada Inc. | 0 | -100,00 | 0 | |||||
| 2026-02-12 | 13F | Wedbush Securities Inc | 6.800 | -6,04 | 0 | |||||
| 2026-04-15 | 13F | Cypress Wealth Services, LLC | 9.881 | 10,58 | 350 | 6,08 | ||||
| 2026-01-27 | 13F | Belpointe Asset Management LLC | 9.590 | 5,66 | 354 | 7,95 | ||||
| 2026-04-20 | 13F | Balance Wealth, LLC | 49.941 | -15,90 | 1.768 | -19,20 | ||||
| 2026-04-07 | 13F | SMI Advisory Services, LLC | 7.857 | -40,50 | 281 | -43,00 | ||||
| 2026-01-14 | 13F | Pallas Capital Advisors LLC | 255.855 | 1,24 | 9.431 | 3,57 | ||||
| 2026-02-04 | 13F | Meridian Wealth Management, LLC | 46.450 | 51,33 | 1.712 | 54,93 | ||||
| 2026-01-20 | 13F | C2P Capital Advisory Group, LLC d.b.a. Prosperity Capital Advisors | 0 | -100,00 | 0 | |||||
| 2026-04-06 | 13F | Old Port Advisors | 9.245 | 0,00 | 327 | -3,82 | ||||
| 2026-01-07 | 13F | Sagespring Wealth Partners, Llc | 30.085 | 37,80 | 1.109 | 40,97 | ||||
| 2026-04-08 | 13F | Wealth Enhancement Advisory Services, Llc | 116.747 | -0,32 | 4.167 | -4,49 | ||||
| 2026-04-15 | 13F | Exchange Traded Concepts, Llc | 0 | -100,00 | 0 | |||||
| 2026-02-12 | 13F | Commonwealth Equity Services, Llc | 1.928.409 | 6,61 | 71.081 | 109.255,38 | ||||
| 2026-02-20 | 13F | Sunbelt Securities, Inc. | 8.475 | 0,00 | 312 | 2,30 | ||||
| 2026-04-13 | 13F | Fiduciary Financial Group, Llc | 5.918 | -20,03 | 210 | -23,16 | ||||
| 2026-02-11 | 13F | Janney Montgomery Scott LLC | 122.151 | 22,67 | 5 | 33,33 | ||||
| 2026-02-10 | 13F | Foundations Investment Advisors, LLC | 75.295 | 77,18 | 2.775 | 81,25 | ||||
| 2026-02-12 | 13F | Benson Wealth Management INC | 2.773 | 102 | ||||||
| 2026-01-26 | 13F | Valmark Advisers, Inc. | 6.275 | -8,73 | 231 | -6,48 | ||||
| 2026-02-13 | 13F | Mml Investors Services, Llc | 239.019 | 12,39 | 8.810 | 14,98 | ||||
| 2026-02-10 | 13F | Hazlett, Burt & Watson, Inc. | 3.604 | -18,42 | 0 | |||||
| 2026-01-23 | 13F | Financial Futures Ltd Liability Co. | 14.633 | -40,60 | 539 | -39,23 | ||||
| 2026-01-28 | 13F | Chicago Partners Investment Group LLC | 1.356.567 | -2,12 | 50.166 | -1,45 | ||||
| 2026-02-17 | 13F | Cetera Investment Advisers | 286.692 | 21,41 | 10.567 | 24,22 | ||||
| 2026-04-17 | 13F | BCS Wealth Management | 0 | -100,00 | 0 | |||||
| 2026-01-08 | 13F | Gradient Investments LLC | 0 | -100,00 | 0 | |||||
| 2026-04-14 | 13F | Pinnacle Wealth Management Group, Inc. | 244.025 | 46,64 | 8.641 | 40,85 | ||||
| 2025-10-21 | 13F | SILVER OAK SECURITIES, Inc | 0 | -100,00 | 0 | |||||
| 2026-02-17 | 13F | SageView Advisory Group, LLC | 1.217 | 45 | ||||||
| 2026-02-12 | 13F | Triumph Capital Management | 180.962 | 49,32 | 6.670 | 52,77 | ||||
| 2026-02-06 | 13F | GPS Wealth Strategies Group, LLC | 0 | -100,00 | 0 | |||||
| 2026-02-13 | 13F | Kestra Advisory Services, LLC | 0 | -100,00 | 0 | |||||
| 2026-04-14 | 13F | Davies Financial Advisors, Inc. | 34.447 | -60,08 | 1.220 | -61,67 | ||||
| 2026-02-14 | 13F | Rockefeller Capital Management L.P. | 175.217 | 6.484 | ||||||
| 2026-02-02 | 13F | Truist Financial Corp | 42.312 | 23,95 | 1.560 | 26,85 | ||||
| 2026-02-05 | 13F | WealthPlan Investment Management, LLC | 12.910 | 0,09 | 476 | 2,37 | ||||
| 2026-01-23 | 13F | HBW Advisory Services LLC | 34.389 | -5,70 | 1.268 | -3,50 | ||||
| 2026-02-13 | 13F | Morgan Stanley | 1.768 | 0,06 | 65 | 3,17 | ||||
| 2026-01-20 | 13F | Sovran Advisors, LLC | 11.352 | -7,10 | 423 | -5,80 | ||||
| 2026-04-15 | 13F | Merit Financial Group, LLC | 7.205 | 6,52 | 255 | 2,41 | ||||
| 2026-02-05 | 13F | Stephens Inc /ar/ | 161.610 | 5,62 | 5.957 | 8,04 | ||||
| 2026-01-26 | 13F | Cwm, Llc | 175.179 | 265,20 | 6 | 500,00 | ||||
| 2026-04-14 | 13F | Wealthcare Advisory Partners LLC | 9.540 | 61,39 | 338 | 55,30 | ||||
| 2026-01-26 | 13F | Private Trust Co Na | 4.119 | 23,25 | 152 | 25,83 | ||||
| 2026-04-08 | 13F | First Heartland Consultants, Inc. | 6.167 | 8,82 | 218 | 4,81 | ||||
| 2026-02-04 | 13F | Pensionmark Financial Group, Llc | 22.272 | -2,01 | 812 | -0,73 | ||||
| 2025-11-07 | 13F | Axxcess Wealth Management, Llc | 0 | -100,00 | 0 | |||||
| 2026-01-23 | 13F | Kellett Schaffner Wealth Advisors LLC | 54.227 | 0,64 | 1.999 | 2,94 | ||||
| 2025-11-06 | 13F | LexAurum Advisors, LLC | 0 | -100,00 | 0 | |||||
| 2026-02-17 | 13F | Claro Advisors LLC | 28.204 | -1,56 | 1.040 | 0,68 | ||||
| 2026-02-13 | 13F | Mariner, LLC | 63.562 | 15,00 | 2.343 | 17,63 | ||||
| 2026-02-10 | 13F | NewCorp Financial Services, Inc. | 196.175 | 7.231 | ||||||
| 2026-02-17 | 13F | Advisor Group Holdings, Inc. | 495.459 | -12,62 | 18.265 | -9,52 | ||||
| 2026-04-20 | 13F | Kfg Wealth Management, Llc | 10.795 | 382 | ||||||
| 2026-02-05 | 13F | Cornerstone Wealth Management, LLC | 20.452 | 227,23 | 754 | 234,67 |