Grundlæggende statistik
| Institutionelle ejere | 214 total, 214 long only, 0 short only, 0 long/short - change of 0,00% MRQ |
| Gennemsnitlig porteføljeallokering | 0.0975 % - change of -28,50% MRQ |
| Institutionelle aktier (lange) | 5.215.846 (ex 13D/G) - change of -1,52MM shares -22,52% MRQ |
| Institutionel værdi (lang) | $ 297.323 USD ($1000) |
Institutionelt ejerskab og aktionærer
Exchange Traded Concepts Trust - ROBO Global Robotics and Automation Index ETF (US:ROBO) har 214 institutionelle ejere og aktionærer, der har indsendt 13D/G- eller 13F-formularer til Securities Exchange Commission (SEC). Disse institutioner har i alt 5,215,846 aktier. Største aktionærer omfatter UBS Group AG, Morgan Stanley, LPL Financial LLC, Fountainhead AM, LLC, Gray Foundation, Raymond James Financial Inc, Biltmore Family Office, LLC, CI Private Wealth, LLC, Royal Bank Of Canada, and Ameriprise Financial Inc .
Exchange Traded Concepts Trust - ROBO Global Robotics and Automation Index ETF (ARCA:ROBO) institutionel ejerskabsstruktur viser aktuelle positioner i virksomheden efter institutioner og fonde, samt seneste ændringer i positionsstørrelse. Større aktionærer kan omfatte individuelle investorer, investeringsforeninger, hedgefonde eller institutioner. Skema 13D angiver, at investoren besidder (eller besidder) mere end 5 % af virksomheden og har til hensigt (eller har til hensigt at) aktivt at forfølge en ændring i forretningsstrategi. Skema 13G indikerer en passiv investering på over 5%.
The share price as of September 15, 2025 is 65,29 / share. Previously, on September 16, 2024, the share price was 54,20 / share. This represents an increase of 20,46% over that period.

Fondens stemningsscore
Fund Sentiment Score (fka Ownership Accumulation Score) finder de aktier, der bliver mest købt af fonde. Det er resultatet af en sofistikeret, multi-faktor kvantitativ model, der identificerer virksomheder med de højeste niveauer af institutionel akkumulering. Scoringsmodellen bruger en kombination af den samlede stigning i oplyste ejere, ændringerne i porteføljeallokeringer i disse ejere og andre målinger. Tallet går fra 0 til 100, hvor højere tal indikerer et højere niveau af akkumulering for sine jævnaldrende, og 50 er gennemsnittet.
Opdateringsfrekvens: Dagligt
Se Ownership Explorer, som giver en liste over højest rangerende virksomheder.
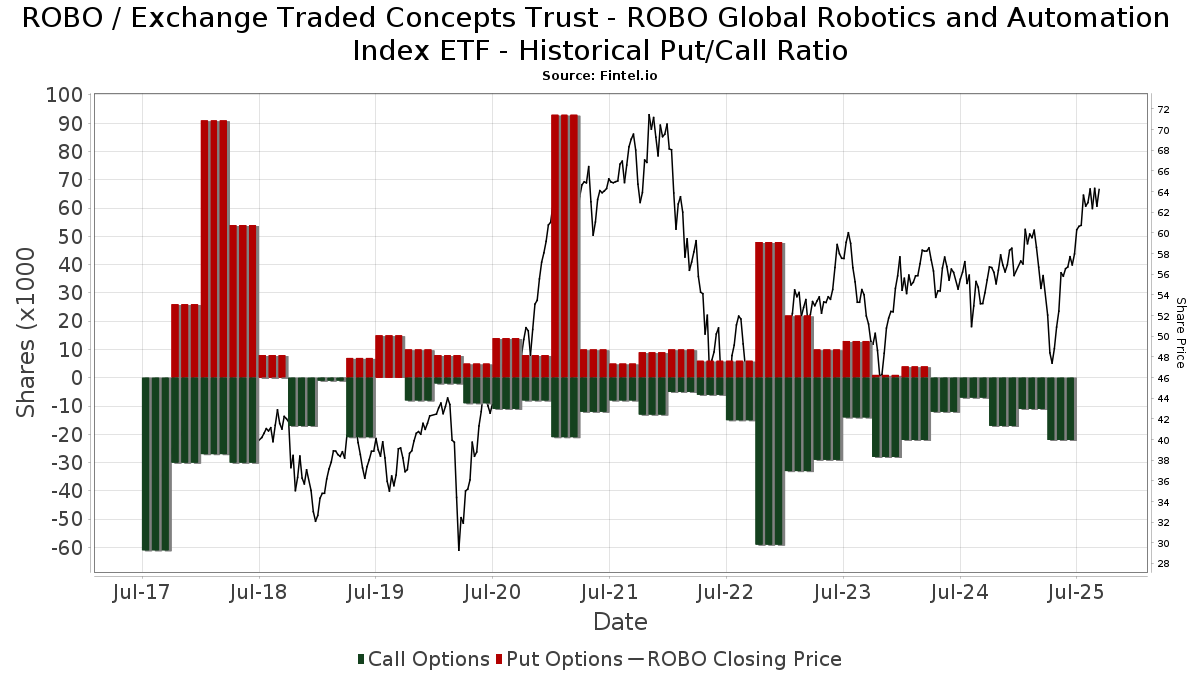
Institutionel Put/Call-forhold
Ud over at indberette standardaktie- og gældsudstedelser skal institutter med mere end 100 mill. aktiver under forvaltning også oplyse deres put- og call-optionsbeholdninger. Da salgsoptioner generelt indikerer negativ stemning, og købsoptioner indikerer positiv stemning, kan vi få en fornemmelse af den overordnede institutionelle stemning ved at plotte forholdet mellem put og kald. Diagrammet til højre viser det historiske put/call-forhold for dette instrument.
Brug af Put/Call Ratio som en indikator for investorernes stemning overvinder en af de vigtigste mangler ved at bruge totalt institutionelt ejerskab, som er, at en betydelig mængde af aktiver under forvaltning investeres passivt for at spore indekser. Passivt forvaltede fonde køber typisk ikke optioner, så indikatoren for put/call-forholdet følger mere nøje følelsen af aktivt forvaltede fonde.
13F og NPORT arkivering
Detaljer om 13F-arkivering er gratis. Detaljer om NP-ansøgninger kræver et premium-medlemskab. Grønne rækker angiver nye positioner. Røde rækker angiver lukkede positioner. Klik på linket ikon for at se den fulde transaktionshistorik.
Opgrader
for at låse premium-data op og eksportere til Excel ![]() .
.
| Fil dato | Kilde | Investor | Type | Gennemsnitlig pris (Øst) |
Aktier | Δ Aktier (%) |
Rapporteret Værdi ($1000) |
Δ Værdi (%) |
Port Alloc (%) |
|
|---|---|---|---|---|---|---|---|---|---|---|
| 2025-08-12 | 13F | Kimelman & Baird, LLC | 401 | 0,00 | 24 | 15,00 | ||||
| 2025-08-14 | 13F | Jane Street Group, Llc | 45.652 | 250,87 | 2.729 | 307,31 | ||||
| 2025-04-23 | 13F | Spirepoint Private Client, Llc | 0 | -100,00 | 0 | |||||
| 2025-05-09 | 13F | Sfmg, Llc | 0 | -100,00 | 0 | |||||
| 2025-08-14 | 13F | First Foundation Advisors | 5.211 | 0,00 | 312 | 16,04 | ||||
| 2025-08-04 | 13F | Creative Financial Designs Inc /adv | 5 | 0,00 | 0 | |||||
| 2025-04-15 | 13F | Noble Wealth Management PBC | 680 | 106,06 | 35 | 94,44 | ||||
| 2025-08-14 | 13F | Wells Fargo & Company/mn | 5.133 | -14,68 | 307 | -0,97 | ||||
| 2025-08-05 | 13F | Crestwood Advisors Group LLC | 59.037 | -4,40 | 3.529 | 10,97 | ||||
| 2025-05-05 | 13F | Migdal Insurance & Financial Holdings Ltd. | 0 | -100,00 | 0 | |||||
| 2025-08-14 | 13F | Stifel Financial Corp | 29.691 | 17,58 | 1.775 | 36,46 | ||||
| 2025-08-12 | 13F | Park Square Financial Group, LLC | 270 | -15,36 | 16 | 0,00 | ||||
| 2025-08-13 | 13F | Cresset Asset Management, LLC | 4.382 | 5,18 | 262 | 22,43 | ||||
| 2025-08-11 | 13F | Western Wealth Management, LLC | 3.363 | 201 | ||||||
| 2025-04-01 | 13F | Modus Advisors, LLC | 0 | -100,00 | 0 | |||||
| 2025-08-08 | 13F | Pnc Financial Services Group, Inc. | 2.500 | -26,32 | 149 | -14,37 | ||||
| 2025-08-14 | 13F | Royal Bank Of Canada | 155.563 | 0,23 | 9.299 | 16,34 | ||||
| 2025-07-14 | 13F | CHICAGO TRUST Co NA | 5.300 | 0,00 | 317 | 16,18 | ||||
| 2025-08-14 | 13F | Raymond James Financial Inc | 203.455 | -3,25 | 12.163 | 12,31 | ||||
| 2025-07-21 | 13F | Ntv Asset Management Llc | 89.160 | -1,92 | 5.330 | 13,84 | ||||
| 2025-07-31 | 13F/A | Avion Wealth | 169 | 0 | ||||||
| 2025-08-26 | 13F/A | Thrivent Financial For Lutherans | 0 | -100,00 | 0 | |||||
| 2025-08-18 | 13F | Geneos Wealth Management Inc. | 21.225 | 0,00 | 1.269 | 16,01 | ||||
| 2025-08-12 | 13F | Steward Partners Investment Advisory, Llc | 2.628 | 0,00 | 157 | 16,30 | ||||
| 2025-08-08 | 13F | SBI Securities Co., Ltd. | 776 | 4,86 | 46 | 21,05 | ||||
| 2025-05-07 | 13F | Hallmark Capital Management Inc | 0 | -100,00 | 0 | -100,00 | ||||
| 2025-07-16 | 13F | Brown, Lisle/cummings, Inc. | 117 | 0,00 | 7 | 0,00 | ||||
| 2025-08-14 | 13F | Bnp Paribas Arbitrage, Sa | 0 | -100,00 | 0 | |||||
| 2025-08-11 | 13F | Synergy Investment Management, LLC | 0 | -100,00 | 0 | |||||
| 2025-07-08 | 13F | Quintet Private Bank (Europe) S.A. | 600 | 0,00 | 36 | 16,67 | ||||
| 2025-08-12 | 13F | Aspiring Ventures, LLC | 7.500 | 0,00 | 448 | 13,99 | ||||
| 2025-07-23 | 13F | Joel Isaacson & Co., LLC | 9.401 | 0,00 | 562 | 15,91 | ||||
| 2025-07-30 | 13F | Evermay Wealth Management Llc | 1.010 | 0,00 | 60 | 15,38 | ||||
| 2025-07-31 | 13F | Oppenheimer & Co Inc | 10.556 | 3,48 | 631 | 20,19 | ||||
| 2025-07-25 | 13F | Atria Wealth Solutions, Inc. | 0 | -100,00 | 0 | |||||
| 2025-07-31 | 13F | Cambridge Investment Research Advisors, Inc. | 49.990 | -34,13 | 3 | -33,33 | ||||
| 2025-05-12 | 13F | Sandy Spring Bank | 123 | 0,00 | 6 | 0,00 | ||||
| 2025-08-13 | 13F | Kilter Group LLC | 76 | 5 | ||||||
| 2025-08-14 | 13F | UBS Group AG | 727.984 | -12,96 | 43.519 | 1,04 | ||||
| 2025-08-14 | 13F | Citadel Advisors Llc | Call | 4.500 | -31,82 | 269 | -20,65 | |||
| 2025-08-14 | 13F | Citadel Advisors Llc | 29.627 | -25,58 | 1.771 | -13,61 | ||||
| 2025-07-17 | 13F | Wolff Wiese Magana Llc | 125 | 0,00 | 7 | 16,67 | ||||
| 2025-07-14 | 13F | Toth Financial Advisory Corp | 360 | 0,00 | 22 | 16,67 | ||||
| 2025-07-28 | 13F | Mutual Advisors, LLC | 13.350 | 146,04 | 847 | 208,76 | ||||
| 2025-08-08 | 13F | Cetera Investment Advisers | 53.412 | -9,47 | 3.193 | 5,07 | ||||
| 2025-08-14 | 13F | Old Mission Capital Llc | 42.128 | 424,63 | 2.518 | 509,69 | ||||
| 2025-08-07 | 13F | Winch Advisory Services, LLC | 3.438 | 0,00 | 206 | 15,82 | ||||
| 2025-07-14 | 13F | AdvisorNet Financial, Inc | 780 | -66,82 | 47 | -61,98 | ||||
| 2025-07-17 | 13F | Nelson, Van Denburg & Campbell Wealth Management Group, LLC | 0 | -100,00 | 0 | |||||
| 2025-08-05 | 13F | Bank of New York Mellon Corp | 13.038 | -0,03 | 779 | 16,10 | ||||
| 2025-08-14 | 13F | Fmr Llc | 7.267 | -8,04 | 434 | 6,90 | ||||
| 2025-08-14 | 13F | McIlrath & Eck, LLC | 960 | 0,00 | 57 | 16,33 | ||||
| 2025-08-13 | 13F | Financial Freedom, LLC | 6.996 | -0,01 | 418 | 16,11 | ||||
| 2025-07-25 | 13F | Johnson Investment Counsel Inc | 4.596 | 0,00 | 275 | 16,10 | ||||
| 2025-07-21 | 13F | Matauro, Llc | 4.110 | 0,00 | 246 | 16,11 | ||||
| 2025-07-29 | 13F | Koshinski Asset Management, Inc. | 4.290 | 256 | ||||||
| 2025-07-30 | 13F | St. Johns Investment Management Company, LLC | 0 | -100,00 | 0 | |||||
| 2025-08-07 | 13F | Allworth Financial LP | 649 | 56,39 | 39 | 90,00 | ||||
| 2025-07-23 | 13F | Objectivity Squared, LLC | 9.674 | 0,00 | 578 | 25,93 | ||||
| 2025-08-08 | 13F | Glassman Wealth Services | 30 | 0,00 | 2 | 0,00 | ||||
| 2025-07-08 | 13F | Zrc Wealth Management, Llc | 0 | -100,00 | 0 | |||||
| 2025-09-04 | 13F/A | Advisor Group Holdings, Inc. | 46.922 | -20,70 | 2.806 | -7,94 | ||||
| 2025-07-25 | 13F | Cwm, Llc | 3.609 | 0,00 | 0 | |||||
| 2025-04-24 | 13F | Wingate Wealth Advisors, Inc. | 0 | -100,00 | 0 | |||||
| 2025-08-14 | 13F | CIBC World Markets Inc. | 8.628 | 516 | ||||||
| 2025-04-17 | 13F | Dynamic Advisor Solutions LLC | 0 | -100,00 | 0 | |||||
| 2025-08-13 | 13F | Scotia Capital Inc. | 9.909 | 5,71 | 592 | 22,82 | ||||
| 2025-05-14 | 13F | TD Capital Management LLC | 0 | -100,00 | 0 | |||||
| 2025-07-22 | 13F | Comprehensive Financial Consultants Institutional, Inc. | 4.506 | 0,00 | 269 | 15,95 | ||||
| 2025-08-12 | 13F | CIBC Private Wealth Group, LLC | 247 | 0,00 | 15 | 40,00 | ||||
| 2025-07-16 | 13F | PFS Partners, LLC | 600 | 0,00 | 36 | 16,67 | ||||
| 2025-07-22 | 13F | SOL Capital Management CO | 9.610 | -0,52 | 1 | |||||
| 2025-08-07 | 13F | Cahill Financial Advisors Inc | 5.078 | 0,00 | 304 | 16,09 | ||||
| 2025-07-24 | 13F | Ronald Blue Trust, Inc. | 2.988 | 0,00 | 179 | 16,34 | ||||
| 2025-08-14 | 13F | Peapack Gladstone Financial Corp | 5.600 | 1,82 | 0 | |||||
| 2025-08-14 | 13F | Susquehanna International Group, Llp | 0 | -100,00 | 0 | |||||
| 2025-08-14 | 13F | Hancock Prospecting Pty Ltd | 21.793 | 0,00 | 1.303 | 16,04 | ||||
| 2025-08-04 | 13F | Gray Foundation | 205.000 | 0,00 | 12.255 | 16,07 | ||||
| 2025-08-07 | 13F | Summit Asset Management, LLC | 3.900 | 0,00 | 233 | 16,50 | ||||
| 2025-07-22 | 13F | Powell Investment Advisors, LLC | 251 | 15 | ||||||
| 2025-08-12 | 13F | Financial Advocates Investment Management | 3.636 | -15,17 | 217 | -1,36 | ||||
| 2025-05-12 | 13F | Independent Advisor Alliance | 0 | -100,00 | 0 | |||||
| 2025-08-12 | 13F | Coldstream Capital Management Inc | 0 | -100,00 | 0 | |||||
| 2025-05-15 | 13F | CAPROCK Group, Inc. | 11.586 | -1,81 | 597 | -10,11 | ||||
| 2025-08-14 | 13F | Group One Trading, L.p. | 163 | 0,00 | 10 | 12,50 | ||||
| 2025-07-15 | 13F | Main Street Group, LTD | 2 | 0,00 | 0 | |||||
| 2025-07-23 | 13F | Vontobel Holding Ltd. | 6.485 | 0,00 | 388 | 16,22 | ||||
| 2025-07-10 | 13F | Wedmont Private Capital | 6.400 | 0,00 | 388 | 27,30 | ||||
| 2025-07-25 | 13F | M3 Advisory Group, LLC | 3.552 | 212 | ||||||
| 2025-08-13 | 13F | Vermillion & White Wealth Management Group, LLC | 34 | 0,00 | 2 | 100,00 | ||||
| 2025-07-31 | 13F | Washington Trust Advisors, Inc. | 136 | 0,00 | 8 | 14,29 | ||||
| 2025-08-12 | 13F | Manchester Capital Management LLC | 2.600 | 0,00 | 155 | 16,54 | ||||
| 2025-08-12 | 13F | Mustico Financial Group, Inc. | 5.437 | 340 | ||||||
| 2025-07-08 | 13F | Nbc Securities, Inc. | 37 | 0,00 | 0 | |||||
| 2025-07-18 | 13F | Bartlett & Co. Wealth Management Llc | 800 | 0,00 | 48 | 14,63 | ||||
| 2025-07-29 | 13F | Stratos Wealth Partners, LTD. | 59.002 | -3,34 | 3.527 | 12,22 | ||||
| 2025-08-13 | 13F | Capital Analysts, Inc. | 200 | 0,00 | 0 | |||||
| 2025-08-12 | 13F | Coston, McIsaac & Partners | 5 | 0 | ||||||
| 2025-07-24 | 13F | IFP Advisors, Inc | 336 | -64,10 | 20 | -58,33 | ||||
| 2025-05-15 | 13F | Tower Research Capital LLC (TRC) | 0 | -100,00 | 0 | |||||
| 2025-05-29 | 13F/A | Nova Wealth Management, Inc. | 50 | -45,65 | 3 | -60,00 | ||||
| 2025-08-12 | 13F | RPG Investment Advisory, LLC | 23.764 | -51,14 | 1.421 | -43,29 | ||||
| 2025-08-13 | 13F | Summit Financial, LLC | 30.577 | 1.828 | ||||||
| 2025-08-05 | 13F | Simplex Trading, Llc | 0 | -100,00 | 0 | |||||
| 2025-08-13 | 13F | Cerity Partners LLC | 4.961 | 0,00 | 297 | 16,08 | ||||
| 2025-07-28 | 13F | Smart Portfolios, LLC | 3.680 | 220 | ||||||
| 2025-08-12 | 13F | Clearwater Capital Advisors, LLC | 3.818 | 228 | ||||||
| 2025-07-17 | 13F | Clay Northam Wealth Management, LLC | 14.388 | -4,32 | 860 | 11,11 | ||||
| 2025-08-08 | 13F | Hartland & Co., LLC | 622 | 1.843,75 | 37 | 3.600,00 | ||||
| 2025-08-14 | 13F | Great Valley Advisor Group, Inc. | 3.389 | -19,54 | 203 | -6,48 | ||||
| 2025-08-14 | 13F | Camden Capital, LLC | 9.302 | 0,00 | 556 | 16,08 | ||||
| 2025-07-18 | 13F | Vigilare Wealth Management | 3.667 | 219 | ||||||
| 2025-08-14 | 13F | CoreCap Advisors, LLC | 60 | 0,00 | 4 | 0,00 | ||||
| 2025-07-30 | 13F | Pacific Sun Financial Corp | 38.095 | -1,04 | 2.277 | 14,88 | ||||
| 2025-08-11 | 13F | Blue Bell Private Wealth Management, Llc | 15 | 0,00 | 1 | |||||
| 2025-08-04 | 13F | Creekmur Asset Management LLC | 1.456 | -5,64 | 87 | 10,13 | ||||
| 2025-08-14 | 13F/A | Barclays Plc | 3.500 | -24,11 | 0 | |||||
| 2025-07-21 | 13F | Crews Bank & Trust | 100 | 0,00 | 6 | 0,00 | ||||
| 2025-07-18 | 13F | Truist Financial Corp | 6.329 | 60,35 | 378 | 86,21 | ||||
| 2025-04-16 | 13F | New Century Financial Group, LLC | 0 | -100,00 | 0 | |||||
| 2025-08-13 | 13F | Flow Traders U.s. Llc | 34.674 | -66,47 | 2 | -60,00 | ||||
| 2025-08-08 | 13F | WASHINGTON TRUST Co | 0 | -100,00 | 0 | |||||
| 2025-08-08 | 13F | Gts Securities Llc | 4.883 | 292 | ||||||
| 2025-08-14 | 13F | Bank Of America Corp /de/ | 8.052 | 4,99 | 481 | 22,08 | ||||
| 2025-08-13 | 13F | Wealthquest Corp | 0 | -100,00 | 0 | -100,00 | ||||
| 2025-07-28 | 13F | Harbour Investments, Inc. | 2.945 | -32,76 | 176 | -21,78 | ||||
| 2025-08-14 | 13F | Millennium Management Llc | 17.711 | 38,87 | 1.059 | 61,28 | ||||
| 2025-08-14 | 13F/A | Rockefeller Capital Management L.P. | 14.574 | 6,47 | 871 | 23,72 | ||||
| 2025-07-24 | 13F | Blair William & Co/il | 3.574 | -39,40 | 214 | -29,70 | ||||
| 2025-07-21 | 13F | Hilltop National Bank | 0 | -100,00 | 0 | |||||
| 2025-04-28 | 13F | Mainstream Capital Management LLC | 0 | -100,00 | 0 | |||||
| 2025-08-14 | 13F | Mercer Global Advisors Inc /adv | 81.857 | -1,22 | 4.893 | 14,67 | ||||
| 2025-08-04 | 13F | Spire Wealth Management | 9.277 | -2,66 | 555 | 13,06 | ||||
| 2025-08-19 | 13F | Newbridge Financial Services Group, Inc. | 151 | 0,00 | 9 | 28,57 | ||||
| 2025-07-22 | 13F | Valley National Advisers Inc | 210 | 0,00 | 0 | |||||
| 2025-08-07 | 13F | LFA - Lugano Financial Advisors SA | 0 | -100,00 | 0 | |||||
| 2025-04-25 | 13F | New Wave Wealth Advisors Llc | 0 | -100,00 | 0 | |||||
| 2025-07-15 | 13F | Cranbrook Wealth Management, LLC | 323 | 0,00 | 19 | 18,75 | ||||
| 2025-07-22 | 13F | Cedar Mountain Advisors, LLC | 211 | 0,00 | 13 | 20,00 | ||||
| 2025-08-14 | 13F | Banque Transatlantique SA | 1.576 | -22,90 | 93 | -10,58 | ||||
| 2025-07-10 | 13F | Tompkins Financial Corp | 0 | -100,00 | 0 | |||||
| 2025-08-04 | 13F | Assetmark, Inc | 74 | 4 | ||||||
| 2025-07-16 | 13F | TOWER TRUST & INVESTMENT Co | 325 | 0,00 | 19 | 18,75 | ||||
| 2025-07-31 | 13F | Ssa Swiss Advisors Ag | 1.500 | -53,56 | 95 | -42,77 | ||||
| 2025-09-11 | 13F | Milestones Private Investment Advisors LLC | 7.305 | 437 | ||||||
| 2025-07-24 | 13F | Costello Asset Management, INC | 325 | 0,00 | 19 | 18,75 | ||||
| 2025-07-15 | 13F | James J. Burns & Company, LLC | 9.478 | -10,35 | 567 | 4,04 | ||||
| 2025-07-29 | 13F | Primoris Wealth Advisors, Llc | 0 | -100,00 | 0 | |||||
| 2025-08-01 | 13F | Solstein Capital, LLC | 1.175 | 0,00 | 70 | 16,67 | ||||
| 2025-08-13 | 13F | Russell Investments Group, Ltd. | 96 | 0,00 | 6 | 25,00 | ||||
| 2025-08-07 | 13F | LOM Asset Management Ltd | 550 | 0 | ||||||
| 2025-07-25 | 13F | SPC Financial, Inc. | 15.274 | -1,99 | 913 | 13,84 | ||||
| 2025-08-13 | 13F | Continuum Advisory, LLC | 0 | -100,00 | 0 | |||||
| 2025-07-28 | 13F | BRYN MAWR TRUST Co | 3.406 | 0,00 | 204 | 16,00 | ||||
| 2025-08-14 | 13F | Colony Group, LLC | 36.687 | -0,56 | 2.193 | 15,42 | ||||
| 2025-08-08 | 13F | Larson Financial Group LLC | 300 | 0,00 | 18 | 13,33 | ||||
| 2025-07-09 | 13F | Bank of New Hampshire | 305 | -10,29 | 18 | 5,88 | ||||
| 2025-07-23 | 13F | Prime Capital Investment Advisors, LLC | 0 | -100,00 | 0 | |||||
| 2025-08-05 | 13F | Westside Investment Management, Inc. | 100 | 0,00 | 6 | 0,00 | ||||
| 2025-08-12 | 13F | Atlas Capital Advisors Llc | 0 | -100,00 | 0 | |||||
| 2025-07-18 | 13F | Union Bancaire Privee, UBP SA | 0 | -100,00 | 0 | |||||
| 2025-08-11 | 13F | Strategic Wealth Partners, Ltd. | 600 | 36 | ||||||
| 2025-08-15 | 13F | Equitable Holdings, Inc. | 13.223 | 4,52 | 790 | 21,35 | ||||
| 2025-07-24 | 13F | Us Bancorp \de\ | 1.514 | -35,24 | 91 | -25,00 | ||||
| 2025-08-11 | 13F | Advisor Resource Council | 0 | -100,00 | 0 | |||||
| 2025-07-25 | 13F | Ellis Investment Partners, LLC | 4.540 | 0,00 | 271 | 16,31 | ||||
| 2025-08-06 | 13F | New Millennium Group LLC | 100 | 6 | ||||||
| 2025-08-15 | 13F | Captrust Financial Advisors | 22.778 | 6,38 | 1.362 | 23,50 | ||||
| 2025-08-12 | 13F | Bank OZK | 23.979 | -1,25 | 1.433 | 14,64 | ||||
| 2025-08-14 | 13F | Glen Eagle Advisors, LLC | 60 | 0,00 | 4 | 0,00 | ||||
| 2025-08-08 | 13F | Wiser Advisor Group LLC | 0 | -100,00 | 0 | |||||
| 2025-04-24 | 13F | Crescent Grove Advisors, LLC | 0 | -100,00 | 0 | |||||
| 2025-08-01 | 13F | Brookwood Investment Group LLC | 18.850 | 23,49 | 1.127 | 43,26 | ||||
| 2025-08-14 | 13F | D. E. Shaw & Co., Inc. | 7.358 | 0,00 | 440 | 16,14 | ||||
| 2025-08-06 | 13F | Ethos Financial Group, LLC | 4.237 | 0,00 | 253 | 16,06 | ||||
| 2025-08-14 | 13F | EP Wealth Advisors, Inc. | 6.077 | 363 | ||||||
| 2025-08-15 | 13F | Morgan Stanley | 487.383 | -6,28 | 29.136 | 8,79 | ||||
| 2025-07-28 | 13F | Duncker Streett & Co Inc | 340 | 20 | ||||||
| 2025-08-11 | 13F | TD Waterhouse Canada Inc. | 2.620 | 0,00 | 156 | 16,42 | ||||
| 2025-08-05 | 13F | Carmel Capital Management L.L.C. | 97.890 | -0,08 | 5.852 | 15,98 | ||||
| 2025-04-11 | 13F | Insight Advisors, LLC/ PA | 0 | -100,00 | 0 | |||||
| 2025-08-05 | 13F | Prosperity Consulting Group, LLC | 8.513 | -0,53 | 509 | 15,45 | ||||
| 2025-08-14 | 13F | Citadel Advisors Llc | Put | 0 | -100,00 | 0 | ||||
| 2025-07-09 | 13F | Key Client Fiduciary Advisors, LLC | 5.370 | 0,00 | 321 | 16,30 | ||||
| 2025-08-15 | 13F | CI Private Wealth, LLC | 189.915 | -1,95 | 11.353 | 13,83 | ||||
| 2025-07-15 | 13F | North Star Investment Management Corp. | 4.350 | 0,00 | 260 | 16,07 | ||||
| 2025-08-07 | 13F | Resources Investment Advisors, LLC. | 45.994 | -4,42 | 2.750 | 10,94 | ||||
| 2025-08-05 | 13F | Huntington National Bank | 31 | |||||||
| 2025-08-13 | 13F | Beacon Pointe Advisors, LLC | 40.036 | -6,32 | 2.393 | 8,77 | ||||
| 2025-07-16 | 13F | Rainier Family Wealth Inc | 23.229 | 1.389 | ||||||
| 2025-05-14 | 13F | Oarsman Capital, Inc. | 0 | -100,00 | 0 | |||||
| 2025-08-08 | 13F | Creative Planning | 14.240 | 7,29 | 851 | 24,60 | ||||
| 2025-08-11 | 13F | HighTower Advisors, LLC | 15.443 | -1,83 | 923 | 13,95 | ||||
| 2025-07-30 | 13F | Pittenger & Anderson Inc | 875 | 0,00 | 52 | 15,56 | ||||
| 2025-08-11 | 13F | Private Advisor Group, LLC | 18.980 | 11,22 | 1.135 | 29,16 | ||||
| 2025-07-31 | 13F | Burke & Herbert Bank & Trust Co | 17.831 | -1,36 | 1.066 | 14,52 | ||||
| 2025-08-12 | 13F | SRS Capital Advisors, Inc. | 380 | 0,00 | 23 | 15,79 | ||||
| 2025-08-12 | 13F | MAI Capital Management | 1.290 | 0,00 | 77 | 16,67 | ||||
| 2025-08-14 | 13F | Federation des caisses Desjardins du Quebec | 1.915 | 0,00 | 114 | 16,33 | ||||
| 2025-08-14 | 13F | Mml Investors Services, Llc | 11.127 | -18,19 | 1 | |||||
| 2025-08-05 | 13F | GPS Wealth Strategies Group, LLC | 102 | 0,00 | 6 | 20,00 | ||||
| 2025-07-16 | 13F | Signaturefd, Llc | 222 | 62,04 | 13 | 85,71 | ||||
| 2025-08-15 | 13F | Kestra Advisory Services, LLC | 13.448 | 19,44 | 804 | 38,69 | ||||
| 2025-08-01 | 13F | GoalVest Advisory LLC | 491 | 0,00 | 29 | 16,00 | ||||
| 2025-08-14 | 13F | Main Street Financial Solutions, LLC | 22.073 | 0,56 | 1.320 | 16,73 | ||||
| 2025-05-14 | 13F | Smartleaf Asset Management LLC | 0 | -100,00 | 0 | |||||
| 2025-08-05 | 13F | American Institute for Advanced Investment Management, LLP | 0 | -100,00 | 0 | |||||
| 2025-07-11 | 13F | Farther Finance Advisors, LLC | 3.878 | 2,35 | 232 | 18,46 | ||||
| 2025-08-01 | 13F | Bessemer Group Inc | 12.940 | 0,00 | 1 | |||||
| 2025-08-14 | 13F | GWM Advisors LLC | 1.491 | -76,85 | 89 | -73,11 | ||||
| 2025-04-21 | 13F | Means Investment Co., Inc. | 0 | -100,00 | 0 | |||||
| 2025-08-11 | 13F | Principal Securities, Inc. | 62.435 | -37,92 | 3.732 | -34,03 | ||||
| 2025-04-22 | 13F | Castleview Partners, Llc | 0 | -100,00 | 0 | |||||
| 2025-08-11 | 13F | Anfield Capital Management, LLC | 133 | 0,00 | 8 | 16,67 | ||||
| 2025-07-07 | 13F | Wilson & Boucher Capital Management, LLC | 3.775 | 226 | ||||||
| 2025-08-11 | 13F | FSA Wealth Management LLC | 224 | 409,09 | 13 | 550,00 | ||||
| 2025-08-14 | 13F | Manufacturers Life Insurance Company, The | 0 | -100,00 | 0 | |||||
| 2025-07-17 | 13F | Sound Income Strategies, LLC | 39 | -61,00 | 2 | -60,00 | ||||
| 2025-08-13 | 13F | Fort Sheridan Advisors Llc | 5.222 | 0,00 | 312 | 16,42 | ||||
| 2025-08-08 | 13F | Citizens Financial Group Inc/ri | 5.102 | 0,00 | 305 | 16,03 | ||||
| 2025-08-12 | 13F | Prudential Plc | 28.440 | 17,81 | 1.700 | 36,77 | ||||
| 2025-07-17 | 13F | BFI Infinity Ltd. | 0 | -100,00 | 0 | |||||
| 2025-08-29 | 13F | Total Investment Management Inc | 1.100 | 66 | ||||||
| 2025-08-05 | 13F | Fourth Dimension Wealth, LLC | 64 | 0,00 | 4 | 0,00 | ||||
| 2025-08-14 | 13F | Hrt Financial Lp | 0 | -100,00 | 0 | |||||
| 2025-08-12 | 13F | LPL Financial LLC | 300.655 | 4,09 | 17.973 | 20,83 | ||||
| 2025-08-11 | 13F | Citigroup Inc | 40.120 | -5,70 | 2.398 | 9,45 | ||||
| 2025-08-12 | 13F | Proequities, Inc. | 0 | 0 | ||||||
| 2025-08-14 | 13F | Susquehanna International Group, Llp | Call | 18.300 | 306,67 | 1.094 | 373,16 | |||
| 2025-08-13 | 13F | Greenwich Wealth Management LLC | 7.939 | 0,00 | 0 | |||||
| 2025-08-06 | 13F | Atlantic Union Bankshares Corp | 123 | 7 | ||||||
| 2025-08-06 | 13F | Commonwealth Equity Services, Llc | 99.823 | -5,36 | 6 | 0,00 | ||||
| 2025-07-29 | 13F | Curbstone Financial Management Corp | 20.780 | 0,00 | 1.242 | 16,07 | ||||
| 2025-08-07 | 13F | CENTRAL TRUST Co | 1.000 | -6,98 | 60 | 7,27 | ||||
| 2025-08-13 | 13F | Safe Harbor Fiduciary, LLC | 200 | 12 | ||||||
| 2025-07-14 | 13F | UMA Financial Services, Inc. | 1.250 | 0,00 | 75 | 15,63 | ||||
| 2025-08-04 | 13F | Pinnacle Associates Ltd | 45.203 | -8,30 | 2.702 | 6,46 | ||||
| 2025-04-16 | 13F | Wealth Enhancement Advisory Services, Llc | 0 | -100,00 | 0 | |||||
| 2025-07-18 | 13F | PFG Investments, LLC | 3.918 | 234 | ||||||
| 2025-08-14 | 13F | IHT Wealth Management, LLC | 9.397 | -8,38 | 562 | 6,25 | ||||
| 2025-07-31 | 13F | AlTi Global, Inc. | 5.665 | 0,00 | 339 | 16,15 | ||||
| 2025-08-04 | 13F | Roble, Belko & Company, Inc | 87 | 0 | ||||||
| 2025-07-23 | 13F | Bellevue Asset Management, Llc | 517 | 0,00 | 31 | 15,38 | ||||
| 2025-08-12 | 13F | Jpmorgan Chase & Co | 6.006 | 280,85 | 359 | 343,21 | ||||
| 2025-08-14 | 13F | Ameriprise Financial Inc | 129.201 | -9,03 | 7.724 | 5,59 | ||||
| 2025-07-14 | 13F | Pacifica Partners Inc. | 158 | 0,00 | 9 | 28,57 | ||||
| 2025-08-07 | 13F | Flagship Wealth Advisors, Llc | 188 | 0,00 | 11 | 22,22 | ||||
| 2025-08-07 | 13F | Fountainhead AM, LLC | 262.578 | -19,24 | 15.697 | -6,26 | ||||
| 2025-08-08 | 13F | Fortis Group Advisors, LLC | 502 | 0,00 | 30 | 20,00 | ||||
| 2025-08-19 | 13F | Anchor Investment Management, LLC | 50 | 0,00 | 3 | 0,00 | ||||
| 2025-07-07 | 13F | Trust Co | 79 | -1,25 | 5 | 0,00 | ||||
| 2025-08-13 | 13F | Northwestern Mutual Wealth Management Co | 88.367 | -7,92 | 5.283 | 6,88 | ||||
| 2025-07-22 | 13F | Berkshire Money Management, Inc. | 575 | 34 | ||||||
| 2025-07-22 | 13F | USAdvisors Wealth Management, LLC | 0 | -100,00 | 0 | |||||
| 2025-08-07 | 13F | Pinnacle Wealth Management Advisory Group, LLC | 10.470 | -26,85 | 626 | -15,20 | ||||
| 2025-08-18 | 13F/A | National Bank Of Canada /fi/ | 77.541 | -0,72 | 4.626 | 14,99 | ||||
| 2025-04-23 | 13F | Perigon Wealth Management, LLC | 0 | -100,00 | 0 | |||||
| 2025-07-29 | 13F | Creekside Partners | 7.110 | 0,00 | 425 | 16,12 | ||||
| 2025-08-01 | 13F | Biltmore Family Office, LLC | 201.327 | -1,07 | 12.035 | 14,84 | ||||
| 2025-07-21 | 13F | Ameritas Advisory Services, LLC | 194 | 12 | ||||||
| 2025-08-13 | 13F | Baird Financial Group, Inc. | 6.370 | -15,10 | 381 | -1,55 | ||||
| 2025-08-13 | 13F | Solutions 4 Wealth, Ltd | 18.024 | 3,15 | 1.077 | 19,80 | ||||
| 2025-08-14 | 13F | Comerica Bank | 4.815 | 0,04 | 288 | 16,19 | ||||
| 2025-08-01 | 13F | Envestnet Asset Management Inc | 97.458 | 7,02 | 5.826 | 24,22 | ||||
| 2025-07-08 | 13F | Silverleafe Capital Partners, LLC | 0 | -100,00 | 0 | |||||
| 2025-08-14 | 13F | Humankind Investments LLC | 41.500 | 0,00 | 2.481 | 16,05 | ||||
| 2025-04-09 | 13F | Fiduciary Alliance LLC | 0 | -100,00 | 0 | |||||
| 2025-08-14 | 13F | Mariner, LLC | 3.909 | -0,41 | 234 | 15,35 |