Grundlæggende statistik
| Institutionelle ejere | 121 total, 115 long only, 4 short only, 2 long/short - change of -9,02% MRQ |
| Gennemsnitlig porteføljeallokering | 0.1620 % - change of -14,89% MRQ |
| Institutionelle aktier (lange) | 8.442.335 (ex 13D/G) - change of -1,04MM shares -10,96% MRQ |
| Institutionel værdi (lang) | $ 175.081 USD ($1000) |
Institutionelt ejerskab og aktionærer
iShares Trust - iShares Mortgage Real Estate ETF (US:REM) har 121 institutionelle ejere og aktionærer, der har indsendt 13D/G- eller 13F-formularer til Securities Exchange Commission (SEC). Disse institutioner har i alt 8,442,348 aktier. Største aktionærer omfatter Wells Fargo & Company/mn, Morgan Stanley, Envestnet Asset Management Inc, Bank Of America Corp /de/, Bnp Paribas Arbitrage, Sa, Advisor Group Holdings, Inc., Evergreen Capital Management Llc, Ameriprise Financial Inc, LPL Financial LLC, and VisionPoint Advisory Group, LLC .
iShares Trust - iShares Mortgage Real Estate ETF (BATS:REM) institutionel ejerskabsstruktur viser aktuelle positioner i virksomheden efter institutioner og fonde, samt seneste ændringer i positionsstørrelse. Større aktionærer kan omfatte individuelle investorer, investeringsforeninger, hedgefonde eller institutioner. Skema 13D angiver, at investoren besidder (eller besidder) mere end 5 % af virksomheden og har til hensigt (eller har til hensigt at) aktivt at forfølge en ændring i forretningsstrategi. Skema 13G indikerer en passiv investering på over 5%.
The share price as of September 11, 2025 is 23,32 / share. Previously, on September 12, 2024, the share price was 23,75 / share. This represents a decline of 1,81% over that period.

Fondens stemningsscore
Fund Sentiment Score (fka Ownership Accumulation Score) finder de aktier, der bliver mest købt af fonde. Det er resultatet af en sofistikeret, multi-faktor kvantitativ model, der identificerer virksomheder med de højeste niveauer af institutionel akkumulering. Scoringsmodellen bruger en kombination af den samlede stigning i oplyste ejere, ændringerne i porteføljeallokeringer i disse ejere og andre målinger. Tallet går fra 0 til 100, hvor højere tal indikerer et højere niveau af akkumulering for sine jævnaldrende, og 50 er gennemsnittet.
Opdateringsfrekvens: Dagligt
Se Ownership Explorer, som giver en liste over højest rangerende virksomheder.
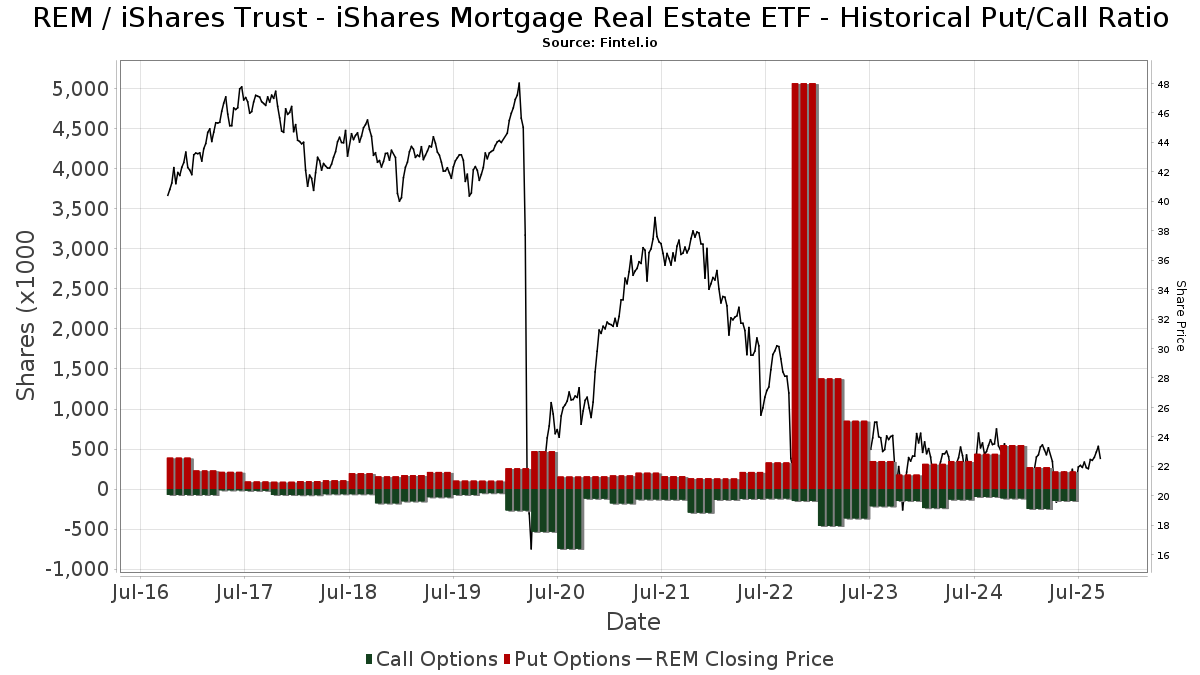
Institutionel Put/Call-forhold
Ud over at indberette standardaktie- og gældsudstedelser skal institutter med mere end 100 mill. aktiver under forvaltning også oplyse deres put- og call-optionsbeholdninger. Da salgsoptioner generelt indikerer negativ stemning, og købsoptioner indikerer positiv stemning, kan vi få en fornemmelse af den overordnede institutionelle stemning ved at plotte forholdet mellem put og kald. Diagrammet til højre viser det historiske put/call-forhold for dette instrument.
Brug af Put/Call Ratio som en indikator for investorernes stemning overvinder en af de vigtigste mangler ved at bruge totalt institutionelt ejerskab, som er, at en betydelig mængde af aktiver under forvaltning investeres passivt for at spore indekser. Passivt forvaltede fonde køber typisk ikke optioner, så indikatoren for put/call-forholdet følger mere nøje følelsen af aktivt forvaltede fonde.
13F og NPORT arkivering
Detaljer om 13F-arkivering er gratis. Detaljer om NP-ansøgninger kræver et premium-medlemskab. Grønne rækker angiver nye positioner. Røde rækker angiver lukkede positioner. Klik på linket ikon for at se den fulde transaktionshistorik.
Opgrader
for at låse premium-data op og eksportere til Excel ![]() .
.
| Fil dato | Kilde | Investor | Type | Gennemsnitlig pris (Øst) |
Aktier | Δ Aktier (%) |
Rapporteret Værdi ($1000) |
Δ Værdi (%) |
Port Alloc (%) |
|
|---|---|---|---|---|---|---|---|---|---|---|
| 2025-07-16 | 13F/A | CX Institutional | 402 | 1,26 | 0 | |||||
| 2025-08-14 | 13F | Mariner, LLC | 20.854 | -32,59 | 446 | -35,88 | ||||
| 2025-08-14 | 13F | Susquehanna International Group, Llp | Put | 70.200 | 1,74 | 1.501 | -3,10 | |||
| 2025-08-14 | 13F | Susquehanna International Group, Llp | 54.226 | -7,77 | 1.159 | -12,13 | ||||
| 2025-07-09 | 13F | VisionPoint Advisory Group, LLC | 203.395 | -3,45 | 4.349 | -8,02 | ||||
| 2025-08-14 | 13F | Susquehanna International Group, Llp | Call | 112.600 | -27,73 | 2.407 | -31,15 | |||
| 2025-05-13 | 13F | EverSource Wealth Advisors, LLC | 0 | -100,00 | 0 | |||||
| 2025-08-04 | 13F | Spire Wealth Management | 96 | 0,00 | 2 | 0,00 | ||||
| 2025-08-14 | 13F | UBS Group AG | 172.058 | 15,01 | 3.679 | 9,56 | ||||
| 2025-05-14 | 13F | Oarsman Capital, Inc. | 0 | -100,00 | 0 | -100,00 | ||||
| 2025-08-12 | 13F | Proequities, Inc. | 0 | 0 | ||||||
| 2025-07-15 | 13F | Fifth Third Bancorp | 212 | 0,00 | 5 | 0,00 | ||||
| 2025-08-14 | 13F | Fwl Investment Management, Llc | 14.061 | -25,57 | 301 | -29,08 | ||||
| 2025-07-30 | 13F | Mid-American Wealth Advisory Group, Inc. | 269 | 6 | ||||||
| 2025-08-18 | 13F | Wolverine Trading, Llc | Put | 0 | -100,00 | 0 | -100,00 | |||
| 2025-08-14 | 13F | Smartleaf Asset Management LLC | 900 | 19 | ||||||
| 2025-08-08 | 13F | Cetera Investment Advisers | 35.672 | 17,69 | 763 | 12,06 | ||||
| 2025-08-12 | 13F | LPL Financial LLC | 219.571 | 10,84 | 4.694 | 5,60 | ||||
| 2025-07-21 | 13F | DHJJ Financial Advisors, Ltd. | 50 | 0,00 | 1 | 0,00 | ||||
| 2025-08-07 | 13F | Kestra Private Wealth Services, Llc | 32.954 | -41,32 | 705 | -44,13 | ||||
| 2025-08-12 | 13F | CIBC Private Wealth Group, LLC | 0 | -100,00 | 0 | |||||
| 2025-05-29 | NP | SYMIX - AlphaCentric Symmetry Strategy Fund Class I | 16.147 | 85,92 | 362 | 95,68 | ||||
| 2025-08-13 | 13F | Bayview Asset Management, Llc | Put | 71.500 | 1.529 | |||||
| 2025-08-14 | 13F | Goldman Sachs Group Inc | 0 | -100,00 | 0 | |||||
| 2025-08-11 | 13F | Synergy Investment Management, LLC | 0 | -100,00 | 0 | |||||
| 2025-07-17 | 13F | Barry Investment Advisors, LLC | 144.845 | -0,54 | 3.097 | -5,23 | ||||
| 2025-07-29 | 13F | Salomon & Ludwin, LLC | 247 | 0,00 | 5 | 0,00 | ||||
| 2025-07-30 | 13F | Drive Wealth Management, Llc | 142.151 | 388,95 | 3.039 | 366,10 | ||||
| 2025-07-08 | 13F | Nbc Securities, Inc. | 11.231 | 0,00 | 0 | |||||
| 2025-07-18 | 13F | Clarity Financial LLC | 145.019 | -40,80 | 3.101 | -43,60 | ||||
| 2025-08-14 | 13F | Macquarie Group Ltd | 35.243 | 11.766,33 | 753 | 12.450,00 | ||||
| 2025-08-07 | 13F | Cascade Financial Partners, LLC | 17.450 | 0,00 | 373 | -4,60 | ||||
| 2025-08-13 | 13F | Lido Advisors, LLC | 12.637 | 0,93 | 270 | -3,57 | ||||
| 2025-07-28 | 13F | Harbour Investments, Inc. | 84.876 | 10,51 | 1.815 | 5,28 | ||||
| 2025-08-11 | 13F | PFG Private Wealth Management, LLC | 0 | -100,00 | 0 | |||||
| 2025-08-13 | 13F | Townsquare Capital Llc | 0 | -100,00 | 0 | |||||
| 2025-07-11 | 13F | Farther Finance Advisors, LLC | 1.528 | 239,56 | 33 | 220,00 | ||||
| 2025-08-14 | 13F | Citadel Advisors Llc | Call | 13.800 | 79,22 | 295 | 71,51 | |||
| 2025-08-08 | 13F | Avantax Advisory Services, Inc. | 24.691 | -22,69 | 528 | -26,40 | ||||
| 2025-08-14 | 13F | Citadel Advisors Llc | 37.897 | -77,53 | 810 | -78,59 | ||||
| 2025-08-14 | 13F | Citadel Advisors Llc | Put | 66.800 | -63,68 | 1.428 | -65,39 | |||
| 2025-08-14 | 13F | Federation des caisses Desjardins du Quebec | 576 | 0,00 | 12 | 0,00 | ||||
| 2025-08-14 | 13F | Two Sigma Securities, Llc | 0 | -100,00 | 0 | |||||
| 2025-08-14 | 13F | Fmr Llc | 275 | -25,68 | 6 | -37,50 | ||||
| 2025-07-25 | 13F | Endowment Wealth Management, Inc. | 9.565 | 205 | ||||||
| 2025-08-14 | 13F | Raymond James Financial Inc | 133.338 | 85,26 | 2.851 | 76,47 | ||||
| 2025-07-30 | 13F | Phillips Financial Management, Llc | 0 | -100,00 | 0 | |||||
| 2025-07-25 | 13F | Cwm, Llc | 2.346 | 0,26 | 0 | |||||
| 2025-08-14 | 13F | IHT Wealth Management, LLC | 51.797 | 0,07 | 1.107 | -4,65 | ||||
| 2025-08-14 | 13F | Evergreen Capital Management Llc | 321.751 | 6,03 | 6.879 | 1,03 | ||||
| 2025-08-14 | 13F/A | Rockefeller Capital Management L.P. | 10.340 | 1,10 | 221 | -3,49 | ||||
| 2025-08-06 | 13F | Commonwealth Equity Services, Llc | 11.225 | -28,38 | 0 | |||||
| 2025-08-11 | 13F | Mount Lucas Management LP | 0 | -100,00 | 0 | |||||
| 2025-08-14 | 13F | Quantessence Capital LLC | 23.470 | 502 | ||||||
| 2025-07-16 | 13F | ORG Wealth Partners, LLC | 589 | 0,00 | 13 | -7,69 | ||||
| 2025-08-14 | 13F | Group One Trading, L.p. | 0 | -100,00 | 0 | |||||
| 2025-07-14 | 13F | Park Avenue Securities Llc | 25.183 | 1 | ||||||
| 2025-08-07 | 13F | Allworth Financial LP | 68 | 3,03 | 1 | 0,00 | ||||
| 2025-08-26 | 13F/A | Thrivent Financial For Lutherans | 10.950 | -57,15 | 0 | |||||
| 2025-06-26 | NP | FIXP - FolioBeyond Enhanced Fixed Income Premium ETF | 27.807 | -47,25 | 592 | -49,79 | ||||
| 2025-08-12 | 13F | Steward Partners Investment Advisory, Llc | 279 | -76,24 | 6 | -80,77 | ||||
| 2025-08-14 | 13F | Millennium Management Llc | 0 | -100,00 | 0 | |||||
| 2025-08-27 | NP | RYDEX VARIABLE TRUST - Multi-Hedge Strategies Fund Variable Annuity | Short | -8 | -71,43 | -0 | ||||
| 2025-08-14 | 13F | Bnp Paribas Arbitrage, Sa | 397.414 | 4.415.611,11 | 8.497 | |||||
| 2025-08-13 | 13F | Baker Avenue Asset Management, LP | 0 | -100,00 | 0 | |||||
| 2025-05-13 | 13F | SFI Advisors, LLC | 0 | -100,00 | 0 | |||||
| 2025-07-28 | 13F | BRYN MAWR TRUST Co | 375 | 0,00 | 8 | 0,00 | ||||
| 2025-08-14 | 13F | Robinson Capital Management, Llc | 29.420 | 18,45 | 629 | 13,74 | ||||
| 2025-05-06 | 13F | Wedbush Securities Inc | 0 | -100,00 | 0 | |||||
| 2025-07-17 | 13F/A | Capital Investment Advisors, LLC | 39.499 | -11,95 | 844 | -16,10 | ||||
| 2025-07-15 | 13F | Fortitude Family Office, LLC | 223 | 48,67 | 5 | 33,33 | ||||
| 2025-08-12 | 13F | Global Retirement Partners, LLC | 783 | 347,43 | 17 | 433,33 | ||||
| 2025-03-12 | 13F/A | Private Capital Management Llc | 0 | -100,00 | 0 | |||||
| 2025-07-22 | 13F | Wealthcare Advisory Partners LLC | 33.758 | 1,05 | 722 | -3,74 | ||||
| 2025-08-13 | 13F | Russell Investments Group, Ltd. | 74 | -23,71 | 2 | -50,00 | ||||
| 2025-08-14 | 13F | Comerica Bank | 14.880 | 12,48 | 318 | 7,43 | ||||
| 2025-08-28 | NP | TFAFX - Tactical Growth Allocation Fund Class I | 1.980 | 23,75 | 42 | 20,00 | ||||
| 2025-07-07 | 13F | Investors Research Corp | 177 | 0,00 | 4 | 0,00 | ||||
| 2025-08-06 | 13F | Golden State Wealth Management, LLC | 149 | 2,76 | 3 | 0,00 | ||||
| 2025-07-28 | 13F | Bridges Investment Management Inc | 66.044 | 38,99 | 1.412 | 32,46 | ||||
| 2025-08-14 | 13F | Mml Investors Services, Llc | 114.073 | 4,73 | 2 | 0,00 | ||||
| 2025-07-21 | 13F | Future Financial Wealth Managment LLC | 2.900 | 0,00 | 62 | -4,62 | ||||
| 2025-07-24 | 13F | IFP Advisors, Inc | 10.243 | -11,08 | 219 | -15,50 | ||||
| 2025-07-15 | 13F | MCF Advisors LLC | 6.453 | 0,00 | 138 | -4,86 | ||||
| 2025-08-11 | 13F | Principal Securities, Inc. | 933 | 0,00 | 20 | 0,00 | ||||
| 2025-08-14 | 13F | Royal Bank Of Canada | 103.293 | -52,35 | 2.208 | -54,61 | ||||
| 2025-07-31 | 13F | Wealthfront Advisers Llc | 28.970 | 19,63 | 619 | 14,00 | ||||
| 2025-07-31 | 13F | Cambridge Investment Research Advisors, Inc. | 40.100 | -0,85 | 1 | |||||
| 2025-08-19 | 13F | Anchor Investment Management, LLC | 200 | 0,00 | 4 | 0,00 | ||||
| 2025-08-12 | 13F | SRS Capital Advisors, Inc. | 3 | 0,00 | 0 | |||||
| 2025-08-12 | 13F | MAI Capital Management | 1.822 | -10,99 | 39 | -15,56 | ||||
| 2025-08-14 | 13F | Jane Street Group, Llc | Call | 0 | -100,00 | 0 | ||||
| 2025-08-14 | 13F | Jane Street Group, Llc | Put | 10.800 | 11,34 | 231 | 5,99 | |||
| 2025-08-12 | 13F | Change Path, LLC | 18.098 | 12,20 | 387 | 6,93 | ||||
| 2025-08-13 | 13F | Cerity Partners LLC | 0 | -100,00 | 0 | |||||
| 2025-07-30 | 13F | Brookstone Capital Management | 18.578 | -17,35 | 397 | -21,23 | ||||
| 2025-08-15 | 13F | Tower Research Capital LLC (TRC) | 55.151 | -14,25 | 1.179 | -18,30 | ||||
| 2025-04-29 | 13F | Element Wealth, LLC | 0 | -100,00 | 0 | |||||
| 2025-08-14 | 13F | Jane Street Group, Llc | 0 | -100,00 | 0 | |||||
| 2025-05-15 | 13F | Schonfeld Strategic Advisors LLC | 0 | -100,00 | 0 | |||||
| 2025-07-17 | 13F | Paradigm Financial Partners, Llc | 161.240 | -0,08 | 3.447 | -4,81 | ||||
| 2025-08-14 | 13F | Wells Fargo & Company/mn | 1.577.216 | 25,04 | 33.721 | 19,13 | ||||
| 2025-08-06 | 13F | AE Wealth Management LLC | 29.425 | 2,94 | 629 | -1,87 | ||||
| 2025-08-08 | 13F | Advyzon Investment Management, LLC | 14.646 | 1,78 | 313 | -2,80 | ||||
| 2025-08-13 | 13F | Northwestern Mutual Wealth Management Co | 22.287 | 39,77 | 476 | 33,33 | ||||
| 2025-08-08 | 13F | Emerald Investment Partners, Llc | 1.000 | 0,00 | 21 | -4,55 | ||||
| 2025-08-14 | 13F | Toroso Investments, LLC | 49.767 | -9,36 | 1.064 | -13,64 | ||||
| 2025-07-29 | 13F | Private Trust Co Na | 150 | 0,00 | 3 | 0,00 | ||||
| 2025-08-14 | 13F | Ameriprise Financial Inc | 296.604 | -8,33 | 6.341 | -12,65 | ||||
| 2025-08-14 | 13F | Man Group plc | 0 | -100,00 | 0 | |||||
| 2025-04-23 | 13F | Creative Financial Designs Inc /adv | 0 | -100,00 | 0 | |||||
| 2025-08-11 | 13F | Citigroup Inc | 18.497 | 0,33 | 395 | -4,36 | ||||
| 2025-05-08 | 13F | Us Bancorp \de\ | 0 | -100,00 | 0 | |||||
| 2025-08-14 | 13F | Napa Wealth Management | 22.193 | 3,97 | 474 | -1,04 | ||||
| 2025-08-15 | 13F | Kestra Advisory Services, LLC | 26.576 | 13,01 | 568 | 7,78 | ||||
| 2025-07-11 | 13F | SILVER OAK SECURITIES, Inc | 15.384 | 2,97 | 329 | -0,61 | ||||
| 2025-08-14 | 13F | GWM Advisors LLC | 533 | 0,00 | 11 | 0,00 | ||||
| 2025-08-13 | 13F | Transce3nd, LLC | 66.184 | 5,77 | 1.416 | 1,07 | ||||
| 2025-08-12 | 13F | Cynosure Management, Llc | 161.494 | 25,91 | 3.453 | 19,94 | ||||
| 2025-08-15 | 13F | Morgan Stanley | 741.903 | 0,44 | 15.862 | -4,31 | ||||
| 2025-07-17 | 13F | Janney Montgomery Scott LLC | 39.509 | -43,96 | 1 | -100,00 | ||||
| 2025-09-04 | 13F/A | Advisor Group Holdings, Inc. | 379.671 | 14,07 | 8.117 | 8,68 | ||||
| 2025-08-05 | 13F | Simplex Trading, Llc | 0 | -100,00 | 0 | |||||
| 2025-08-14 | 13F | Financial Advisory Service, Inc. | 422 | 0,00 | 9 | 0,00 | ||||
| 2025-04-23 | 13F | Symphony Financial, Ltd. Co. | 0 | -100,00 | 0 | -100,00 | ||||
| 2025-08-12 | 13F | Pathstone Holdings, LLC | 32.214 | 100,46 | 701 | 94,72 | ||||
| 2025-08-11 | 13F | TD Waterhouse Canada Inc. | 375 | 0,00 | 8 | 0,00 | ||||
| 2025-08-13 | 13F | Cambria Investment Management, L.P. | 0 | -100,00 | 0 | |||||
| 2025-07-28 | 13F | Mutual Advisors, LLC | 17.550 | -11,36 | 392 | -4,85 | ||||
| 2025-05-29 | NP | TFAZX - TFA Tactical Income Fund Class I | 8.400 | 0,00 | 188 | 5,03 | ||||
| 2025-08-13 | 13F | Sumitomo Mitsui Financial Group, Inc. | 14.223 | 0,00 | 304 | -4,70 | ||||
| 2025-08-14 | 13F | Hrt Financial Lp | 0 | -100,00 | 0 | |||||
| 2025-08-14 | 13F | Safeguard Investment Advisory Group, LLC | 0 | -100,00 | 0 | |||||
| 2025-08-27 | NP | RBNAX - Robinson Opportunistic Income Fund Class A Shares | 29.250 | 18,18 | 625 | 12,61 | ||||
| 2025-08-15 | 13F | Captrust Financial Advisors | 31.547 | -1,38 | 674 | -6,00 | ||||
| 2025-08-12 | 13F | J.w. Cole Advisors, Inc. | 15.104 | 323 | ||||||
| 2025-07-25 | 13F | Allspring Global Investments Holdings, LLC | 24.900 | -12,94 | 532 | -17,00 | ||||
| 2025-08-15 | 13F | Prevail Innovative Wealth Advisors, Llc | 111.968 | 14,54 | 2.394 | 9,12 | ||||
| 2025-08-01 | 13F | Envestnet Asset Management Inc | 600.405 | 8,37 | 12.837 | 3,25 | ||||
| 2025-07-24 | 13F | Copperwynd Financial, LLC | 0 | -100,00 | 0 | |||||
| 2025-08-14 | 13F | First Foundation Advisors | 30.064 | -9,29 | 643 | -13,59 | ||||
| 2025-08-13 | 13F | Natixis | 5 | 0,00 | 0 | |||||
| 2025-08-13 | 13F | Manning & Napier Advisors Llc | 33.803 | 0,16 | 723 | -4,62 | ||||
| 2025-08-14 | 13F | Stifel Financial Corp | 10.881 | 233 | ||||||
| 2025-08-18 | 13F | Wolverine Trading, Llc | Call | 22.200 | -20,43 | 471 | -23,66 | |||
| 2025-08-13 | 13F | Twin Peaks Wealth Advisors, LLC | 4.241 | 94 | ||||||
| 2025-08-13 | 13F | Virtus ETF Advisers LLC | 23 | 0 | ||||||
| 2025-08-11 | 13F | Private Advisor Group, LLC | 18.788 | -64,64 | 402 | -66,36 | ||||
| 2025-08-13 | 13F | Jones Financial Companies Lllp | 246 | 0,00 | 5 | 0,00 | ||||
| 2025-07-31 | 13F | Sumitomo Mitsui Trust Holdings, Inc. | 31.279 | 5,88 | 669 | 0,91 | ||||
| 2025-08-13 | 13F | Rsm Us Wealth Management Llc | 54.552 | -14,63 | 1.166 | -18,63 | ||||
| 2025-08-14 | 13F | Two Sigma Investments, Lp | 0 | -100,00 | 0 | |||||
| 2025-08-27 | NP | RYMSX - Guggenheim Multi-Hedge Strategies Fund Class P | Short | -5 | -76,19 | -0 | ||||
| 2025-08-12 | 13F | Jpmorgan Chase & Co | 4.980 | -32,63 | 106 | -35,76 | ||||
| 2025-08-14 | 13F | Bank Of America Corp /de/ | 523.995 | 1,88 | 11.203 | -2,93 | ||||
| 2025-08-14 | 13F | Aster Capital Management (DIFC) Ltd | 148.992 | 3.185 | ||||||
| 2025-07-08 | 13F | Parallel Advisors, LLC | 91 | 0,00 | 2 | -50,00 | ||||
| 2025-06-03 | 13F | Invst, LLC | 25.924 | 33,57 | 582 | 40,34 |
Other Listings
| MX:REM |