Grundlæggende statistik
| Institutionelle ejere | 140 total, 140 long only, 0 short only, 0 long/short - change of 9,38% MRQ |
| Gennemsnitlig porteføljeallokering | 0.8984 % - change of 5,80% MRQ |
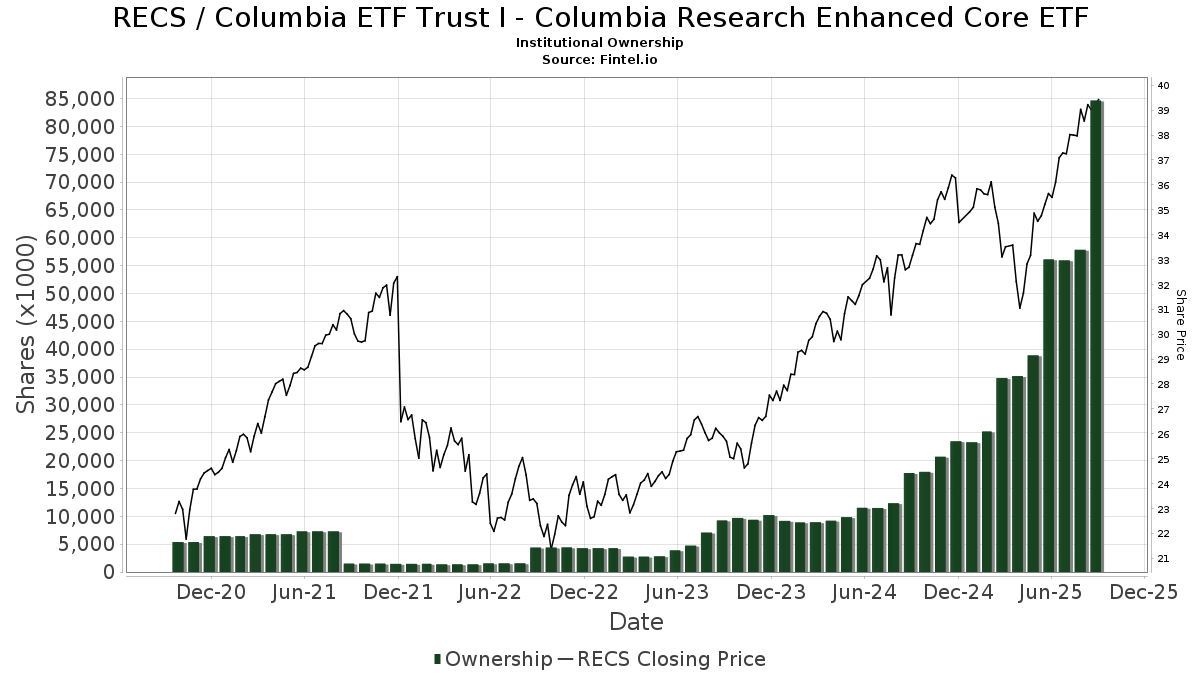
| Institutionelle aktier (lange) | 84.634.179 (ex 13D/G) - change of 28,53MM shares 50,84% MRQ |
| Institutionel værdi (lang) | $ 2.973.135 USD ($1000) |
Institutionelt ejerskab og aktionærer
Columbia ETF Trust I - Columbia Research Enhanced Core ETF (US:RECS) har 140 institutionelle ejere og aktionærer, der har indsendt 13D/G- eller 13F-formularer til Securities Exchange Commission (SEC). Disse institutioner har i alt 84,634,179 aktier. Største aktionærer omfatter Jane Street Group, Llc, Ameriprise Financial Inc, LPL Financial LLC, Bank Of America Corp /de/, Morgan Stanley, Raymond James Financial Inc, CTFAX - Columbia Thermostat Fund Class A, Commonwealth Equity Services, Llc, Gradient Investments LLC, and Fundamentun, Llc .
Columbia ETF Trust I - Columbia Research Enhanced Core ETF (ARCA:RECS) institutionel ejerskabsstruktur viser aktuelle positioner i virksomheden efter institutioner og fonde, samt seneste ændringer i positionsstørrelse. Større aktionærer kan omfatte individuelle investorer, investeringsforeninger, hedgefonde eller institutioner. Skema 13D angiver, at investoren besidder (eller besidder) mere end 5 % af virksomheden og har til hensigt (eller har til hensigt at) aktivt at forfølge en ændring i forretningsstrategi. Skema 13G indikerer en passiv investering på over 5%.
The share price as of September 9, 2025 is 39,18 / share. Previously, on September 9, 2024, the share price was 32,28 / share. This represents an increase of 21,36% over that period.
Fondens stemningsscore
Fund Sentiment Score (fka Ownership Accumulation Score) finder de aktier, der bliver mest købt af fonde. Det er resultatet af en sofistikeret, multi-faktor kvantitativ model, der identificerer virksomheder med de højeste niveauer af institutionel akkumulering. Scoringsmodellen bruger en kombination af den samlede stigning i oplyste ejere, ændringerne i porteføljeallokeringer i disse ejere og andre målinger. Tallet går fra 0 til 100, hvor højere tal indikerer et højere niveau af akkumulering for sine jævnaldrende, og 50 er gennemsnittet.
Opdateringsfrekvens: Dagligt
Se Ownership Explorer, som giver en liste over højest rangerende virksomheder.
Institutionel Put/Call-forhold
Ud over at indberette standardaktie- og gældsudstedelser skal institutter med mere end 100 mill. aktiver under forvaltning også oplyse deres put- og call-optionsbeholdninger. Da salgsoptioner generelt indikerer negativ stemning, og købsoptioner indikerer positiv stemning, kan vi få en fornemmelse af den overordnede institutionelle stemning ved at plotte forholdet mellem put og kald. Diagrammet til højre viser det historiske put/call-forhold for dette instrument.
Brug af Put/Call Ratio som en indikator for investorernes stemning overvinder en af de vigtigste mangler ved at bruge totalt institutionelt ejerskab, som er, at en betydelig mængde af aktiver under forvaltning investeres passivt for at spore indekser. Passivt forvaltede fonde køber typisk ikke optioner, så indikatoren for put/call-forholdet følger mere nøje følelsen af aktivt forvaltede fonde.
13F og NPORT arkivering
Detaljer om 13F-arkivering er gratis. Detaljer om NP-ansøgninger kræver et premium-medlemskab. Grønne rækker angiver nye positioner. Røde rækker angiver lukkede positioner. Klik på linket ikon for at se den fulde transaktionshistorik.
Opgrader
for at låse premium-data op og eksportere til Excel ![]() .
.
| Fil dato | Kilde | Investor | Type | Gennemsnitlig pris (Øst) |
Aktier | Δ Aktier (%) |
Rapporteret Værdi ($1000) |
Δ Værdi (%) |
Port Alloc (%) |
|
|---|---|---|---|---|---|---|---|---|---|---|
| 2025-07-29 | 13F | Stratos Wealth Partners, LTD. | 1.511.634 | -1,17 | 55.613 | 9,48 | ||||
| 2025-08-12 | 13F | Jpmorgan Chase & Co | 685.926 | 8,83 | 25.235 | 20,56 | ||||
| 2025-08-14 | 13F | Great Valley Advisor Group, Inc. | 14.303 | -91,10 | 526 | -90,14 | ||||
| 2025-07-23 | 13F | Heck Capital Advisors, LLC | 461.922 | 16.994 | ||||||
| 2025-07-29 | 13F | Fundamentun, Llc | 1.978.098 | 4,39 | 72.774 | 15,64 | ||||
| 2025-08-13 | 13F | Northwestern Mutual Wealth Management Co | 110.244 | -46,99 | 4.056 | -41,28 | ||||
| 2025-08-14 | 13F | Royal Bank Of Canada | 477.034 | -16,81 | 17.551 | -7,83 | ||||
| 2025-08-14 | 13F | LM Advisors LLC | 40.568 | 2,56 | 1 | 0,00 | ||||
| 2025-08-14 | 13F | Bank Of America Corp /de/ | 4.425.196 | -10,10 | 162.803 | -0,40 | ||||
| 2025-07-17 | 13F | Janney Montgomery Scott LLC | 18.761 | 51,27 | 1 | |||||
| 2025-07-25 | 13F | Retirement Planning Group, Llc / Ny | 90.043 | 41,28 | 3.313 | 56,52 | ||||
| 2025-08-14 | 13F | Jane Street Group, Llc | 16.658.312 | 49.303,34 | 612.859 | 54.668,45 | ||||
| 2025-07-23 | 13F | Morey & Quinn Wealth Partners, LLC | 19.785 | 26,95 | 728 | 40,62 | ||||
| 2025-07-02 | 13F | Capital Market Strategies LLC | 10.558 | 388 | ||||||
| 2025-07-09 | 13F | WealthCare Investment Partners, LLC | 23.778 | 15,46 | 889 | 41,85 | ||||
| 2025-08-12 | 13F | Richmond Investment Services, LLC | 68.148 | 102,91 | 2.507 | 124,84 | ||||
| 2025-08-14 | 13F | Mml Investors Services, Llc | 374.045 | 6,36 | 14 | 18,18 | ||||
| 2025-08-04 | 13F | Amplius Wealth Advisors, LLC | 1.533.039 | 1,36 | 56.396 | 12,27 | ||||
| 2025-08-08 | 13F | Cetera Investment Advisers | 258.054 | -24,01 | 9.494 | -15,82 | ||||
| 2025-08-14 | 13F | Comerica Bank | 4.737 | -26,38 | 174 | -18,31 | ||||
| 2025-08-08 | 13F | Avantax Advisory Services, Inc. | 220.971 | 173,50 | 8.130 | 202,98 | ||||
| 2025-07-29 | 13F | Stratos Wealth Advisors, LLC | 8.856 | 326 | ||||||
| 2025-08-13 | 13F | MONECO Advisors, LLC | 5.921 | -6,24 | 218 | 3,83 | ||||
| 2025-08-08 | 13F | Comprehensive Financial Planning, Inc./PA | 1.007 | -6,33 | 37 | 5,71 | ||||
| 2025-08-07 | 13F | Fidelis Capital Partners, LLC | 49.943 | 1.896 | ||||||
| 2025-08-22 | NP | CTFAX - Columbia Thermostat Fund Class A | 2.732.920 | 125,79 | 100.544 | 150,13 | ||||
| 2025-07-21 | 13F | Ameritas Advisory Services, LLC | 70.820 | 102,04 | 2.605 | 115,82 | ||||
| 2025-07-21 | 13F | DHJJ Financial Advisors, Ltd. | 5 | 0,00 | 0 | |||||
| 2025-07-29 | 13F | Empirical Asset Management, LLC | 69.125 | 1,37 | 2.543 | 12,32 | ||||
| 2025-08-14 | 13F | Wiley Bros.-aintree Capital, Llc | 20.580 | 13,53 | 757 | 26,59 | ||||
| 2025-08-14 | 13F | Graney & King, LLC | 5.447 | 444,70 | 200 | 506,06 | ||||
| 2025-08-14 | 13F | Byrne Financial Freedom, Llc | 73.933 | 328,75 | 2.720 | 375,35 | ||||
| 2025-08-06 | 13F | Commonwealth Equity Services, Llc | 2.517.266 | 77,26 | 93 | 95,74 | ||||
| 2025-08-13 | 13F | Dana Investment Advisors, Inc. | 18.951 | 63,55 | 697 | 81,51 | ||||
| 2025-08-18 | 13F | Tyler-Stone Wealth Management | 10.264 | 0,98 | 378 | 11,87 | ||||
| 2025-07-17 | 13F | Archford Capital Strategies, LLC | 269.439 | 2,56 | 9.913 | 13,60 | ||||
| 2025-08-04 | 13F | Assetmark, Inc | 117 | 4 | ||||||
| 2025-07-18 | 13F | Truist Financial Corp | 8.231 | 30,82 | 303 | 45,19 | ||||
| 2025-07-23 | 13F | RiverTree Advisors, LLC | 8.180 | -5,92 | 301 | 4,17 | ||||
| 2025-08-06 | 13F | Mark Sheptoff Financial Planning, Llc | 385 | 0,00 | 14 | 16,67 | ||||
| 2025-08-05 | 13F | Scarborough Advisors, LLC | 567.951 | 30,34 | 20.895 | 44,39 | ||||
| 2025-08-04 | 13F | Daymark Wealth Partners, Llc | 720.517 | 14,10 | 26.508 | 26,40 | ||||
| 2025-08-11 | 13F | Trajan Wealth LLC | 555.620 | 0,12 | 20.441 | 10,92 | ||||
| 2025-08-05 | 13F | Snider Financial Group | 123.818 | 4.555 | ||||||
| 2025-08-13 | 13F | Balance Wealth, LLC | 54.725 | -81,88 | 2.013 | -79,93 | ||||
| 2025-07-15 | 13F | Palumbo Wealth Management LLC | 11.916 | 438 | ||||||
| 2025-07-30 | 13F | Bogart Wealth, LLC | 196.458 | 7,83 | 7.228 | 19,45 | ||||
| 2025-08-14 | 13F | Atomi Financial Group, Inc. | 7.061 | 260 | ||||||
| 2025-08-11 | 13F | Citigroup Inc | 65.065 | 1.517,73 | 2.394 | 1.699,25 | ||||
| 2025-07-23 | 13F | Drake & Associates, LLC | 840.273 | 4,37 | 30.914 | 15,61 | ||||
| 2025-08-19 | 13F | Advisory Services Network, LLC | 63.469 | 8,08 | 2.394 | 22,77 | ||||
| 2025-07-28 | 13F | Tower Wealth Partners, Inc. | 492.981 | 3,98 | 18.137 | 15,19 | ||||
| 2025-07-17 | 13F | KWB Wealth | 236.281 | 57,88 | 7.847 | 51,44 | ||||
| 2025-08-11 | 13F | Private Advisor Group, LLC | 112.533 | 3,26 | 4.140 | 14,40 | ||||
| 2025-08-06 | 13F | Golden State Wealth Management, LLC | 0 | -100,00 | 0 | -100,00 | ||||
| 2025-08-13 | 13F | Marshall Wace, Llp | 94.953 | 3.493 | ||||||
| 2025-08-15 | 13F | Morgan Stanley | 3.401.063 | 41,84 | 125.125 | 57,13 | ||||
| 2025-05-15 | 13F | Ameriflex Group, Inc. | 0 | -100,00 | 0 | |||||
| 2025-08-08 | 13F | Thoroughbred Financial Services, Llc | 29.108 | 10,73 | 1 | |||||
| 2025-08-13 | 13F | Copley Financial Group, Inc. | 6.643 | -5,61 | 244 | 4,72 | ||||
| 2025-04-07 | 13F | AdvisorNet Financial, Inc | 0 | -100,00 | 0 | |||||
| 2025-08-12 | 13F | BlueStem Wealth Partners, LLC | 1.062.939 | -32,72 | 39.106 | -25,47 | ||||
| 2025-05-09 | 13F | Goldman Sachs Group Inc | 0 | -100,00 | 0 | |||||
| 2025-08-05 | 13F | Mma Asset Management Llc | 24.955 | -8,73 | 918 | 1,10 | ||||
| 2025-09-04 | 13F/A | Advisor Group Holdings, Inc. | 637.841 | 108,52 | 23.465 | 131,00 | ||||
| 2025-08-11 | 13F | Western Wealth Management, LLC | 110.174 | 3,02 | 4.053 | 14,14 | ||||
| 2025-08-11 | 13F | Advisor Resource Council | 0 | -100,00 | 0 | |||||
| 2025-08-12 | 13F | Spectrum Wealth Advisory Group, LLC | 837.922 | -16,48 | 30.827 | -7,47 | ||||
| 2025-07-29 | 13F | Private Trust Co Na | 3.475 | 128 | ||||||
| 2025-07-29 | 13F | Riverbend Wealth Management, LLC | 14.803 | 38,60 | 545 | 53,67 | ||||
| 2025-07-11 | 13F | SILVER OAK SECURITIES, Inc | 80.568 | 2,77 | 2.964 | 14,57 | ||||
| 2025-08-13 | 13F | Denver Wealth Management, Inc. | 30.795 | 23,55 | 1.133 | 36,88 | ||||
| 2025-08-14 | 13F | Fmr Llc | 2.182 | 114,13 | 80 | 142,42 | ||||
| 2025-07-15 | 13F | Oxinas Partners Wealth Management LLC | 22.200 | 0,00 | 817 | 10,72 | ||||
| 2025-08-29 | 13F | Centaurus Financial, Inc. | 385.922 | 2,64 | 14 | 16,67 | ||||
| 2025-07-07 | 13F | RDA Financial Network | 105.535 | 6,41 | 3.883 | 17,89 | ||||
| 2025-08-14 | 13F | Paragon Private Wealth Management, LLC | 57.620 | 12,59 | 2.120 | 24,72 | ||||
| 2025-07-29 | 13F | Activest Wealth Management | 0 | 0 | ||||||
| 2025-08-12 | 13F | Proequities, Inc. | 0 | 0 | ||||||
| 2025-07-31 | 13F | Cambridge Investment Research Advisors, Inc. | 240.780 | 12,60 | 9 | 14,29 | ||||
| 2025-08-14 | 13F | Ameriprise Financial Inc | 12.963.845 | 22,35 | 476.940 | 35,54 | ||||
| 2025-07-09 | 13F | Fiduciary Alliance LLC | 6.883 | -11,30 | 253 | -1,56 | ||||
| 2025-07-16 | 13F | Perigon Wealth Management, LLC | 6.927 | 10,64 | 255 | 22,71 | ||||
| 2025-07-22 | 13F | DAVENPORT & Co LLC | 131.024 | 90,96 | 4.820 | 111,59 | ||||
| 2025-05-08 | 13F | Us Bancorp \de\ | 0 | -100,00 | 0 | |||||
| 2025-07-25 | 13F | Atria Wealth Solutions, Inc. | 55.103 | 62,11 | 2.027 | 79,70 | ||||
| 2025-08-06 | 13F/A | Three Cord True Wealth Management, LLC | 523.209 | 7,65 | 19.249 | 19,25 | ||||
| 2025-08-13 | 13F | Renaissance Technologies Llc | 27.900 | 1.026 | ||||||
| 2025-08-14 | 13F | Raymond James Financial Inc | 3.167.950 | 15,28 | 116.549 | 27,70 | ||||
| 2025-08-14 | 13F | Dagco, Inc. | 80.985 | 25,84 | 2.979 | 39,40 | ||||
| 2025-05-15 | 13F | Old Mission Capital Llc | 0 | -100,00 | 0 | |||||
| 2025-08-01 | 13F | Envestnet Asset Management Inc | 65.696 | 14,49 | 2.417 | 26,82 | ||||
| 2025-08-06 | 13F | Bensler, LLC | 227.616 | 3,67 | 8.374 | 14,84 | ||||
| 2025-07-08 | 13F | Paladin Wealth, LLC | 60.269 | 2,85 | 2.217 | 13,93 | ||||
| 2025-07-31 | 13F | Mason & Associates Inc | 1.029.239 | 37.866 | ||||||
| 2025-08-04 | 13F | Creative Financial Designs Inc /adv | 36 | 1 | ||||||
| 2025-07-31 | 13F | Richards, Merrill & Peterson, Inc. | 0 | -100,00 | 0 | |||||
| 2025-07-22 | 13F | USAdvisors Wealth Management, LLC | 160.450 | 5,13 | 6 | 0,00 | ||||
| 2025-08-14 | 13F | Keystone Financial Services, LLC | 6.698 | 246 | ||||||
| 2025-05-12 | 13F | Independent Advisor Alliance | 0 | -100,00 | 0 | |||||
| 2025-08-04 | 13F | Atria Investments Llc | 190.216 | 6,16 | 6.998 | 17,61 | ||||
| 2025-08-14 | 13F | Two Sigma Investments, Lp | 603.600 | 544,87 | 22.206 | 614,48 | ||||
| 2025-07-15 | 13F | Axis Wealth Partners, LLC | 33.241 | 13,75 | 1.223 | 25,98 | ||||
| 2025-08-18 | 13F | Arq Wealth Advisors, Llc | 214.206 | 0,00 | 7.114 | 0,00 | ||||
| 2025-08-15 | 13F | Kestra Advisory Services, LLC | 145.845 | 36,98 | 5.366 | 51,77 | ||||
| 2025-05-01 | 13F | Fulcrum Equity Management | 0 | -100,00 | 0 | |||||
| 2025-08-12 | 13F | LPL Financial LLC | 10.820.984 | 20,41 | 398.104 | 33,38 | ||||
| 2025-08-13 | 13F | Jones Financial Companies Lllp | 230.633 | 41,60 | 8.455 | 57,27 | ||||
| 2025-08-14 | 13F | Susquehanna International Group, Llp | 55.754 | -51,17 | 2.051 | -45,91 | ||||
| 2025-07-10 | 13F | Sovran Advisors, LLC | 92.334 | 33,27 | 3.417 | 58,86 | ||||
| 2025-08-08 | 13F | Larson Financial Group LLC | 2.277 | -39,92 | 84 | -33,60 | ||||
| 2025-08-14 | 13F | UBS Group AG | 366.954 | 159,97 | 13.500 | 188,03 | ||||
| 2025-08-14 | 13F | Citadel Advisors Llc | 17.151 | 16,67 | 631 | 29,10 | ||||
| 2025-08-14 | 13F | Integrated Wealth Concepts LLC | 5.912 | 218 | ||||||
| 2025-08-11 | 13F | Principal Securities, Inc. | 24.351 | 125,26 | 896 | 139,30 | ||||
| 2025-08-05 | 13F | Flynn Zito Capital Management, Llc | 155.216 | -0,15 | 5.710 | 10,62 | ||||
| 2025-08-15 | 13F | Equitable Holdings, Inc. | 12.430 | 85,52 | 457 | 105,86 | ||||
| 2025-08-13 | 13F | Congress Wealth Management LLC / DE / | 99.278 | 10,30 | 3.652 | 22,18 | ||||
| 2025-08-07 | 13F | Kestra Private Wealth Services, Llc | 241.380 | 34,51 | 8.880 | 49,02 | ||||
| 2025-08-07 | 13F | Allworth Financial LP | 1.961 | 38,39 | 72 | 60,00 | ||||
| 2025-08-12 | 13F | Global Retirement Partners, LLC | 2.732 | 2,32 | 101 | 8,70 | ||||
| 2025-08-12 | 13F | Gladstone Institutional Advisory LLC | 491.805 | 22,81 | 18.094 | 36,05 | ||||
| 2025-08-19 | 13F | National Asset Management, Inc. | 31.536 | 16,06 | 1.160 | 23,40 | ||||
| 2025-08-05 | 13F | Smith Shellnut Wilson Llc /adv | 23.069 | 22,94 | 849 | 36,12 | ||||
| 2025-04-24 | NP | NSGAX - Columbia Select Large Cap Equity Fund Class A | 43.258 | -60,52 | 1.520 | -61,51 | ||||
| 2025-07-08 | 13F | Gradient Investments LLC | 2.031.726 | 1,17 | 74.747 | 12,08 | ||||
| 2025-07-09 | 13F | Fermata Advisors, LLC | 101.501 | -0,73 | 3.734 | 9,99 | ||||
| 2025-08-14 | 13F | CoreCap Advisors, LLC | 106 | 0,00 | 4 | 0,00 | ||||
| 2025-07-10 | 13F | Wealth Enhancement Advisory Services, Llc | 320.671 | 394,61 | 11.983 | 456,57 | ||||
| 2025-07-31 | 13F | Leavell Investment Management, Inc. | 125.694 | 39,50 | 4.624 | 54,55 | ||||
| 2025-07-30 | 13F/A | KPP Advisory Services LLC | 45.678 | 196,11 | 1.680 | 228,13 | ||||
| 2025-08-12 | 13F | Cornerstone Wealth Management, LLC | 14.683 | 12,12 | 540 | 24,42 | ||||
| 2025-08-12 | 13F | SRS Capital Advisors, Inc. | 2.376 | -23,67 | 87 | -15,53 | ||||
| 2025-07-09 | 13F | Pines Wealth Management, LLC | 35.328 | 9,89 | 1.320 | 39,68 | ||||
| 2025-07-29 | 13F | Mattson Financial Services, LLC | 64.709 | -5,47 | 2.381 | 4,71 | ||||
| 2025-08-14 | 13F | Wells Fargo & Company/mn | 1.522.931 | 67,65 | 56.029 | 85,72 | ||||
| 2025-08-14 | 13F | GWM Advisors LLC | 357.751 | -0,73 | 13.162 | 9,97 | ||||
| 2025-07-28 | 13F | Harbour Investments, Inc. | 8.201 | 13,12 | 302 | 25,42 | ||||
| 2025-07-16 | 13F | Essex Financial Services, Inc. | 213.424 | 22,60 | 7.852 | 35,81 | ||||
| 2025-07-25 | 13F | Cwm, Llc | 196 | 0,00 | 0 | |||||
| 2025-08-15 | 13F | Brown Financial Advisors | 115.356 | -2,38 | 4.244 | 8,13 | ||||
| 2025-08-04 | 13F | Pensionmark Financial Group, Llc | 152.094 | -0,83 | 5.596 | 9,86 | ||||
| 2025-08-01 | 13F | PCA Investment Advisory Services Inc. | 17.464 | 24,71 | 643 | 38,06 | ||||
| 2025-04-17 | 13F | Tcfg Wealth Management, Llc | 0 | -100,00 | 0 | |||||
| 2025-08-13 | 13F | IAG Wealth Partners, LLC | 296.568 | 143,19 | 10.911 | 169,45 | ||||
| 2025-08-14 | 13F | Stifel Financial Corp | 179.979 | 898,88 | 6.621 | 1.007,19 | ||||
| 2025-07-30 | 13F | Prosperity Financial Group, Inc. | 39.656 | 32,34 | 1.459 | 46,53 | ||||
| 2025-08-12 | 13F | Inscription Capital, LLC | 39.399 | 1.449 | ||||||
| 2025-08-14 | 13F | Mariner, LLC | 126.650 | 31,44 | 4.659 | 45,59 | ||||
| 2025-08-01 | 13F | Y-Intercept (Hong Kong) Ltd | 22.849 | 841 | ||||||
| 2025-07-16 | 13F | Spirepoint Private Client, Llc | 64.672 | -8,88 | 2.379 | 0,93 | ||||
| 2025-06-25 | NP | LEGAX - Columbia Large Cap Growth Fund Class A | 169.788 | -50,53 | 5.572 | -54,33 | ||||
| 2025-08-12 | 13F | Steward Partners Investment Advisory, Llc | 90.084 | 13,78 | 3.314 | 26,06 |