Grundlæggende statistik
| Institutionelle ejere | 170 total, 170 long only, 0 short only, 0 long/short - change of 4,29% MRQ |
| Gennemsnitlig porteføljeallokering | 0.1441 % - change of -8,84% MRQ |
| Institutionelle aktier (lange) | 12.099.795 (ex 13D/G) - change of 0,57MM shares 4,93% MRQ |
| Institutionel værdi (lang) | $ 702.460 USD ($1000) |
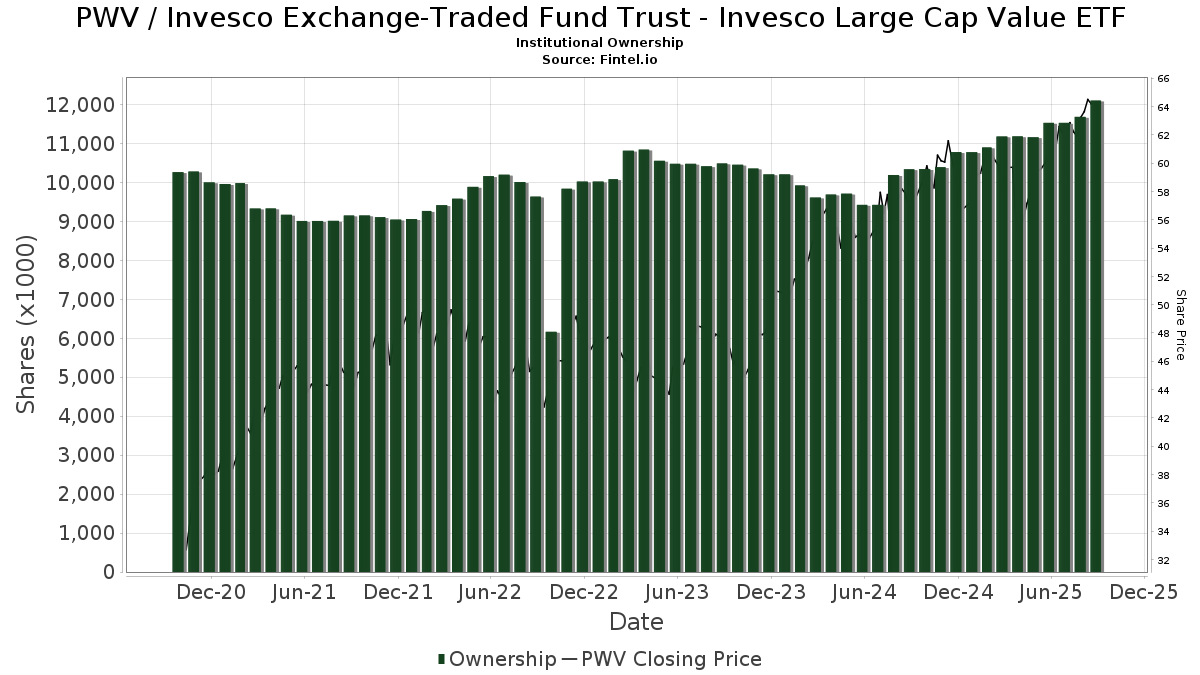
Institutionelt ejerskab og aktionærer
Invesco Exchange-Traded Fund Trust - Invesco Large Cap Value ETF (US:PWV) har 170 institutionelle ejere og aktionærer, der har indsendt 13D/G- eller 13F-formularer til Securities Exchange Commission (SEC). Disse institutioner har i alt 12,099,795 aktier. Største aktionærer omfatter Morgan Stanley, LPL Financial LLC, Bank Of America Corp /de/, Pnc Financial Services Group, Inc., UBS Group AG, Commonwealth Equity Services, Llc, Atlas Private Wealth Advisors, IAG Wealth Partners, LLC, Raymond James Financial Inc, and Envestnet Asset Management Inc .
Invesco Exchange-Traded Fund Trust - Invesco Large Cap Value ETF (ARCA:PWV) institutionel ejerskabsstruktur viser aktuelle positioner i virksomheden efter institutioner og fonde, samt seneste ændringer i positionsstørrelse. Større aktionærer kan omfatte individuelle investorer, investeringsforeninger, hedgefonde eller institutioner. Skema 13D angiver, at investoren besidder (eller besidder) mere end 5 % af virksomheden og har til hensigt (eller har til hensigt at) aktivt at forfølge en ændring i forretningsstrategi. Skema 13G indikerer en passiv investering på over 5%.
The share price as of September 15, 2025 is 64,55 / share. Previously, on September 16, 2024, the share price was 57,97 / share. This represents an increase of 11,35% over that period.
Fondens stemningsscore
Fund Sentiment Score (fka Ownership Accumulation Score) finder de aktier, der bliver mest købt af fonde. Det er resultatet af en sofistikeret, multi-faktor kvantitativ model, der identificerer virksomheder med de højeste niveauer af institutionel akkumulering. Scoringsmodellen bruger en kombination af den samlede stigning i oplyste ejere, ændringerne i porteføljeallokeringer i disse ejere og andre målinger. Tallet går fra 0 til 100, hvor højere tal indikerer et højere niveau af akkumulering for sine jævnaldrende, og 50 er gennemsnittet.
Opdateringsfrekvens: Dagligt
Se Ownership Explorer, som giver en liste over højest rangerende virksomheder.
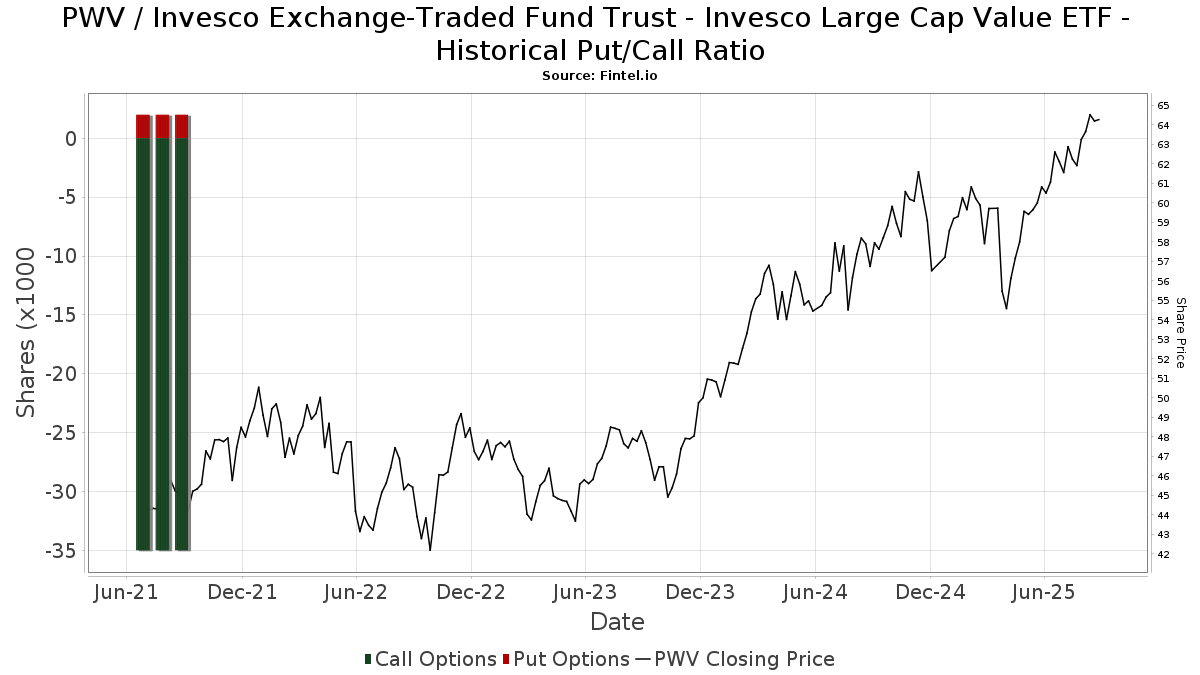
Institutionel Put/Call-forhold
Ud over at indberette standardaktie- og gældsudstedelser skal institutter med mere end 100 mill. aktiver under forvaltning også oplyse deres put- og call-optionsbeholdninger. Da salgsoptioner generelt indikerer negativ stemning, og købsoptioner indikerer positiv stemning, kan vi få en fornemmelse af den overordnede institutionelle stemning ved at plotte forholdet mellem put og kald. Diagrammet til højre viser det historiske put/call-forhold for dette instrument.
Brug af Put/Call Ratio som en indikator for investorernes stemning overvinder en af de vigtigste mangler ved at bruge totalt institutionelt ejerskab, som er, at en betydelig mængde af aktiver under forvaltning investeres passivt for at spore indekser. Passivt forvaltede fonde køber typisk ikke optioner, så indikatoren for put/call-forholdet følger mere nøje følelsen af aktivt forvaltede fonde.
13F og NPORT arkivering
Detaljer om 13F-arkivering er gratis. Detaljer om NP-ansøgninger kræver et premium-medlemskab. Grønne rækker angiver nye positioner. Røde rækker angiver lukkede positioner. Klik på linket ikon for at se den fulde transaktionshistorik.
Opgrader
for at låse premium-data op og eksportere til Excel ![]() .
.
| Fil dato | Kilde | Investor | Type | Gennemsnitlig pris (Øst) |
Aktier | Δ Aktier (%) |
Rapporteret Værdi ($1000) |
Δ Værdi (%) |
Port Alloc (%) |
|
|---|---|---|---|---|---|---|---|---|---|---|
| 2025-08-08 | 13F | Cetera Investment Advisers | 75.311 | 103,85 | 4.680 | 112,88 | ||||
| 2025-08-08 | 13F | Capital Investment Advisory Services, LLC | 670 | 0,00 | 42 | 5,13 | ||||
| 2025-07-28 | 13F | Nestegg Advisors, Inc. | 3.630 | 0,72 | 226 | 5,14 | ||||
| 2025-08-12 | 13F | DiMeo Schneider & Associates, L.L.C. | 15.465 | 0,00 | 961 | 4,35 | ||||
| 2025-08-12 | 13F | BlackRock, Inc. | 2.000 | 0,00 | 124 | 4,20 | ||||
| 2025-08-12 | 13F | Howe & Rusling Inc | 2.694 | 167 | ||||||
| 2025-08-14 | 13F | Bnp Paribas Arbitrage, Sa | 10.000 | -50,00 | 621 | -47,82 | ||||
| 2025-07-10 | 13F | Wealth Enhancement Advisory Services, Llc | 24.258 | 241,18 | 1.526 | 260,76 | ||||
| 2025-08-14 | 13F | Bank Of America Corp /de/ | 774.088 | 20,94 | 48.102 | 26,29 | ||||
| 2025-08-14 | 13F | Comerica Bank | 15.471 | -7,17 | 961 | -3,03 | ||||
| 2025-08-12 | 13F | Franklin Resources Inc | 299 | 0,00 | 19 | 5,88 | ||||
| 2025-08-05 | 13F | AGH Wealth Advisors, LLC | 46.317 | 0,83 | 2.879 | 5,27 | ||||
| 2025-08-08 | 13F | Emerald Investment Partners, Llc | 5.953 | -10,79 | 370 | -7,05 | ||||
| 2025-07-10 | 13F | Wedmont Private Capital | 6.223 | 0,00 | 386 | 14,20 | ||||
| 2025-08-14 | 13F | Beacon Investment Advisors Llc | 4.095 | -0,68 | 253 | 2,86 | ||||
| 2025-07-24 | 13F | JNBA Financial Advisors | 20.777 | -2,29 | 1.291 | 2,06 | ||||
| 2025-08-11 | 13F | Western Wealth Management, LLC | 16.368 | -0,30 | 1.017 | 4,09 | ||||
| 2025-08-12 | 13F | O'shaughnessy Asset Management, Llc | 292 | 0,00 | 18 | 5,88 | ||||
| 2025-07-18 | 13F | SimpliFi, Inc. | 9.003 | 0,72 | 559 | 5,27 | ||||
| 2025-07-22 | 13F | IVC Wealth Advisors LLC | 4.290 | 0,00 | 267 | 4,31 | ||||
| 2025-08-12 | 13F | Global Retirement Partners, LLC | 1.552 | 0,00 | 96 | 9,09 | ||||
| 2025-08-11 | 13F | HighTower Advisors, LLC | 16.215 | -0,47 | 1.008 | 3,92 | ||||
| 2025-08-14 | 13F | EP Wealth Advisors, Inc. | 3.155 | 0,00 | 196 | 4,81 | ||||
| 2025-08-14 | 13F | Paragon Private Wealth Management, LLC | 14.265 | 0,00 | 886 | 4,48 | ||||
| 2025-08-12 | 13F | Steward Partners Investment Advisory, Llc | 1.536 | 0,00 | 95 | 4,40 | ||||
| 2025-07-24 | 13F | Eastern Bank | 1.710 | 0,00 | 106 | 4,95 | ||||
| 2025-07-08 | 13F | Morris Retirement Advisors, LLC | 3.675 | 0,55 | 228 | 5,07 | ||||
| 2025-08-14 | 13F | Harmony Asset Management Llc | 8.329 | 0,23 | 518 | 4,66 | ||||
| 2025-08-08 | 13F | Creative Planning | 9.765 | 0,05 | 607 | 4,48 | ||||
| 2025-08-18 | 13F | Geneos Wealth Management Inc. | 6.932 | 0,06 | 431 | 4,37 | ||||
| 2025-07-18 | 13F | Consolidated Planning Corp | 16.251 | -0,71 | 1.010 | 3,59 | ||||
| 2025-08-14 | 13F | Susquehanna International Group, Llp | 0 | -100,00 | 0 | |||||
| 2025-07-14 | 13F | Ridgewood Investments LLC | 350 | 0,00 | 22 | 5,00 | ||||
| 2025-08-08 | 13F | Good Life Advisors, LLC | 85.573 | 10,50 | 5.317 | 15,39 | ||||
| 2025-08-11 | 13F | Private Advisor Group, LLC | 18.662 | 2,44 | 1.160 | 6,92 | ||||
| 2025-08-14 | 13F | Qube Research & Technologies Ltd | 40 | 0,00 | 2 | 0,00 | ||||
| 2025-08-08 | 13F | Condor Capital Management | 14.937 | 0,00 | 928 | 4,50 | ||||
| 2025-08-15 | 13F | Kestra Advisory Services, LLC | 153.455 | 9,09 | 9.536 | 13,92 | ||||
| 2025-08-15 | 13F | Cooksen Wealth, LLC | 51.511 | -1,53 | 3.201 | 7,96 | ||||
| 2025-09-04 | 13F | Beacon Capital Management, Inc. | 1.023 | 64 | ||||||
| 2025-07-24 | 13F | MSH Capital Advisors LLC | 11.887 | -12,32 | 739 | -8,44 | ||||
| 2025-08-12 | 13F | LPL Financial LLC | 1.371.551 | 12,39 | 85.228 | 17,36 | ||||
| 2025-08-07 | 13F | Alpha Cubed Investments, LLC | 5.371 | 18,49 | 334 | 23,79 | ||||
| 2025-07-31 | 13F | Cambridge Investment Research Advisors, Inc. | 77.601 | 33,39 | 5 | 33,33 | ||||
| 2025-07-17 | 13F | Greenleaf Trust | 5.388 | 0,00 | 335 | 4,38 | ||||
| 2025-07-31 | 13F | Oak Harbor Wealth Partners, Llc | 1.175 | 0,00 | 73 | 5,80 | ||||
| 2025-08-14 | 13F | Mercer Global Advisors Inc /adv | 18.658 | -2,09 | 1.159 | 2,20 | ||||
| 2025-07-24 | 13F | IFP Advisors, Inc | 200 | 0,00 | 12 | 9,09 | ||||
| 2025-07-24 | 13F | Blair William & Co/il | 1.325 | -1,85 | 82 | 2,50 | ||||
| 2025-08-08 | 13F | Hartland & Co., LLC | 8.133 | 0,17 | 505 | 4,55 | ||||
| 2025-08-12 | 13F | J.w. Cole Advisors, Inc. | 5.340 | -5,99 | 332 | -2,07 | ||||
| 2025-08-13 | 13F | IAG Wealth Partners, LLC | 310.057 | 6,90 | 19.267 | 11,63 | ||||
| 2025-08-13 | 13F | Cerity Partners LLC | 4.407 | 0,23 | 274 | 4,60 | ||||
| 2025-07-22 | 13F | Grimes & Company, Inc. | 3.871 | 0,00 | 241 | 4,35 | ||||
| 2025-07-25 | 13F | Cwm, Llc | 2.396 | 0,67 | 0 | |||||
| 2025-08-06 | 13F | Commonwealth Equity Services, Llc | 479.940 | 6,93 | 30 | 11,54 | ||||
| 2025-08-15 | 13F | Morgan Stanley | 3.735.207 | 0,05 | 232.106 | 4,47 | ||||
| 2025-07-21 | 13F | Ameritas Advisory Services, LLC | 14.963 | -40,37 | 930 | -35,62 | ||||
| 2025-08-13 | 13F | Northwestern Mutual Wealth Management Co | 23.909 | 6,09 | 1.486 | 10,74 | ||||
| 2025-08-14 | 13F | Evercore Wealth Management, LLC | 17.782 | 0,00 | 1.105 | 4,35 | ||||
| 2025-07-11 | 13F | Farther Finance Advisors, LLC | 4.129 | 8,49 | 257 | 13,78 | ||||
| 2025-08-14 | 13F | Royal Bank Of Canada | 141.194 | -4,49 | 8.774 | -0,27 | ||||
| 2025-07-18 | 13F | Institute for Wealth Management, LLC. | 14.314 | -2,05 | 889 | 2,30 | ||||
| 2025-08-07 | 13F | Resources Investment Advisors, LLC. | 4.207 | -13,08 | 261 | -9,37 | ||||
| 2025-08-14 | 13F | Wharton Business Group, LLC | 170.370 | -4,88 | 11 | 0,00 | ||||
| 2025-07-08 | 13F | Parallel Advisors, LLC | 35.150 | 0,00 | 2.184 | 4,45 | ||||
| 2025-09-04 | 13F/A | Advisor Group Holdings, Inc. | 126.878 | 8,11 | 7.886 | 12,88 | ||||
| 2025-08-15 | 13F | Tower Research Capital LLC (TRC) | 737 | -31,76 | 46 | -29,69 | ||||
| 2025-07-16 | 13F | Wealth Group Ltd | 3.300 | 205 | ||||||
| 2025-08-04 | 13F | Assetmark, Inc | 413 | 0,00 | 26 | 4,17 | ||||
| 2025-05-13 | 13F | PFG Private Wealth Management, LLC | 0 | -100,00 | 0 | |||||
| 2025-08-14 | 13F | Wells Fargo & Company/mn | 174.323 | 11,81 | 10.832 | 16,75 | ||||
| 2025-08-08 | 13F | Tanglewood Legacy Advisors, LLC | 517 | 0,00 | 32 | 6,67 | ||||
| 2025-07-15 | 13F | MCF Advisors LLC | 6.500 | 0,00 | 404 | 4,40 | ||||
| 2025-08-14 | 13F | Main Street Financial Solutions, LLC | 39.322 | -0,25 | 2.443 | 4,13 | ||||
| 2025-07-29 | 13F | Goldstein Advisors, LLC | 4.460 | 0,00 | 277 | 4,53 | ||||
| 2025-08-14 | 13F | Garden State Investment Advisory Services LLC | 3.630 | 0,39 | 226 | 4,65 | ||||
| 2025-08-13 | 13F | Northern Trust Corp | 0 | -100,00 | 0 | |||||
| 2025-08-06 | 13F | Prospera Financial Services Inc | 7.576 | -0,24 | 471 | 4,21 | ||||
| 2025-08-14 | 13F | GWM Advisors LLC | 247 | -55,33 | 15 | -53,12 | ||||
| 2025-08-13 | 13F | Summit Financial, LLC | 4.619 | 287 | ||||||
| 2025-08-14 | 13F | Ameriprise Financial Inc | 56.163 | -3,37 | 3.490 | 0,90 | ||||
| 2025-08-06 | 13F | AE Wealth Management LLC | 1.192 | 0,00 | 74 | 5,71 | ||||
| 2025-05-15 | 13F | Newbridge Financial Services Group, Inc. | 0 | -100,00 | 0 | |||||
| 2025-07-08 | 13F | Nbc Securities, Inc. | 650 | 0,00 | 0 | |||||
| 2025-07-29 | 13F | Private Trust Co Na | 3.263 | 262,15 | 203 | 281,13 | ||||
| 2025-08-14 | 13F | Goldman Sachs Group Inc | 0 | -100,00 | 0 | |||||
| 2025-07-07 | 13F | Wesbanco Bank Inc | 4.569 | 0,00 | 284 | 4,43 | ||||
| 2025-08-11 | 13F | Mill Creek Capital Advisors, LLC | 69.013 | 0,00 | 4.288 | 4,43 | ||||
| 2025-08-14 | 13F | Smartleaf Asset Management LLC | 516 | 0,00 | 32 | 3,33 | ||||
| 2025-08-05 | 13F | Key FInancial Inc | 2.785 | 0,00 | 173 | 4,85 | ||||
| 2025-04-29 | 13F | Bank of New York Mellon Corp | 0 | -100,00 | 0 | |||||
| 2025-08-05 | 13F | Prosperity Consulting Group, LLC | 26.498 | 0,00 | 1.647 | 4,44 | ||||
| 2025-08-12 | 13F | TCTC Holdings, LLC | 6.547 | 0,00 | 407 | 4,37 | ||||
| 2025-08-14 | 13F | Benjamin Edwards Inc | 9.808 | 0,00 | 609 | 4,46 | ||||
| 2025-07-15 | 13F | Fifth Third Bancorp | 518 | 0,00 | 32 | 6,67 | ||||
| 2025-08-06 | 13F | SOUTH STATE Corp | 695 | 0,00 | 43 | 4,88 | ||||
| 2025-07-25 | 13F | Evolution Advisers, Inc. | 24.300 | 0,00 | 2 | 0,00 | ||||
| 2025-08-12 | 13F | NFP Retirement, Inc. | 11.315 | 0,00 | 703 | 4,46 | ||||
| 2025-07-24 | 13F | Stonebridge Financial Group, LLC | 107.396 | -0,92 | 6.674 | 3,46 | ||||
| 2025-08-08 | 13F | Horizon Family Wealth, Inc. | 51.664 | 0,71 | 3.210 | 5,18 | ||||
| 2025-04-21 | 13F | O'Dell Group, LLC | 0 | -100,00 | 0 | |||||
| 2025-08-06 | 13F | True Wealth Design, LLC | 5.206 | 0,00 | 324 | 4,53 | ||||
| 2025-08-12 | 13F | Bedel Financial Consulting, Inc. | 8.832 | 0,00 | 549 | 7,87 | ||||
| 2025-07-11 | 13F | Seacrest Wealth Management, Llc | 4.168 | -4,49 | 259 | 0,00 | ||||
| 2025-08-12 | 13F | Jpmorgan Chase & Co | 44.544 | 49,75 | 2.768 | 56,33 | ||||
| 2025-08-07 | 13F | Commerce Bank | 4.119 | 0,00 | 256 | 4,08 | ||||
| 2025-08-14 | 13F | UBS Group AG | 497.818 | -0,22 | 30.934 | 4,19 | ||||
| 2025-08-07 | 13F | Retirement Investment Advisors, Inc. | 10.393 | -0,08 | 646 | 4,37 | ||||
| 2025-07-23 | 13F | Armbruster Capital Management, Inc. | 10.117 | 0,00 | 629 | 4,32 | ||||
| 2025-08-11 | 13F | Bellwether Advisors, LLC | 430 | 0,70 | 27 | 4,00 | ||||
| 2025-08-01 | 13F | Envestnet Asset Management Inc | 194.151 | 4,24 | 12.065 | 8,85 | ||||
| 2025-08-13 | 13F | EverSource Wealth Advisors, LLC | 1.295 | 0,00 | 80 | 3,90 | ||||
| 2025-07-11 | 13F | Ullmann Financial Group, Inc. | 110.267 | 0,02 | 6.852 | 4,45 | ||||
| 2025-07-31 | 13F | Oppenheimer & Co Inc | 9.665 | -1,22 | 601 | 3,09 | ||||
| 2025-08-11 | 13F | Independent Advisor Alliance | 4.192 | 260 | ||||||
| 2025-08-12 | 13F | Proequities, Inc. | 0 | 0 | ||||||
| 2025-08-14 | 13F | Fmr Llc | 16.812 | -10,98 | 1.045 | -7,03 | ||||
| 2025-08-14 | 13F | Mariner, LLC | 19.024 | 2,70 | 1.182 | 7,26 | ||||
| 2025-07-14 | 13F | Farmers & Merchants Investments Inc | 320 | 0,00 | 20 | 0,00 | ||||
| 2025-07-29 | 13F | Fundamentun, Llc | 122.026 | 7.583 | ||||||
| 2025-08-08 | 13F | Pnc Financial Services Group, Inc. | 538.770 | -0,09 | 33.479 | 4,33 | ||||
| 2025-08-14 | 13F/A | Rockefeller Capital Management L.P. | 144.025 | -1,72 | 8.950 | 2,61 | ||||
| 2025-07-11 | 13F | Rockwood Wealth Management, LLC | 6.049 | 0,00 | 376 | 4,46 | ||||
| 2025-08-11 | 13F | Citigroup Inc | 15.273 | 29,70 | 949 | 35,57 | ||||
| 2025-08-12 | 13F | Cornerstone Wealth Management, LLC | 10.808 | 0,49 | 672 | 4,84 | ||||
| 2025-08-05 | 13F | Plante Moran Financial Advisors, LLC | 229 | 0,00 | 14 | 7,69 | ||||
| 2025-08-14 | 13F | Colony Group, LLC | 8.047 | 0,00 | 500 | 4,60 | ||||
| 2025-08-15 | 13F | Captrust Financial Advisors | 105.442 | -4,16 | 6.552 | 0,08 | ||||
| 2025-05-15 | 13F | Glenmede Trust Co Na | 1.908 | 3,25 | 114 | 7,62 | ||||
| 2025-08-05 | 13F | Atlas Private Wealth Advisors | 449.363 | -1,58 | 27.925 | 2,76 | ||||
| 2025-08-13 | 13F | Baird Financial Group, Inc. | 36.789 | -0,37 | 2.286 | 4,05 | ||||
| 2025-07-17 | 13F | Sound Income Strategies, LLC | 120 | 0,00 | 7 | 0,00 | ||||
| 2025-08-13 | 13F | Maia Wealth LLC | 3.660 | -84,52 | 227 | -82,55 | ||||
| 2025-07-30 | 13F | Financial Perspectives, Inc | 5.406 | 0,37 | 336 | 4,69 | ||||
| 2025-07-28 | 13F | Harbour Investments, Inc. | 44 | 0,00 | 3 | 0,00 | ||||
| 2025-07-28 | 13F | Frazier Financial Advisors, LLC | 684 | 0,59 | 43 | 5,00 | ||||
| 2025-08-11 | 13F | Howard Wealth Management, Llc | 13.447 | 0,00 | 836 | 4,38 | ||||
| 2025-08-14 | 13F | Aqr Capital Management Llc | 12.148 | 0,00 | 755 | 4,43 | ||||
| 2025-08-14 | 13F | Warren Averett Asset Management, LLC | 18.576 | 0,15 | 1.154 | 4,62 | ||||
| 2025-08-07 | 13F | Kestra Private Wealth Services, Llc | 3.930 | -3,53 | 244 | 0,83 | ||||
| 2025-08-12 | 13F | MAI Capital Management | 1.338 | 0,00 | 83 | 5,06 | ||||
| 2025-07-16 | 13F | ORG Wealth Partners, LLC | 758 | -2,94 | 47 | 2,17 | ||||
| 2025-08-15 | 13F | Equitable Holdings, Inc. | 104.422 | -0,59 | 6.489 | 3,81 | ||||
| 2025-04-15 | 13F | Noble Wealth Management PBC | 350 | -8,85 | 21 | -4,76 | ||||
| 2025-08-11 | 13F | Advisor Resource Council | 4.192 | 260 | ||||||
| 2025-08-12 | 13F | SRS Capital Advisors, Inc. | 450 | 28 | ||||||
| 2025-08-07 | 13F | Alpha Financial Advisors, LLC | 3.405 | 212 | ||||||
| 2025-08-08 | 13F | Avantax Advisory Services, Inc. | 3.840 | 239 | ||||||
| 2025-08-27 | 13F/A | Brinker Capital Investments, LLC | 3.787 | 235 | ||||||
| 2025-04-21 | 13F | ORG Partners LLC | 0 | -100,00 | 0 | |||||
| 2025-08-14 | 13F | Mml Investors Services, Llc | 26.034 | 24,11 | 2 | 0,00 | ||||
| 2025-08-04 | 13F | NBZ Investment Advisors LLC | 335 | 0,00 | 21 | 5,26 | ||||
| 2025-07-24 | 13F | Us Bancorp \de\ | 2.859 | 57,61 | 178 | 65,42 | ||||
| 2025-08-14 | 13F | Glenmede Investment Management, LP | 1.848 | 115 | ||||||
| 2025-07-22 | 13F | Willner & Heller, Llc | 22.482 | -6,22 | 1.397 | -2,03 | ||||
| 2025-07-25 | 13F | Parker Financial LLC | 6.678 | -12,92 | 415 | -8,99 | ||||
| 2025-07-30 | 13F | Cullen/frost Bankers, Inc. | 151.182 | 1,10 | 9.394 | 5,56 | ||||
| 2025-05-14 | 13F | Mission Creek Capital Partners, Inc. | 0 | -100,00 | 0 | |||||
| 2025-07-29 | 13F | Harbor Asset Planning, Inc. | 2.577 | 160 | ||||||
| 2025-08-11 | 13F | Wescott Financial Advisory Group, LLC | 7.119 | 0,00 | 442 | 4,49 | ||||
| 2025-07-07 | 13F | RDA Financial Network | 6.350 | 0,00 | 395 | 4,51 | ||||
| 2025-08-14 | 13F | McIlrath & Eck, LLC | 100 | 0,00 | 6 | 20,00 | ||||
| 2025-08-11 | 13F | Regal Investment Advisors LLC | 131.708 | 1,98 | 8.184 | 6,49 | ||||
| 2025-08-13 | 13F | Jones Financial Companies Lllp | 3.676 | 82,61 | 227 | 91,53 | ||||
| 2025-08-08 | 13F | Firestone Capital Management | 37.513 | 2.331 | ||||||
| 2025-07-31 | 13F | Mason & Associates Inc | 3.460 | 0,00 | 215 | 4,88 | ||||
| 2025-05-01 | 13F | Quest 10 Wealth Builders, Inc. | 58 | 0,00 | 3 | 0,00 | ||||
| 2025-07-17 | 13F | Janney Montgomery Scott LLC | 10.291 | 8,57 | 1 | |||||
| 2025-08-14 | 13F | Betterment LLC | 3.369 | -9,92 | 0 | |||||
| 2025-08-05 | 13F | Bank Of Montreal /can/ | 3.123 | 0,00 | 194 | 4,86 | ||||
| 2025-05-01 | 13F | Stephens Inc /ar/ | 0 | -100,00 | 0 | -100,00 | ||||
| 2025-08-14 | 13F | Raymond James Financial Inc | 263.460 | 0,45 | 16.371 | 4,90 | ||||
| 2025-08-15 | 13F | Strategic Investment Advisors / MI | 7.985 | -1,78 | 496 | 2,69 | ||||
| 2025-08-04 | 13F | Spire Wealth Management | 33.377 | 0,38 | 2.074 | 4,85 | ||||
| 2025-08-14 | 13F | Stifel Financial Corp | 12.480 | -26,29 | 776 | -23,04 | ||||
| 2025-08-04 | 13F | Arkadios Wealth Advisors | 100.174 | -10,96 | 6.225 | -7,02 | ||||
| 2025-08-13 | 13F | Solutions 4 Wealth, Ltd | 4.756 | 2,74 | 296 | 7,27 | ||||
| 2025-07-18 | 13F | Philip James Wealth Mangement, LLC | 23.827 | 0,70 | 1.481 | 5,11 | ||||
| 2025-08-07 | 13F | Sound View Wealth Advisors Group, LLC | 4.938 | 0,00 | 307 | 4,44 | ||||
| 2025-07-17 | 13F | Hanson & Doremus Investment Management | 0 | -100,00 | 0 | |||||
| 2025-07-25 | 13F | Atria Wealth Solutions, Inc. | 0 | -100,00 | 0 | |||||
| 2025-08-15 | 13F/A | Florida Financial Advisors, Llc | 3.318 | 206 |
Other Listings
| MX:PWV |