Grundlæggende statistik
| Institutionelle ejere | 130 total, 124 long only, 1 short only, 5 long/short - change of -5,11% MRQ |
| Gennemsnitlig porteføljeallokering | 0.1289 % - change of -13,74% MRQ |
| Institutionelle aktier (lange) | 7.681.297 (ex 13D/G) - change of 1,90MM shares 32,97% MRQ |
| Institutionel værdi (lang) | $ 641.159 USD ($1000) |
Institutionelt ejerskab og aktionærer
VanEck ETF Trust - VanEck Pharmaceutical ETF (US:PPH) har 130 institutionelle ejere og aktionærer, der har indsendt 13D/G- eller 13F-formularer til Securities Exchange Commission (SEC). Disse institutioner har i alt 7,681,297 aktier. Største aktionærer omfatter Goldman Sachs Group Inc, Morgan Stanley, Healthcare Of Ontario Pension Plan Trust Fund, Wells Fargo & Company/mn, Clal Insurance Enterprises Holdings Ltd, Jane Street Group, Llc, Avalon Trust Co, J.Safra Asset Management Corp, Jpmorgan Chase & Co, and Susquehanna International Group, Llp .
VanEck ETF Trust - VanEck Pharmaceutical ETF (NasdaqGM:PPH) institutionel ejerskabsstruktur viser aktuelle positioner i virksomheden efter institutioner og fonde, samt seneste ændringer i positionsstørrelse. Større aktionærer kan omfatte individuelle investorer, investeringsforeninger, hedgefonde eller institutioner. Skema 13D angiver, at investoren besidder (eller besidder) mere end 5 % af virksomheden og har til hensigt (eller har til hensigt at) aktivt at forfølge en ændring i forretningsstrategi. Skema 13G indikerer en passiv investering på over 5%.
The share price as of September 12, 2025 is 89,07 / share. Previously, on September 13, 2024, the share price was 97,52 / share. This represents a decline of 8,66% over that period.

Fondens stemningsscore
Fund Sentiment Score (fka Ownership Accumulation Score) finder de aktier, der bliver mest købt af fonde. Det er resultatet af en sofistikeret, multi-faktor kvantitativ model, der identificerer virksomheder med de højeste niveauer af institutionel akkumulering. Scoringsmodellen bruger en kombination af den samlede stigning i oplyste ejere, ændringerne i porteføljeallokeringer i disse ejere og andre målinger. Tallet går fra 0 til 100, hvor højere tal indikerer et højere niveau af akkumulering for sine jævnaldrende, og 50 er gennemsnittet.
Opdateringsfrekvens: Dagligt
Se Ownership Explorer, som giver en liste over højest rangerende virksomheder.
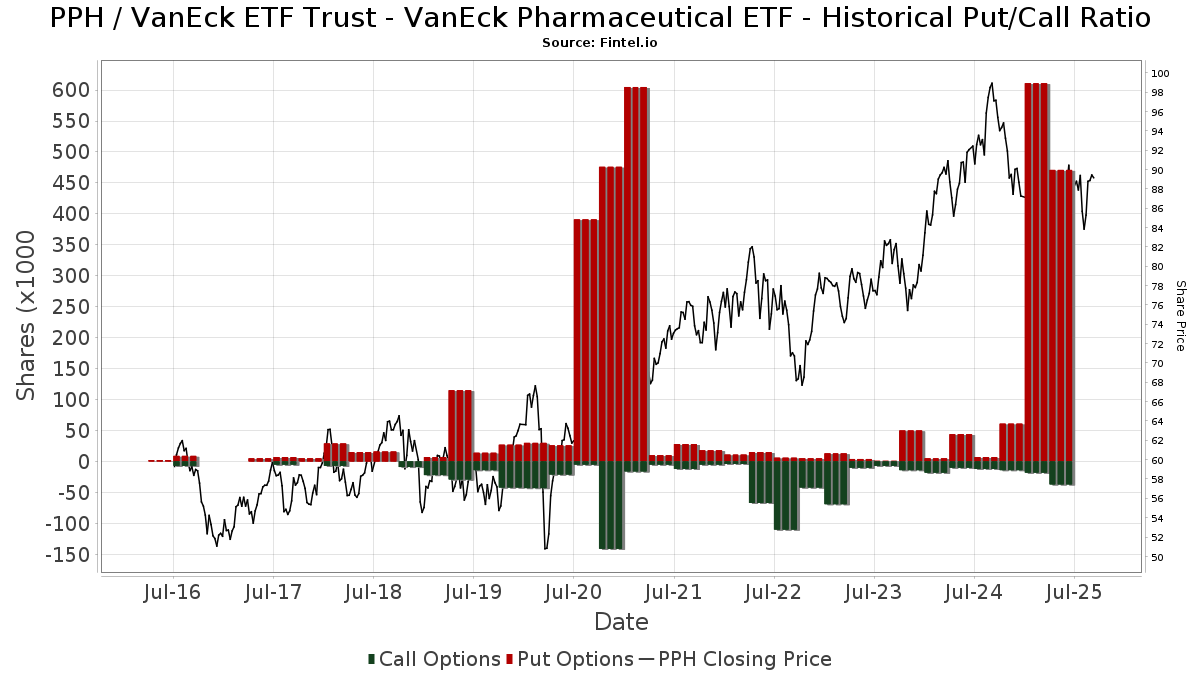
Institutionel Put/Call-forhold
Ud over at indberette standardaktie- og gældsudstedelser skal institutter med mere end 100 mill. aktiver under forvaltning også oplyse deres put- og call-optionsbeholdninger. Da salgsoptioner generelt indikerer negativ stemning, og købsoptioner indikerer positiv stemning, kan vi få en fornemmelse af den overordnede institutionelle stemning ved at plotte forholdet mellem put og kald. Diagrammet til højre viser det historiske put/call-forhold for dette instrument.
Brug af Put/Call Ratio som en indikator for investorernes stemning overvinder en af de vigtigste mangler ved at bruge totalt institutionelt ejerskab, som er, at en betydelig mængde af aktiver under forvaltning investeres passivt for at spore indekser. Passivt forvaltede fonde køber typisk ikke optioner, så indikatoren for put/call-forholdet følger mere nøje følelsen af aktivt forvaltede fonde.
13F og NPORT arkivering
Detaljer om 13F-arkivering er gratis. Detaljer om NP-ansøgninger kræver et premium-medlemskab. Grønne rækker angiver nye positioner. Røde rækker angiver lukkede positioner. Klik på linket ikon for at se den fulde transaktionshistorik.
Opgrader
for at låse premium-data op og eksportere til Excel ![]() .
.
| Fil dato | Kilde | Investor | Type | Gennemsnitlig pris (Øst) |
Aktier | Δ Aktier (%) |
Rapporteret Værdi ($1000) |
Δ Værdi (%) |
Port Alloc (%) |
|
|---|---|---|---|---|---|---|---|---|---|---|
| 2025-08-13 | 13F | Beacon Pointe Advisors, LLC | 2.428 | 0,00 | 214 | -3,62 | ||||
| 2025-08-12 | 13F | Jpmorgan Chase & Co | 255.837 | 2.852,19 | 22.503 | 2.752,09 | ||||
| 2025-08-13 | 13F | Level Four Advisory Services, Llc | 37.495 | 3,11 | 3.298 | -0,45 | ||||
| 2025-08-08 | 13F | SBI Securities Co., Ltd. | 284 | -16,22 | 25 | -20,00 | ||||
| 2025-08-12 | 13F | Steward Partners Investment Advisory, Llc | 16.161 | 0,00 | 1.422 | -3,46 | ||||
| 2025-07-28 | 13F | Mutual Advisors, LLC | 0 | -100,00 | 0 | |||||
| 2025-05-08 | 13F | Private Advisory Group LLC | 0 | -100,00 | 0 | -100,00 | ||||
| 2025-07-22 | 13F | IMC-Chicago, LLC | 0 | -100,00 | 0 | |||||
| 2025-07-15 | 13F | North Star Investment Management Corp. | 1.109 | 0,09 | 98 | -3,96 | ||||
| 2025-08-07 | 13F | Allworth Financial LP | 385 | 10,32 | 34 | 10,00 | ||||
| 2025-05-20 | 13F/A | Colony Group, LLC | 0 | -100,00 | 0 | -100,00 | ||||
| 2025-08-13 | 13F | Jones Financial Companies Lllp | 3.240 | 13,68 | 283 | 9,69 | ||||
| 2025-05-14 | 13F | Oarsman Capital, Inc. | 0 | -100,00 | 0 | -100,00 | ||||
| 2025-07-29 | 13F | Stratos Wealth Advisors, LLC | 4.066 | -0,76 | 358 | -4,29 | ||||
| 2025-08-11 | 13F | Aptus Capital Advisors, LLC | 524 | 0,58 | 46 | -2,13 | ||||
| 2025-08-14 | 13F | DeepCurrents Investment Group LLC | Put | 0 | -100,00 | 0 | ||||
| 2025-07-31 | 13F | Conservest Capital Advisors, Inc. | 5.059 | 0,16 | 445 | -3,48 | ||||
| 2025-08-05 | 13F | Bank Of Montreal /can/ | 11.398 | -26,88 | 1.003 | -29,44 | ||||
| 2025-08-14 | 13F | Two Sigma Investments, Lp | 0 | -100,00 | 0 | |||||
| 2025-08-12 | 13F | MAI Capital Management | 938 | -6,11 | 82 | -9,89 | ||||
| 2025-08-14 | 13F | D. E. Shaw & Co., Inc. | 30.254 | 2.661 | ||||||
| 2025-08-14 | 13F | Stifel Financial Corp | 11.456 | -0,05 | 1.008 | -3,54 | ||||
| 2025-07-22 | 13F | Bank Hapoalim Bm | 3.948 | -2,35 | 0 | |||||
| 2025-08-05 | 13F | Dunhill Financial, LLC | 2.833 | 249 | ||||||
| 2025-08-08 | 13F | Cetera Investment Advisers | 36.017 | 4,01 | 3.168 | 0,41 | ||||
| 2025-08-13 | 13F | Capital Analysts, Inc. | 232 | 0,00 | 0 | |||||
| 2025-08-19 | 13F | Anchor Investment Management, LLC | 58 | 0,00 | 5 | 0,00 | ||||
| 2025-04-29 | 13F | Hm Payson & Co | 99 | 0,00 | 9 | 12,50 | ||||
| 2025-07-25 | 13F | Cwm, Llc | 375 | 167,86 | 0 | |||||
| 2025-08-14 | 13F | Goldman Sachs Group Inc | 2.762.770 | 138,13 | 243.013 | 129,85 | ||||
| 2025-07-14 | 13F | Buska Wealth Management, LLC | 3.297 | -18,11 | 290 | -20,77 | ||||
| 2025-08-04 | 13F | Creative Financial Designs Inc /adv | 2.129 | 18,15 | 187 | 14,02 | ||||
| 2025-04-23 | 13F | Spirepoint Private Client, Llc | 0 | -100,00 | 0 | |||||
| 2025-07-28 | 13F | Harbour Investments, Inc. | 4.450 | 9,71 | 391 | 5,96 | ||||
| 2025-08-11 | 13F | Independent Advisor Alliance | 51.519 | 11,24 | 4.532 | 7,37 | ||||
| 2025-08-14 | 13F | UBS Group AG | 163.718 | -26,26 | 14.401 | -28,82 | ||||
| 2025-07-16 | 13F | Twelve Points Wealth Management LLC | 0 | -100,00 | 0 | |||||
| 2025-08-13 | 13F | Renaissance Technologies Llc | 14.400 | 1.267 | ||||||
| 2025-05-12 | 13F | Pura Vida Investments, Llc | Put | 0 | -100,00 | 0 | ||||
| 2025-08-14 | 13F | Jane Street Group, Llc | Put | 98.100 | 174,79 | 8.629 | 165,23 | |||
| 2025-08-14 | 13F | Jane Street Group, Llc | Call | 2.600 | -10,34 | 229 | -13,64 | |||
| 2025-08-04 | 13F | Canton Hathaway, LLC | 10.000 | 0,00 | 1 | |||||
| 2025-08-14 | 13F | Jane Street Group, Llc | 299.380 | 927,84 | 26.333 | 892,20 | ||||
| 2025-08-15 | 13F | Tower Research Capital LLC (TRC) | 34.624 | 346.140,00 | 3.046 | |||||
| 2025-07-23 | 13F | Elm3 Financial Group, LLC | 2.439 | -22,08 | 215 | -24,91 | ||||
| 2025-07-28 | 13F | Copia Wealth Management | 5.429 | -11,90 | 478 | -14,97 | ||||
| 2025-08-08 | 13F | Avalon Trust Co | 280.477 | -1,13 | 24.671 | -4,57 | ||||
| 2025-09-10 | 13F | WT Wealth Management | 46.597 | -9,86 | 4.099 | -12,99 | ||||
| 2025-07-08 | 13F | Arlington Trust Co LLC | 85 | 0,00 | 7 | 0,00 | ||||
| 2025-08-12 | 13F | Inscription Capital, LLC | 0 | -100,00 | 0 | |||||
| 2025-05-13 | 13F | SFI Advisors, LLC | 0 | -100,00 | 0 | |||||
| 2025-08-12 | 13F | Park Square Financial Group, LLC | 600 | 0,00 | 53 | -3,70 | ||||
| 2025-08-11 | 13F | Banque Cantonale Vaudoise | 629 | 0,00 | 0 | |||||
| 2025-08-14 | 13F | Wells Fargo & Company/mn | 402.987 | 35.447 | ||||||
| 2025-08-12 | 13F | Accredited Wealth Management, LLC | 100 | 0,00 | 9 | -11,11 | ||||
| 2025-08-12 | 13F | Proequities, Inc. | 0 | 0 | ||||||
| 2025-07-16 | 13F | Signaturefd, Llc | 0 | -100,00 | 0 | |||||
| 2025-08-06 | 13F | Kcm Investment Advisors Llc | 2.893 | -1,03 | 254 | -4,51 | ||||
| 2025-07-28 | 13F | J.Safra Asset Management Corp | 271.620 | 1,71 | 23.759 | -2,38 | ||||
| 2025-08-13 | 13F | Continuum Advisory, LLC | 0 | -100,00 | 0 | |||||
| 2025-08-06 | 13F | AE Wealth Management LLC | 1.004 | -4,02 | 88 | -7,37 | ||||
| 2025-08-11 | 13F | Principal Securities, Inc. | 353 | 38,98 | 31 | 47,62 | ||||
| 2025-07-31 | 13F | Oppenheimer & Co Inc | 11.111 | 2,10 | 977 | -1,41 | ||||
| 2025-08-14 | 13F | Bank Of America Corp /de/ | 59.637 | -66,51 | 5.246 | -67,68 | ||||
| 2025-08-14 | 13F | Wells Fargo & Company/mn | Put | 8.200 | 721 | |||||
| 2025-08-13 | 13F | Fisher Asset Management, LLC | 15.001 | -98,83 | 1.319 | -98,87 | ||||
| 2025-08-14 | 13F | Two Sigma Securities, Llc | 4.480 | 40,09 | 394 | 35,40 | ||||
| 2025-05-30 | NP | ERNZ - TrueShares Active Yield ETF | 5.579 | 508 | ||||||
| 2025-08-14 | 13F | Raymond James Financial Inc | 22.417 | 11,78 | 1.972 | 7,88 | ||||
| 2025-08-14 | 13F | Hrt Financial Lp | 0 | -100,00 | 0 | |||||
| 2025-08-14 | 13F | Aspen Grove Capital, LLC | 25.844 | 0,58 | 2.273 | -2,90 | ||||
| 2025-08-07 | 13F | Montag A & Associates Inc | 660 | 0,00 | 58 | -3,33 | ||||
| 2025-08-12 | 13F | Jefferies Financial Group Inc. | 3.262 | 287 | ||||||
| 2025-09-04 | 13F/A | Advisor Group Holdings, Inc. | 22.125 | 82,35 | 1.946 | 75,95 | ||||
| 2025-07-29 | 13F | TrueMark Investments, LLC | 0 | -100,00 | 0 | |||||
| 2025-08-11 | 13F | Citigroup Inc | 66.024 | 5.807 | ||||||
| 2025-07-23 | 13F | Fluent Financial, LLC | 0 | -100,00 | 0 | |||||
| 2025-07-11 | 13F | Farther Finance Advisors, LLC | 434 | -20,37 | 38 | -20,83 | ||||
| 2025-08-14 | 13F | GWM Advisors LLC | 102 | -98,85 | 9 | -99,01 | ||||
| 2025-08-06 | 13F | Miller Investment Management, LP | 181.536 | -4,27 | 15.968 | -7,60 | ||||
| 2025-07-23 | 13F | Prime Capital Investment Advisors, LLC | 96.870 | -26,43 | 8.521 | -28,99 | ||||
| 2025-08-05 | 13F | Telos Capital Management, Inc. | 4.516 | 2,08 | 397 | -1,49 | ||||
| 2025-04-24 | 13F | Nadler Financial Group, Inc. | 0 | -100,00 | 0 | |||||
| 2025-05-15 | 13F | Old Mission Capital Llc | 0 | -100,00 | 0 | -100,00 | ||||
| 2025-07-21 | 13F | Ntv Asset Management Llc | 7.957 | -13,25 | 700 | -16,29 | ||||
| 2025-05-15 | 13F | Marshall Wace, Llp | 0 | -100,00 | 0 | |||||
| 2025-08-14 | 13F | Sunbelt Securities, Inc. | 1.000 | 86 | ||||||
| 2025-07-07 | 13F | Nova Wealth Management, Inc. | 3.097 | -21,26 | 272 | -24,02 | ||||
| 2025-07-24 | 13F | Us Bancorp \de\ | 414 | -48,64 | 36 | -50,68 | ||||
| 2025-08-14 | 13F | Headlands Technologies LLC | 0 | -100,00 | 0 | -100,00 | ||||
| 2025-04-16 | 13F | Wealth Enhancement Advisory Services, Llc | Put | 0 | -100,00 | 0 | ||||
| 2025-08-14 | 13F | CoreFirst Bank & Trust | 200 | 18 | ||||||
| 2025-08-04 | 13F | Assetmark, Inc | 16 | -76,12 | 1 | -83,33 | ||||
| 2025-08-08 | 13F | Hartland & Co., LLC | 500 | 44 | ||||||
| 2025-04-16 | 13F | Hoey Investments, Inc | 0 | -100,00 | 0 | |||||
| 2025-08-11 | 13F | Blue Bell Private Wealth Management, Llc | 0 | -100,00 | 0 | |||||
| 2025-08-25 | 13F/A | Neuberger Berman Group LLC | 3.593 | 0,00 | 316 | -3,36 | ||||
| 2025-08-15 | 13F | Morgan Stanley | 538.398 | 489,05 | 47.358 | 468,58 | ||||
| 2025-07-09 | 13F | Dynamic Advisor Solutions LLC | 0 | -100,00 | 0 | |||||
| 2025-07-15 | 13F | Capital Investment Advisors, LLC | 0 | -100,00 | 0 | |||||
| 2025-07-31 | 13F | Cambridge Investment Research Advisors, Inc. | 3.153 | -6,96 | 0 | |||||
| 2025-08-12 | 13F | LPL Financial LLC | 48.228 | -0,53 | 4.242 | -3,98 | ||||
| 2025-08-15 | 13F | Equitable Holdings, Inc. | 14.241 | 1,61 | 1.253 | -1,96 | ||||
| 2025-08-11 | 13F | Tidemark, LLC | 486 | 8,00 | 43 | 2,44 | ||||
| 2025-08-14 | 13F | CIBC World Markets Inc. | 4.075 | -8,39 | 358 | -11,60 | ||||
| 2025-07-14 | 13F | U.S. Capital Wealth Advisors, LLC | 2.750 | 5,77 | 242 | 2,12 | ||||
| 2025-07-17 | 13F | Janney Montgomery Scott LLC | 4.805 | -1,03 | 0 | |||||
| 2025-07-30 | 13F | Phoenix Holdings Ltd. | 61.276 | 13,77 | 5.390 | 7,97 | ||||
| 2025-08-11 | 13F | HHM Wealth Advisors, LLC | 1.350 | 0,00 | 119 | -4,07 | ||||
| 2025-08-11 | 13F | TD Waterhouse Canada Inc. | 170 | 0,00 | 15 | 0,00 | ||||
| 2025-08-14 | 13F | DecisionPoint Financial, LLC | 1.000 | 0,00 | 88 | -3,30 | ||||
| 2025-08-26 | NP | LCR - Leuthold Core ETF | 0 | -100,00 | 0 | -100,00 | ||||
| 2025-08-12 | 13F | Tradition Wealth Management, LLC | 6.064 | -6,19 | 533 | -9,51 | ||||
| 2025-04-17 | 13F | Grimes & Company, Inc. | 0 | -100,00 | 0 | |||||
| 2025-07-22 | 13F | Gsa Capital Partners Llp | 2.510 | -11,96 | 0 | |||||
| 2025-08-13 | 13F | Leuthold Group, Llc | 0 | -100,00 | 0 | |||||
| 2025-04-28 | 13F | Lansing Street Advisors | 0 | -100,00 | 0 | -100,00 | ||||
| 2025-07-28 | 13F | Mowery & Schoenfeld Wealth Management, LLC | 13 | 0,00 | 1 | 0,00 | ||||
| 2025-08-12 | 13F | Verity & Verity, LLC | 131.320 | 11.551 | ||||||
| 2025-04-18 | 13F | Edge Financial Advisors LLC | 0 | -100,00 | 0 | |||||
| 2025-08-26 | 13F/A | Thrivent Financial For Lutherans | 20.681 | 2 | ||||||
| 2025-07-24 | 13F | Blair William & Co/il | 12.295 | 34,30 | 1.081 | 29,62 | ||||
| 2025-08-12 | 13F | Trexquant Investment LP | 3.151 | 277 | ||||||
| 2025-05-05 | 13F | Mivtachim The Workers Social Insurance Fund Ltd. (Under Special Management) | 0 | -100,00 | 0 | -100,00 | ||||
| 2025-07-28 | 13F | Axxcess Wealth Management, Llc | 9.114 | 4,78 | 802 | 1,14 | ||||
| 2025-08-05 | 13F | GPS Wealth Strategies Group, LLC | 459 | 0,00 | 40 | -2,44 | ||||
| 2025-05-07 | 13F | Investment Management Corp /va/ /adv | 0 | -100,00 | 0 | |||||
| 2025-07-16 | 13F | AAFMAA Wealth Management & Trust LLC | 39.081 | -6,85 | 3.438 | -10,10 | ||||
| 2025-04-21 | 13F | SILVER OAK SECURITIES, Inc | 0 | -100,00 | 0 | |||||
| 2025-08-14 | 13F | Ameriprise Financial Inc | 3.364 | -1,38 | 296 | -4,84 | ||||
| 2025-07-23 | 13F | Vontobel Holding Ltd. | 3.800 | 0,00 | 334 | -3,47 | ||||
| 2025-08-01 | 13F | Envestnet Asset Management Inc | 4.275 | -14,45 | 376 | -17,36 | ||||
| 2025-08-27 | 13F/A | Brinker Capital Investments, LLC | 33.513 | -5,57 | 2.948 | -8,87 | ||||
| 2025-08-08 | 13F | Hudock, Inc. | 9.217 | 811 | ||||||
| 2025-08-13 | 13F | Healthcare Of Ontario Pension Plan Trust Fund | 512.000 | 0,00 | 45.036 | -3,48 | ||||
| 2025-08-14 | 13F | Verition Fund Management LLC | 4.044 | -20,06 | 356 | -22,99 | ||||
| 2025-07-09 | 13F | Sapient Capital Llc | 2.588 | 0,00 | 228 | -3,40 | ||||
| 2025-08-06 | 13F | Commonwealth Equity Services, Llc | 13.287 | -28,66 | 1 | 0,00 | ||||
| 2025-08-13 | 13F | Quadrature Capital Ltd | 0 | -100,00 | 0 | |||||
| 2025-08-14 | 13F | Royal Bank Of Canada | 35.163 | -47,98 | 3.093 | -49,79 | ||||
| 2025-08-12 | 13F | Global Retirement Partners, LLC | 270 | -7,85 | 24 | -8,00 | ||||
| 2025-08-14 | 13F | Fmr Llc | 1.461 | -2,60 | 129 | -5,88 | ||||
| 2025-08-14 | 13F | Federation des caisses Desjardins du Quebec | 400 | 0,00 | 35 | -2,78 | ||||
| 2025-08-13 | 13F | Flow Traders U.s. Llc | 0 | -100,00 | 0 | |||||
| 2025-08-14 | 13F | Mml Investors Services, Llc | 2.511 | 2,11 | 0 | |||||
| 2025-08-13 | 13F | StoneX Group Inc. | 0 | -100,00 | 0 | -100,00 | ||||
| 2025-08-14 | 13F | J. Goldman & Co LP | Put | 131.800 | -29,44 | 11.593 | -31,90 | |||
| 2025-08-04 | 13F | Arkadios Wealth Advisors | 7.780 | 684 | ||||||
| 2025-07-22 | 13F | Belpointe Asset Management LLC | 5.704 | -1,60 | 502 | -5,11 | ||||
| 2025-05-02 | 13F | Apollon Wealth Management, LLC | 0 | -100,00 | 0 | |||||
| 2025-08-14 | 13F | Citadel Advisors Llc | Put | 13.000 | -77,89 | 1.143 | -78,67 | |||
| 2025-08-14 | 13F | Susquehanna International Group, Llp | Put | 214.400 | -34,81 | 18.859 | -37,08 | |||
| 2025-08-05 | 13F | Westside Investment Management, Inc. | 2.351 | 208 | ||||||
| 2025-08-14 | 13F | Susquehanna International Group, Llp | 53.664 | 105,52 | 4.720 | 98,40 | ||||
| 2025-08-14 | 13F | Susquehanna International Group, Llp | Call | 23.300 | 77,86 | 2.049 | 71,75 | |||
| 2025-07-31 | 13F | Burke & Herbert Bank & Trust Co | 8.865 | 0,00 | 780 | -3,47 | ||||
| 2025-08-14 | 13F | Citadel Advisors Llc | Call | 6.100 | 165,22 | 537 | 156,46 | |||
| 2025-07-16 | 13F | Investment Partners Asset Management, Inc. | 4.219 | -0,28 | 371 | -3,64 | ||||
| 2025-08-14 | 13F | Citadel Advisors Llc | 31.277 | -24,47 | 2.751 | -27,09 | ||||
| 2025-07-24 | 13F | CarsonAllaria Wealth Management, Ltd. | 0 | -100,00 | 0 | |||||
| 2025-07-24 | 13F | IFP Advisors, Inc | 285 | 0,00 | 25 | -3,85 | ||||
| 2025-08-13 | 13F | D L Carlson Investment Group Inc | 0 | -100,00 | 0 | |||||
| 2025-07-21 | 13F | Warner Financial, Inc | 4.636 | 0,61 | 0 | |||||
| 2025-08-08 | 13F | Pnc Financial Services Group, Inc. | 250 | 0,00 | 22 | -4,55 | ||||
| 2025-07-29 | 13F | Activest Wealth Management | 74 | 0,00 | 7 | 0,00 | ||||
| 2025-08-14 | 13F | Comerica Bank | 430 | -21,39 | 38 | -24,49 | ||||
| 2025-08-13 | 13F | Barclays Plc | 0 | -100,00 | 0 | |||||
| 2025-04-16 | 13F | Wealth Enhancement Advisory Services, Llc | 0 | -100,00 | 0 | |||||
| 2025-08-14 | 13F | Camden Capital, LLC | 2.807 | 0,57 | 247 | -3,15 | ||||
| 2025-08-27 | 13F/A | Squarepoint Ops LLC | Call | 5.700 | 501 | |||||
| 2025-08-13 | 13F | Financial Freedom, LLC | 9.006 | 0,17 | 792 | -3,30 | ||||
| 2025-08-27 | 13F/A | Squarepoint Ops LLC | Put | 5.700 | 501 | |||||
| 2025-03-28 | 13F/A | Berkeley, Inc | 0 | -100,00 | 0 | |||||
| 2025-07-10 | 13F | Global Financial Private Client, LLC | 0 | -100,00 | 0 | |||||
| 2025-08-14 | 13F | Bnp Paribas Arbitrage, Sa | 108.629 | 0,00 | 9.555 | -3,48 | ||||
| 2025-05-15 | 13F | Blue Chip Partners, Inc. | 0 | -100,00 | 0 | |||||
| 2025-04-25 | 13F | Almanack Investment Partners, LLC. | 0 | -100,00 | 0 | |||||
| 2025-08-13 | 13F | Northwestern Mutual Wealth Management Co | 12.790 | 76,73 | 1.125 | 70,71 | ||||
| 2025-08-18 | 13F/A | National Bank Of Canada /fi/ | 513 | 0,00 | 45 | -2,17 | ||||
| 2025-08-14 | 13F | Qube Research & Technologies Ltd | 16.190 | 13.856,90 | 1.424 | 14.140,00 | ||||
| 2025-08-12 | 13F | Clal Insurance Enterprises Holdings Ltd | 325.000 | 29 | ||||||
| 2025-05-15 | 13F | Millennium Management Llc | 0 | -100,00 | 0 | -100,00 | ||||
| 2025-07-08 | 13F | Adamsbrown Wealth Consultants Llc | 195.976 | 12,05 | 17.238 | 8,16 | ||||
| 2025-08-06 | 13F | Nvwm, Llc | 38 | 3 | ||||||
| 2025-07-25 | 13F | Atria Wealth Solutions, Inc. | 2.739 | 0,00 | 241 | -3,61 | ||||
| 2025-05-15 | 13F/A | Orion Portfolio Solutions, LLC | 35.490 | 18,78 | 3.234 | 25,45 | ||||
| 2025-07-18 | 13F | SOA Wealth Advisors, LLC. | 0 | -100,00 | 0 |