Grundlæggende statistik
| Institutionelle aktier (lange) | 21.727.419 - 58,43% (ex 13D/G) - change of -0,42MM shares -1,91% MRQ |
| Institutionel værdi (lang) | $ 286.634 USD ($1000) |
Institutionelt ejerskab og aktionærer
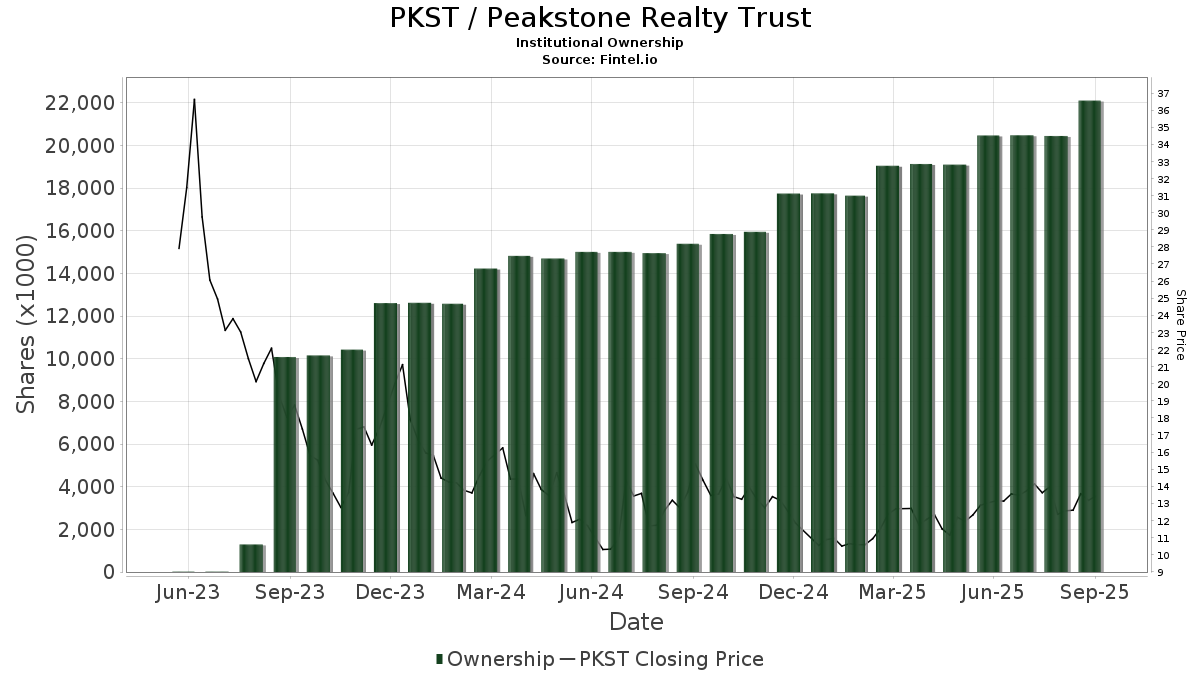
Peakstone Realty Trust (US:PKST) har 200 institutionelle ejere og aktionærer, der har indsendt 13D/G- eller 13F-formularer til Securities Exchange Commission (SEC). Disse institutioner har i alt 21,727,419 aktier. Største aktionærer omfatter Vanguard Group Inc, BlackRock, Inc., Morgan Stanley, Centaurus Financial, Inc., J. Goldman & Co LP, Geode Capital Management, Llc, Charles Schwab Investment Management Inc, State Street Corp, Tcw Group Inc, and Strs Ohio .
Peakstone Realty Trust (NYSE:PKST) institutionel ejerskabsstruktur viser aktuelle positioner i virksomheden efter institutioner og fonde, samt seneste ændringer i positionsstørrelse. Større aktionærer kan omfatte individuelle investorer, investeringsforeninger, hedgefonde eller institutioner. Skema 13D angiver, at investoren besidder (eller besidder) mere end 5 % af virksomheden og har til hensigt (eller har til hensigt at) aktivt at forfølge en ændring i forretningsstrategi. Skema 13G indikerer en passiv investering på over 5%.
The share price as of April 7, 2026 is 20,93 / share. Previously, on April 8, 2025, the share price was 11,40 / share. This represents an increase of 83,60% over that period.
Fondens stemningsscore
Fund Sentiment Score (fka Ownership Accumulation Score) finder de aktier, der bliver mest købt af fonde. Det er resultatet af en sofistikeret, multi-faktor kvantitativ model, der identificerer virksomheder med de højeste niveauer af institutionel akkumulering. Scoringsmodellen bruger en kombination af den samlede stigning i oplyste ejere, ændringerne i porteføljeallokeringer i disse ejere og andre målinger. Tallet går fra 0 til 100, hvor højere tal indikerer et højere niveau af akkumulering for sine jævnaldrende, og 50 er gennemsnittet.
Opdateringsfrekvens: Dagligt
Se Ownership Explorer, som giver en liste over højest rangerende virksomheder.
AI+ Ask Fintel’s AI assistant about Peakstone Realty Trust.
Select a question to share a public post with an AI-crafted answer.
Thinking of good questions…
Institutionel Put/Call-forhold
Ud over at indberette standardaktie- og gældsudstedelser skal institutter med mere end 100 mill. aktiver under forvaltning også oplyse deres put- og call-optionsbeholdninger. Da salgsoptioner generelt indikerer negativ stemning, og købsoptioner indikerer positiv stemning, kan vi få en fornemmelse af den overordnede institutionelle stemning ved at plotte forholdet mellem put og kald. Diagrammet til højre viser det historiske put/call-forhold for dette instrument.
Brug af Put/Call Ratio som en indikator for investorernes stemning overvinder en af de vigtigste mangler ved at bruge totalt institutionelt ejerskab, som er, at en betydelig mængde af aktiver under forvaltning investeres passivt for at spore indekser. Passivt forvaltede fonde køber typisk ikke optioner, så indikatoren for put/call-forholdet følger mere nøje følelsen af aktivt forvaltede fonde.

13D/G-arkivering
Vi præsenterer 13D/G ansøgninger separat fra 13F ansøgninger på grund af den forskellige behandling af SEC. 13D/G-ansøgninger kan indgives af grupper af investorer (med én ledende), hvorimod 13F-ansøgninger ikke kan. Dette resulterer i situationer, hvor en investor kan indsende en 13D/G, der rapporterer én værdi for de samlede aktier (der repræsenterer alle de aktier, der ejes af investorgruppen), men derefter indsender en 13F, der rapporterer en anden værdi for de samlede aktier (der udelukkende repræsenterer deres egne) ejendomsret). Det betyder, at aktieejerskab af 13D/G-arkiver og 13F-arkiveringer ofte ikke er direkte sammenlignelige, så vi præsenterer dem separat.
Bemærk: Fra den 16. maj 2021 viser vi ikke længere ejere, der ikke har indsendt en 13D/G inden for det seneste år. Tidligere viste vi den fulde historie af 13D/G-arkiver. Generelt skal enheder, der er forpligtet til at indgive 13D/G-ansøgninger, indgive mindst årligt, før de indsender en afsluttende ansøgning. Dog forlader fonde nogle gange positioner uden at indsende en afsluttende ansøgning (dvs. de afvikler), så visning af den fulde historie resulterede nogle gange i forvirring om det nuværende ejerskab. For at undgå forvirring viser vi nu kun 'aktuelle' ejere - det vil sige - ejere, der har anmeldt inden for det seneste år.
Upgrade to unlock premium data.
| Fil dato | Form | Investor | Forrige Aktier |
Seneste Aktier |
Δ Aktier (Procent) |
Ejendomsret (Procent) |
Δ Ejerskab (Procent) |
|
|---|---|---|---|---|---|---|---|---|
| 2026-03-06 | MORGAN STANLEY | 2,478,511 | 259,840 | -89.52 | 0.70 | -89.55 |
13F og NPORT arkivering
Detaljer om 13F-arkivering er gratis. Detaljer om NP-ansøgninger kræver et premium-medlemskab. Grønne rækker angiver nye positioner. Røde rækker angiver lukkede positioner. Klik på linket ikon for at se den fulde transaktionshistorik.
Opgrader
for at låse premium-data op og eksportere til Excel ![]() .
.
| Fil dato | Kilde | Investor | Type | Gennemsnitlig pris (Øst) |
Aktier | Δ Aktier (%) |
Rapporteret Værdi ($1000) |
Δ Værdi (%) |
Port Alloc (%) |
|
|---|---|---|---|---|---|---|---|---|---|---|
| 2026-02-17 | 13F | Fmr Llc | 4.252 | -21,00 | 61 | -12,86 | ||||
| 2026-02-13 | 13F | Mariner, LLC | 0 | -100,00 | 0 | |||||
| 2026-02-13 | 13F | Gen-Wealth Partners Inc | 131 | -74,95 | 2 | -83,33 | ||||
| 2025-11-13 | 13F | Arkhouse Management Co. LP | 38.206 | 501 | ||||||
| 2026-02-11 | 13F | Jpmorgan Chase & Co | 38.697 | -27,61 | 555 | -20,83 | ||||
| 2026-02-13 | 13F | State Street Corp | 774.604 | -2,29 | 11.191 | 6,81 | ||||
| 2026-02-02 | 13F | Truist Financial Corp | 11.745 | -25,80 | 169 | -18,84 | ||||
| 2026-02-06 | 13F | Pnc Financial Services Group, Inc. | 1.659 | -3,71 | 24 | 4,55 | ||||
| 2026-02-13 | 13F | Quarry LP | 0 | -100,00 | 0 | |||||
| 2026-02-10 | 13F | KERR FINANCIAL PLANNING Corp | 1.198 | 0,00 | 25 | 50,00 | ||||
| 2026-01-06 | 13F | E Six Thirteen, Llc | 18.146 | 0,00 | 260 | 9,24 | ||||
| 2026-02-06 | 13F | GPS Wealth Strategies Group, LLC | 0 | -100,00 | 0 | |||||
| 2026-02-09 | 13F | Quest Partners LLC | 8.538 | 0,00 | 123 | 8,93 | ||||
| 2026-02-17 | 13F | Irenic Capital Management LP | 336.817 | 4.833 | ||||||
| 2026-02-17 | 13F | Brevan Howard Capital Management LP | 0 | -100,00 | 0 | |||||
| 2025-11-14 | 13F | Integrated Wealth Concepts LLC | 0 | -100,00 | 0 | |||||
| 2026-01-23 | 13F | Sumitomo Mitsui Trust Holdings, Inc. | 41.697 | -0,95 | 598 | 8,33 | ||||
| 2026-02-13 | 13F | Arkadios Wealth Advisors | 14.493 | -4,80 | 208 | 4,02 | ||||
| 2026-02-17 | 13F | Advisory Services Network, LLC | 11.552 | 0,68 | 166 | 10,00 | ||||
| 2026-02-03 | 13F | Bokf, Na | 889 | 0,00 | 13 | 9,09 | ||||
| 2026-02-06 | 13F | Kingdom Financial Group LLC. | 788 | 11 | ||||||
| 2026-01-29 | 13F | Vanguard Group Inc | 3.586.897 | 0,14 | 51.472 | 9,53 | ||||
| 2026-02-13 | 13F | Manufacturers Life Insurance Company, The | 0 | -100,00 | 0 | |||||
| 2025-10-22 | 13F | Keystone Wealth Services, LLC | 0 | -100,00 | 0 | -100,00 | ||||
| 2026-02-17 | 13F | Mpwm Advisory Solutions, Llc | 0 | -100,00 | 0 | |||||
| 2026-02-05 | 13F | Soltis Investment Advisors LLC | 0 | -100,00 | 0 | |||||
| 2026-02-19 | 13F | Invesco Ltd. | 58.002 | -85,11 | 832 | -83,72 | ||||
| 2026-02-17 | 13F | Optiver Holding B.V. | 320 | 0,00 | 5 | 0,00 | ||||
| 2026-02-17 | 13F | Tower Research Capital LLC (TRC) | 1.232 | -37,46 | 18 | -32,00 | ||||
| 2026-02-17 | 13F | Conversant Capital LLC | 100 | 1 | ||||||
| 2026-02-06 | 13F | EverSource Wealth Advisors, LLC | 1.098 | 319,08 | 16 | 400,00 | ||||
| 2026-01-28 | 13F | WPG Advisers, LLC | 1.609 | -68,83 | 23 | -65,67 | ||||
| 2026-02-06 | 13F | Fortis Group Advisors, LLC | 4.507 | -30,11 | 65 | -23,81 | ||||
| 2026-02-13 | 13F | Golden State Wealth Management, LLC | 865 | -47,73 | 12 | -42,86 | ||||
| 2026-02-11 | 13F | Ameritas Investment Partners, Inc. | 2.989 | -17,61 | 43 | -10,64 | ||||
| 2026-01-29 | 13F | UBS Group AG | 141.260 | 88,21 | 2.027 | 106,00 | ||||
| 2026-02-13 | 13F | Wells Fargo & Company/mn | 44.439 | 47,24 | 638 | 61,27 | ||||
| 2026-02-06 | 13F | Larson Financial Group LLC | 935 | -21,16 | 13 | -13,33 | ||||
| 2026-02-12 | 13F | Steward Partners Investment Advisory, Llc | 2.995 | 0,00 | 43 | 7,69 | ||||
| 2026-02-17 | 13F | Susquehanna Fundamental Investments, Llc | 20.323 | -25,51 | 292 | -18,49 | ||||
| 2026-02-10 | 13F | Acadian Asset Management Llc | 1.963 | -51,79 | 0 | |||||
| 2026-02-12 | 13F | Wealthspire Advisors, LLC | 0 | -100,00 | 0 | |||||
| 2026-02-11 | 13F | Private Management Group Inc | 147.700 | 18,66 | 2.119 | 29,76 | ||||
| 2026-02-17 | 13F | Raffles Associates Lp | 97.078 | -9,27 | 1.393 | -0,71 | ||||
| 2026-01-22 | 13F | Bfsg, Llc | 1.425 | 27,23 | 20 | 42,86 | ||||
| 2026-01-22 | 13F | Glass Jacobson Investment Advisors llc | 13.387 | -2,58 | 192 | 6,67 | ||||
| 2026-02-13 | 13F | Squarepoint Ops LLC | 0 | -100,00 | 0 | |||||
| 2025-11-12 | 13F | Journey Strategic Wealth Llc | 0 | -100,00 | 0 | -100,00 | ||||
| 2026-02-12 | 13F | Jane Street Group, Llc | 182.785 | 128,18 | 2.623 | 149,71 | ||||
| 2026-02-02 | 13F | Strs Ohio | 460.600 | 169,67 | 6.610 | 195,04 | ||||
| 2026-01-21 | 13F | MBL Wealth, LLC | 10.590 | 0,00 | 152 | 9,42 | ||||
| 2026-02-11 | 13F | Simplex Trading, Llc | 1.329 | 19 | ||||||
| 2026-02-13 | 13F | Transamerica Financial Advisors, Inc. | 11 | 0 | ||||||
| 2026-02-17 | 13F | Citadel Advisors Llc | 97.835 | -44,98 | 1.404 | -39,86 | ||||
| 2026-02-10 | 13F | Intech Investment Management Llc | 17.139 | 0,00 | 246 | 9,38 | ||||
| 2026-02-10 | 13F/A | Northwestern Mutual Wealth Management Co | 4.864 | -21,59 | 70 | -14,81 | ||||
| 2026-01-22 | 13F | Brookwood Investment Group LLC | 64.797 | 2,88 | 930 | 12,47 | ||||
| 2026-02-10 | 13F | Daiwa Securities Group Inc. | 12.193 | 0,00 | 0 | |||||
| 2026-02-11 | 13F | Sunrise Financial Services, LLC | 246 | 4 | ||||||
| 2025-11-14 | 13F | Citadel Advisors Llc | Call | 0 | -100,00 | 0 | -100,00 | |||
| 2026-02-10 | 13F | Norges Bank | 93.500 | 1.342 | ||||||
| 2025-11-14 | 13F | Wood Tarver Financial Group, LLC | 0 | -100,00 | 0 | |||||
| 2026-02-10 | 13F | State of Wyoming | 20.383 | 292 | ||||||
| 2026-02-17 | 13F | J. Goldman & Co LP | 952.107 | 26,71 | 13.663 | 38,59 | ||||
| 2026-02-05 | 13F | Thrivent Financial For Lutherans | 26.603 | 0,00 | 0 | |||||
| 2026-02-13 | 13F | Rhumbline Advisers | 50.217 | -10,91 | 721 | -2,57 | ||||
| 2026-02-13 | 13F | Centaurus Financial, Inc. | 1.335.468 | 0,04 | 19 | 11,76 | ||||
| 2025-11-14 | 13F | StoneX Group Inc. | 0 | -100,00 | 0 | -100,00 | ||||
| 2026-02-13 | 13F | Healthcare Of Ontario Pension Plan Trust Fund | 96.400 | 1.383 | ||||||
| 2026-01-23 | 13F | Assetmark, Inc | 0 | -100,00 | 0 | |||||
| 2026-02-12 | 13F | Concorde Asset Management, LLC | 41.117 | -20,22 | 590 | -12,07 | ||||
| 2026-02-17 | 13F | Advisor Group Holdings, Inc. | 137.815 | -14,78 | 1.978 | -4,58 | ||||
| 2026-02-12 | 13F | State Board Of Administration Of Florida Retirement System | 10.330 | 0,00 | 148 | 9,63 | ||||
| 2026-01-29 | 13F | Dunhill Financial, LLC | 1 | 0 | ||||||
| 2025-10-17 | 13F | FSC Wealth Advisors, LLC | 0 | -100,00 | 0 | -100,00 | ||||
| 2026-02-13 | 13F | Police & Firemen's Retirement System of New Jersey | 10.609 | 0,00 | 152 | 9,35 | ||||
| 2026-02-17 | 13F | Coppell Advisory Solutions LLC | 16.535 | -2,67 | 238 | 7,21 | ||||
| 2026-02-17 | 13F | Susquehanna Portfolio Strategies, LLC | 16.608 | 238 | ||||||
| 2026-02-17 | 13F | Captrust Financial Advisors | 74.327 | -2,01 | 1.067 | 7,14 | ||||
| 2026-02-17 | 13F | Cetera Investment Advisers | 128.813 | -0,24 | 1.845 | 8,85 | ||||
| 2026-02-13 | 13F | Retirement Financial Solutions, Llc | 0 | -100,00 | 0 | |||||
| 2026-02-17 | 13F | Mercer Global Advisors Inc /adv | 19.102 | 274 | ||||||
| 2025-11-14 | 13F | Susquehanna International Group, Llp | 0 | -100,00 | 0 | |||||
| 2026-02-13 | 13F | SRS Capital Advisors, Inc. | 2.406 | -18,52 | 35 | -10,53 | ||||
| 2026-02-17 | 13F | Millennium Management Llc | 126.135 | 3,56 | 1.810 | 13,34 | ||||
| 2025-11-14 | 13F | Susquehanna International Group, Llp | Call | 0 | -100,00 | 0 | ||||
| 2026-02-17 | 13F | D. E. Shaw & Co., Inc. | 10.499 | -28,44 | 151 | -21,87 | ||||
| 2026-02-10 | 13F | Quantbot Technologies LP | 9.790 | 140 | ||||||
| 2026-01-15 | 13F | Nisa Investment Advisors, Llc | 9.177 | -10,32 | 133 | -2,22 | ||||
| 2026-02-06 | 13F | Global Retirement Partners, LLC | 2.171 | 0,05 | 31 | 10,71 | ||||
| 2026-02-06 | 13F | Bare Financial Services, Inc | 656 | 5,98 | 9 | 12,50 | ||||
| 2026-01-27 | 13F | Asset Management One Co., Ltd. | 46.481 | 0,00 | 673 | 10,34 | ||||
| 2026-02-04 | 13F | Summit Wealth Group Llc / Co | 0 | -100,00 | 0 | -100,00 | ||||
| 2026-02-17 | 13F | Aqr Capital Management Llc | 14.958 | -22,73 | 215 | -15,42 | ||||
| 2026-02-18 | 13F | GWM Advisors LLC | 6.990 | -25,81 | 100 | -18,70 | ||||
| 2026-02-11 | 13F | Los Angeles Capital Management Llc | 296 | 4 | ||||||
| 2025-11-07 | 13F/A | Merit Financial Group, LLC | 0 | -100,00 | 0 | -100,00 | ||||
| 2026-02-17 | 13F | Jump Financial, LLC | 29.417 | 42,98 | 422 | 56,88 | ||||
| 2026-02-06 | 13F | HighTower Advisors, LLC | 13.743 | 0,06 | 197 | 9,44 | ||||
| 2026-02-10 | 13F | Rothschild Investment Llc | 4.876 | 0,12 | 70 | 9,52 | ||||
| 2026-02-17 | 13F | Integrated Advisors Network LLC | 18.068 | -11,91 | 259 | -3,72 | ||||
| 2026-01-09 | 13F | Dynamic Advisor Solutions LLC | 10.179 | -7,16 | 146 | 2,10 | ||||
| 2026-02-12 | 13F | BlackRock, Inc. | 3.358.362 | 3,40 | 48.192 | 13,09 | ||||
| 2026-02-02 | 13F | CX Institutional | 0 | -100,00 | 0 | |||||
| 2026-02-13 | 13F | Beacon Capital Management, LLC | 27.564 | -19,89 | 396 | -12,42 | ||||
| 2025-11-12 | 13F | Bellwether Advisors, LLC | 0 | -100,00 | 0 | -100,00 | ||||
| 2026-04-02 | 13F | Ares Financial Consulting, LLC | 922 | 0,22 | 19 | 46,15 | ||||
| 2026-02-11 | 13F | Parallel Advisors, LLC | 0 | -100,00 | 0 | |||||
| 2026-02-13 | 13F | Aptus Capital Advisors, LLC | 11.883 | 171 | ||||||
| 2026-02-03 | 13F | McIlrath & Eck, LLC | 1.068 | 0,56 | 15 | 15,38 | ||||
| 2025-11-14 | 13F | Skopos Labs, Inc. | 0 | -100,00 | 0 | |||||
| 2026-04-06 | 13F | GAMMA Investing LLC | 9.052 | 0,57 | 189 | 46,51 | ||||
| 2026-02-17 | 13F | SageView Advisory Group, LLC | 7.340 | 105 | ||||||
| 2026-02-13 | 13F | Meixler Investment Management, Ltd. | 164.653 | 0,32 | 2.363 | 9,71 | ||||
| 2026-02-11 | 13F | Strategic Advocates LLC | 703 | 93,13 | 10 | 150,00 | ||||
| 2025-11-12 | 13F | Creekmur Asset Management LLC | 1.335 | 1,14 | 18 | 0,00 | ||||
| 2026-02-13 | 13F | Level Four Advisory Services, Llc | 25.144 | -2,71 | 361 | 6,19 | ||||
| 2026-02-13 | 13F | Sofos Investments, Inc. | 1.392 | 96,06 | 20 | 111,11 | ||||
| 2026-03-04 | 13F | SHP Wealth Management | 6.837 | 98 | ||||||
| 2026-02-03 | 13F | Mitsubishi UFJ Kokusai Asset Management Co., Ltd. | 26.506 | 0,00 | 384 | 10,66 | ||||
| 2026-02-17 | 13F | Point72 Asset Management, L.P. | 16.736 | 240 | ||||||
| 2026-02-17 | 13F | Zacks Investment Management | 0 | -100,00 | 0 | |||||
| 2026-02-20 | 13F | Sunbelt Securities, Inc. | 2.193 | -5,68 | 31 | 3,33 | ||||
| 2026-01-30 | 13F | Us Bancorp \de\ | 119 | 101,69 | 2 | |||||
| 2026-01-21 | 13F | Newbridge Financial Services Group, Inc. | 5.028 | 0,00 | 72 | 10,77 | ||||
| 2026-02-02 | 13F | Millstone Evans Group, LLC | 421 | 0,00 | 6 | 20,00 | ||||
| 2026-02-17 | 13F | Modern Wealth Management, LLC | 0 | -100,00 | 0 | |||||
| 2026-01-21 | 13F | Flagship Harbor Advisors, Llc | 1.060 | 15 | ||||||
| 2026-02-13 | 13F | Arrowstreet Capital, Limited Partnership | 0 | -100,00 | 0 | |||||
| 2026-01-26 | 13F | Northwest Capital Management Inc | 0 | -100,00 | 0 | |||||
| 2026-02-05 | 13F | Allworth Financial LP | 4.419 | 0,07 | 63 | 10,53 | ||||
| 2026-02-13 | 13F | Charles Schwab Investment Management Inc | 928.589 | 18,51 | 13.325 | 29,63 | ||||
| 2026-02-12 | 13F | MetLife Investment Management, LLC | 21.974 | -0,02 | 315 | 9,38 | ||||
| 2026-04-02 | 13F | MJT & Associates Financial Advisory Group, Inc. | 0 | -100,00 | 0 | |||||
| 2026-01-12 | 13F | Salem Investment Counselors Inc | 0 | -100,00 | 0 | |||||
| 2026-02-12 | 13F | CIBC Private Wealth Group, LLC | 1 | 0,00 | 0 | |||||
| 2026-02-05 | 13F | Cambridge Investment Research Advisors, Inc. | 202.068 | -14,75 | 3 | -33,33 | ||||
| 2026-02-11 | 13F | LPL Financial LLC | 278.773 | -7,40 | 4.000 | 1,29 | ||||
| 2026-02-10 | 13F | Bnp Paribas Arbitrage, Sa | 11.520 | 61,71 | 165 | 77,42 | ||||
| 2026-02-11 | 13F | Deutsche Bank Ag\ | 25.950 | 6,54 | 372 | 16,61 | ||||
| 2026-01-30 | 13F | Sigma Planning Corp | 101.779 | -11,50 | 947 | -37,20 | ||||
| 2026-02-12 | 13F | Commonwealth Equity Services, Llc | 86.605 | -14,22 | 1.243 | 124.100,00 | ||||
| 2026-01-14 | 13F | ORG Partners LLC | 787 | 0,00 | 11 | 10,00 | ||||
| 2026-02-11 | 13F | Cerity Partners LLC | 26.119 | 375 | ||||||
| 2026-02-17 | 13F | California State Teachers Retirement System | 2.266 | -14,43 | 33 | -5,88 | ||||
| 2026-02-10 | 13F | Basepoint Wealth LLC | 1.115 | 16 | ||||||
| 2026-01-26 | 13F | Decker Retirement Planning Inc. | 168 | 2 | ||||||
| 2026-02-12 | 13F | Dimensional Fund Advisors Lp | 223.770 | 14,44 | 3.211 | 25,19 | ||||
| 2026-02-10 | 13F | Goldman Sachs Group Inc | 145.895 | 30,46 | 2.094 | 42,67 | ||||
| 2026-02-06 | 13F | Resona Asset Management Co.,Ltd. | 14.545 | 0,00 | 210 | 10,53 | ||||
| 2026-02-17 | 13F | Man Group plc | 64.755 | 121,15 | 929 | 141,93 | ||||
| 2026-02-17 | 13F | Alliancebernstein L.p. | 37.590 | -4,33 | 539 | 4,66 | ||||
| 2026-01-08 | 13F | True Wealth Design, LLC | 7 | 0,00 | 0 | |||||
| 2026-02-04 | 13F | Bailard, Inc. | 0 | -100,00 | 0 | -100,00 | ||||
| 2026-02-10 | 13F | Nomura Asset Management Co Ltd | 51.300 | 0,00 | 736 | 9,36 | ||||
| 2026-02-13 | 13F | A4 Wealth Advisors LLC | 19.469 | -24,82 | 279 | -17,70 | ||||
| 2026-02-17 | 13F | Russell Investments Group, Ltd. | 9.585 | 11,70 | 138 | 22,32 | ||||
| 2026-04-07 | 13F | Farther Finance Advisors, LLC | 4.043 | 28,31 | 84 | 86,67 | ||||
| 2026-02-12 | 13F | Brinker Capital Investments, LLC | 10.726 | -8,21 | 154 | 0,00 | ||||
| 2025-10-15 | 13F | Stephens Consulting, LLC | 0 | -100,00 | 0 | |||||
| 2026-02-09 | 13F | Key FInancial Inc | 80 | 0,00 | 1 | 0,00 | ||||
| 2026-04-07 | 13F | Signaturefd, Llc | 927 | 0,00 | 19 | 46,15 | ||||
| 2026-01-26 | 13F | Strid Group, LLC | 17.424 | 0,00 | 250 | 9,65 | ||||
| 2026-01-14 | 13F | Spire Wealth Management | 1.971 | -9,63 | 28 | 0,00 | ||||
| 2026-01-23 | 13F | State of Alaska, Department of Revenue | 19.588 | 0,00 | 0 | |||||
| 2026-02-04 | 13F | HighPoint Advisor Group LLC | 11.542 | -29,27 | 166 | -22,90 | ||||
| 2026-02-17 | 13F | Northern Trust Corp | 270.403 | -7,77 | 3.880 | 0,88 | ||||
| 2026-02-09 | 13F | Huntington National Bank | 1 | 0,00 | 0 | |||||
| 2026-02-09 | 13F | Geode Capital Management, Llc | 938.414 | -1,34 | 13.469 | 7,92 | ||||
| 2026-02-17 | 13F | Bank Of America Corp /de/ | 41.994 | 25,93 | 603 | 37,76 | ||||
| 2026-02-12 | 13F | Hrt Financial Lp | 45.667 | 1 | ||||||
| 2026-02-13 | 13F | Verition Fund Management LLC | 11.600 | -46,05 | 166 | -41,13 | ||||
| 2026-02-05 | 13F | Tucker Asset Management Llc | 170 | 2 | ||||||
| 2026-01-26 | 13F | PFG Investments, LLC | 11.220 | -22,42 | 161 | -14,81 | ||||
| 2026-02-11 | 13F | Cedar Mountain Advisors, LLC | 129 | 0,00 | 2 | 0,00 | ||||
| 2026-02-17 | 13F | Public Employees Retirement System Of Ohio | 12.811 | 184 | ||||||
| 2026-01-28 | 13F | N.E.W. Advisory Services LLC | 114 | 0,00 | 2 | 0,00 | ||||
| 2026-02-17 | 13F | Ameriprise Financial Inc | 442.200 | 545,17 | 6.346 | 605,78 | ||||
| 2026-02-05 | 13F | Amalgamated Bank | 1.157 | -6,32 | 0 | |||||
| 2026-02-17 | 13F | XTX Topco Ltd | 10.661 | 153 | ||||||
| 2026-02-02 | 13F | CENTRAL TRUST Co | 0 | -100,00 | 0 | |||||
| 2026-01-20 | 13F | Accel Wealth Management | 10.540 | -12,14 | 151 | -3,82 | ||||
| 2026-02-13 | 13F | Parkside Financial Bank & Trust | 50 | 0,00 | 1 | |||||
| 2026-01-07 | 13F | TCP Asset Management, LLC | 85.224 | 0,51 | 1.223 | 9,89 | ||||
| 2026-02-02 | 13F | Cornerstone Planning Group LLC | 63 | 152,00 | 1 | |||||
| 2026-02-13 | 13F | Victory Capital Management Inc | 33.756 | 203,83 | 484 | 233,79 | ||||
| 2026-02-04 | 13F | Ameritas Advisory Services, LLC | 0 | -100,00 | 0 | |||||
| 2026-01-08 | 13F | Wealth Enhancement Advisory Services, Llc | 16.948 | 5,14 | 233 | 5,94 | ||||
| 2025-11-12 | 13F | Ameriflex Group, Inc. | 0 | -100,00 | 0 | |||||
| 2025-11-14 | 13F | Strategic Wealth Partners, Ltd. | 1.483 | -1,33 | 19 | 0,00 | ||||
| 2026-01-26 | 13F | Cwm, Llc | 54.255 | -4,00 | 1 | |||||
| 2026-01-13 | 13F | Mather Group, Llc. | 0 | -100,00 | 0 | |||||
| 2025-11-24 | 13F | Burkett Financial Services, Llc | 0 | -100,00 | 0 | |||||
| 2026-02-17 | 13F | Warren Averett Asset Management, LLC | 12.575 | 13,71 | 180 | 24,14 | ||||
| 2026-02-12 | 13F | Rossby Financial, LCC | 200 | 0,00 | 3 | 0,00 | ||||
| 2026-02-13 | 13F | K2 Principal Fund, L.p. | 209.114 | -11,92 | 3.001 | -3,66 | ||||
| 2025-11-13 | 13F | Promus Capital, LLC | 1.391 | 18 | ||||||
| 2026-02-12 | 13F | Quadrant Capital Group Llc | 114 | 0,00 | 2 | 0,00 | ||||
| 2026-02-12 | 13F | Nuveen, LLC | 76.739 | 0,00 | 1.101 | 9,44 | ||||
| 2026-02-17 | 13F | Tcw Group Inc | 473.800 | 26,72 | 6.799 | 38,61 | ||||
| 2026-02-17 | 13F | Jones Financial Companies Lllp | 416 | 0,00 | 6 | 0,00 | ||||
| 2026-02-14 | 13F | Whipplewood Advisors, LLC | 679 | 0,00 | 10 | 12,50 | ||||
| 2026-02-12 | 13F | Voya Investment Management Llc | 177.755 | -13,32 | 2.551 | -5,20 | ||||
| 2026-02-17 | 13F | Guardian Wealth Advisors, Llc / Nc | 11.876 | 170 | ||||||
| 2026-01-28 | 13F | Geneos Wealth Management Inc. | 2.637 | -40,78 | 38 | -36,21 | ||||
| 2026-02-10 | 13F | Envestnet Asset Management Inc | 18.308 | -23,21 | 260 | -16,67 | ||||
| 2026-02-06 | 13F | Cullen/frost Bankers, Inc. | 557 | 0,91 | 8 | 0,00 | ||||
| 2026-02-17 | 13F | Raymond James Financial Inc | 11.783 | -31,80 | 169 | -25,22 | ||||
| 2026-02-12 | 13F | Triumph Capital Management | 186 | -82,22 | 3 | -84,62 | ||||
| 2026-02-17 | 13F | State Of Wisconsin Investment Board | 40.269 | 184,20 | 578 | 211,89 | ||||
| 2026-02-06 | 13F | IFP Advisors, Inc | 12 | 0,00 | 0 | |||||
| 2026-02-17 | 13F | Price T Rowe Associates Inc /md/ | 21.879 | 11,92 | 0 | |||||
| 2026-02-06 | 13F | Covestor Ltd | 6 | -14,29 | 0 | |||||
| 2026-02-10 | 13F | Bank of New York Mellon Corp | 153.472 | -0,65 | 2.202 | 8,69 | ||||
| 2026-02-13 | 13F | Citigroup Inc | 1.352 | -49,27 | 19 | -44,12 | ||||
| 2026-02-17 | 13F | Quantinno Capital Management LP | 57.771 | 22,86 | 829 | 34,58 | ||||
| 2025-11-05 | 13F | Bessemer Group Inc | 0 | -100,00 | 0 | |||||
| 2026-02-10 | 13F | Clear Harbor Asset Management, LLC | 80.683 | -6,08 | 1.158 | 2,66 | ||||
| 2026-02-17 | 13F | Creative Planning | 11.265 | -1,66 | 162 | 7,33 | ||||
| 2025-11-13 | 13F | Ckw Financial Group | 0 | -100,00 | 0 | |||||
| 2026-01-29 | 13F | Financial Life Planners | 0 | -100,00 | 0 | |||||
| 2026-02-12 | 13F | New York State Common Retirement Fund | 10.605 | 0,00 | 152 | 9,35 | ||||
| 2026-01-21 | 13F | Prime Capital Investment Advisors, LLC | 16.881 | 6,87 | 242 | 16,91 | ||||
| 2026-02-09 | 13F | Legal & General Group Plc | 3.347 | 0,00 | 48 | 11,63 | ||||
| 2026-02-11 | 13F | J.w. Cole Advisors, Inc. | 39.820 | -8,81 | 564 | -1,57 | ||||
| 2026-02-04 | 13F | Tsfg, Llc | 2.051 | 0,00 | 0 | |||||
| 2026-01-08 | 13F | Choice Wealth Advisors, LLC | 23.862 | -7,43 | 342 | 1,18 | ||||
| 2026-01-27 | 13F | Elevated Capital Advisors, LLC | 380 | 5 | ||||||
| 2025-11-04 | 13F | Gitterman Wealth Management, LLC | 0 | -100,00 | 0 | |||||
| 2026-04-06 | 13F | Versant Capital Management, Inc | 3.755 | 5,89 | 78 | 56,00 | ||||
| 2026-02-17 | 13F | Royal Bank Of Canada | 28.393 | 68,52 | 408 | 84,62 | ||||
| 2026-01-21 | 13F | Sound Income Strategies, LLC | 694 | -50,60 | 10 | -50,00 | ||||
| 2026-02-09 | 13F | Harbour Investments, Inc. | 18.757 | -4,04 | 269 | 5,08 | ||||
| 2025-11-07 | 13F | Atticus Wealth Management, Llc | 0 | -100,00 | 0 | -100,00 | ||||
| 2026-02-13 | 13F | MAI Capital Management | 84 | 16,67 | 1 | |||||
| 2026-02-13 | 13F | Barclays Plc | 77.440 | 38,09 | 1.111 | 45,42 | ||||
| 2026-02-17 | 13F | MIRAE ASSET GLOBAL ETFS HOLDINGS Ltd. | 17.116 | -1,11 | 246 | 7,93 | ||||
| 2026-02-13 | 13F | Ubs Asset Management Americas Inc | 79 | 1 | ||||||
| 2026-02-06 | 13F | Creative Financial Designs Inc /adv | 2.100 | -3,93 | 30 | 7,14 | ||||
| 2026-02-06 | 13F | Entrust Financial Llc | 386 | 6 | ||||||
| 2026-02-03 | 13F | International Assets Investment Management, Llc | 8.796 | -40,54 | 126 | -37,00 | ||||
| 2026-02-13 | 13F | Kestra Advisory Services, LLC | 0 | -100,00 | 0 | |||||
| 2025-10-30 | 13F | Twin Peaks Wealth Advisors, LLC | 0 | -100,00 | 0 | -100,00 | ||||
| 2026-02-13 | 13F | Morgan Stanley | 2.500.507 | 37,12 | 35.882 | 49,98 | ||||
| 2026-02-11 | 13F | MCF Advisors LLC | 2.175 | 0,00 | 31 | 10,71 | ||||
| 2025-11-14 | 13F | Mount Yale Investment Advisors, LLC | 0 | -100,00 | 0 | -100,00 | ||||
| 2026-02-13 | 13F | Sterling Capital Management LLC | 2.122 | -16,46 | 30 | -9,09 |
Other Listings
| DE:T8CA | 17,90 € |