Grundlæggende statistik
| Institutionelle aktier (lange) | 33.905.455 - 47,82% (ex 13D/G) - change of -1,90MM shares -5,30% MRQ |
| Institutionel værdi (lang) | $ 510.278 USD ($1000) |
Institutionelt ejerskab og aktionærer
Omeros Corporation (US:OMER) har 181 institutionelle ejere og aktionærer, der har indsendt 13D/G- eller 13F-formularer til Securities Exchange Commission (SEC). Disse institutioner har i alt 33,905,455 aktier. Største aktionærer omfatter BlackRock, Inc., Vanguard Group Inc, Ingalls & Snyder Llc, UBS Group AG, Stifel Financial Corp, Geode Capital Management, Llc, State Street Corp, Susquehanna International Group, Llp, Ikarian Capital, LLC, and Kotler Kevin .
Omeros Corporation (NasdaqGM:OMER) institutionel ejerskabsstruktur viser aktuelle positioner i virksomheden efter institutioner og fonde, samt seneste ændringer i positionsstørrelse. Større aktionærer kan omfatte individuelle investorer, investeringsforeninger, hedgefonde eller institutioner. Skema 13D angiver, at investoren besidder (eller besidder) mere end 5 % af virksomheden og har til hensigt (eller har til hensigt at) aktivt at forfølge en ændring i forretningsstrategi. Skema 13G indikerer en passiv investering på over 5%.
The share price as of March 19, 2026 is 11,12 / share. Previously, on March 20, 2025, the share price was 9,10 / share. This represents an increase of 22,20% over that period.

Fondens stemningsscore
Fund Sentiment Score (fka Ownership Accumulation Score) finder de aktier, der bliver mest købt af fonde. Det er resultatet af en sofistikeret, multi-faktor kvantitativ model, der identificerer virksomheder med de højeste niveauer af institutionel akkumulering. Scoringsmodellen bruger en kombination af den samlede stigning i oplyste ejere, ændringerne i porteføljeallokeringer i disse ejere og andre målinger. Tallet går fra 0 til 100, hvor højere tal indikerer et højere niveau af akkumulering for sine jævnaldrende, og 50 er gennemsnittet.
Opdateringsfrekvens: Dagligt
Se Ownership Explorer, som giver en liste over højest rangerende virksomheder.
AI+ Ask Fintel’s AI assistant about Omeros Corporation.
Select a question to share a public post with an AI-crafted answer.
Thinking of good questions…
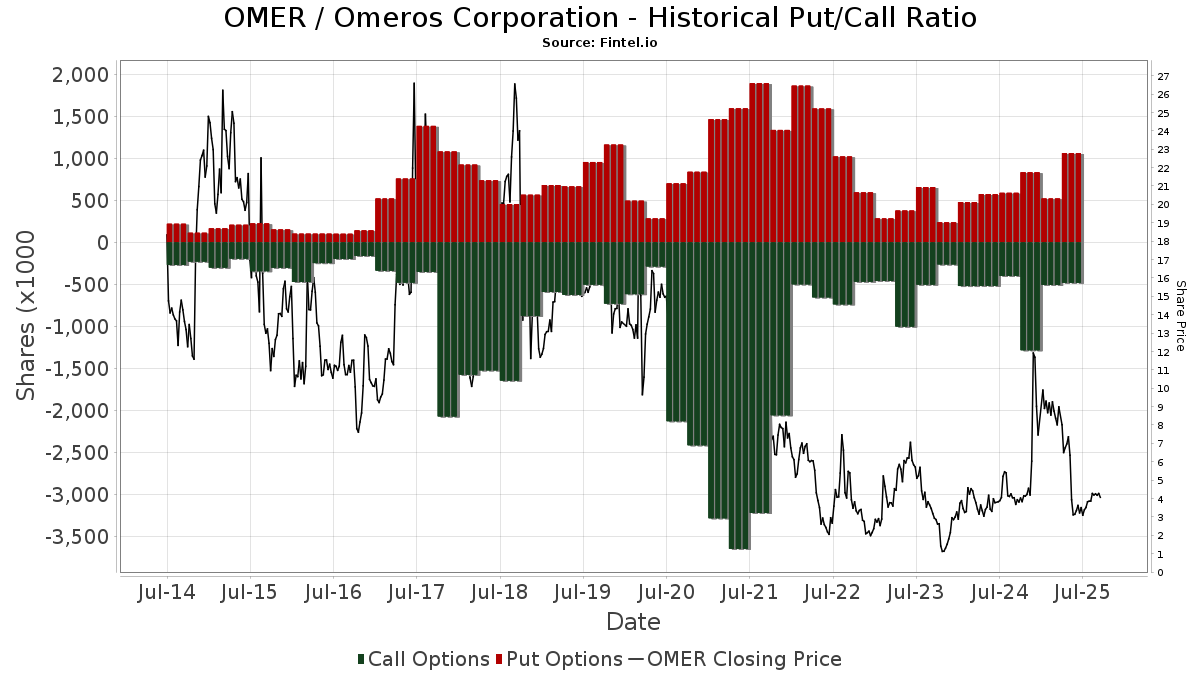
Institutionel Put/Call-forhold
Ud over at indberette standardaktie- og gældsudstedelser skal institutter med mere end 100 mill. aktiver under forvaltning også oplyse deres put- og call-optionsbeholdninger. Da salgsoptioner generelt indikerer negativ stemning, og købsoptioner indikerer positiv stemning, kan vi få en fornemmelse af den overordnede institutionelle stemning ved at plotte forholdet mellem put og kald. Diagrammet til højre viser det historiske put/call-forhold for dette instrument.
Brug af Put/Call Ratio som en indikator for investorernes stemning overvinder en af de vigtigste mangler ved at bruge totalt institutionelt ejerskab, som er, at en betydelig mængde af aktiver under forvaltning investeres passivt for at spore indekser. Passivt forvaltede fonde køber typisk ikke optioner, så indikatoren for put/call-forholdet følger mere nøje følelsen af aktivt forvaltede fonde.
13D/G-arkivering
Vi præsenterer 13D/G ansøgninger separat fra 13F ansøgninger på grund af den forskellige behandling af SEC. 13D/G-ansøgninger kan indgives af grupper af investorer (med én ledende), hvorimod 13F-ansøgninger ikke kan. Dette resulterer i situationer, hvor en investor kan indsende en 13D/G, der rapporterer én værdi for de samlede aktier (der repræsenterer alle de aktier, der ejes af investorgruppen), men derefter indsender en 13F, der rapporterer en anden værdi for de samlede aktier (der udelukkende repræsenterer deres egne) ejendomsret). Det betyder, at aktieejerskab af 13D/G-arkiver og 13F-arkiveringer ofte ikke er direkte sammenlignelige, så vi præsenterer dem separat.
Bemærk: Fra den 16. maj 2021 viser vi ikke længere ejere, der ikke har indsendt en 13D/G inden for det seneste år. Tidligere viste vi den fulde historie af 13D/G-arkiver. Generelt skal enheder, der er forpligtet til at indgive 13D/G-ansøgninger, indgive mindst årligt, før de indsender en afsluttende ansøgning. Dog forlader fonde nogle gange positioner uden at indsende en afsluttende ansøgning (dvs. de afvikler), så visning af den fulde historie resulterede nogle gange i forvirring om det nuværende ejerskab. For at undgå forvirring viser vi nu kun 'aktuelle' ejere - det vil sige - ejere, der har anmeldt inden for det seneste år.
Upgrade to unlock premium data.
| Fil dato | Form | Investor | Forrige Aktier |
Seneste Aktier |
Δ Aktier (Procent) |
Ejendomsret (Procent) |
Δ Ejerskab (Procent) |
|
|---|---|---|---|---|---|---|---|---|
| 2026-01-30 | VANGUARD GROUP INC | 3,346,958 | 4,013,315 | 19.91 | 5.66 | 15.27 | ||
| 2025-02-21 | INGALLS & SNYDER LLC | 4,431,188 | 4,161,315 | -6.09 | 7.20 | 2.86 |
13F og NPORT arkivering
Detaljer om 13F-arkivering er gratis. Detaljer om NP-ansøgninger kræver et premium-medlemskab. Grønne rækker angiver nye positioner. Røde rækker angiver lukkede positioner. Klik på linket ikon for at se den fulde transaktionshistorik.
Opgrader
for at låse premium-data op og eksportere til Excel ![]() .
.
| Fil dato | Kilde | Investor | Type | Gennemsnitlig pris (Øst) |
Aktier | Δ Aktier (%) |
Rapporteret Værdi ($1000) |
Δ Værdi (%) |
Port Alloc (%) |
|
|---|---|---|---|---|---|---|---|---|---|---|
| 2026-02-06 | 13F | EverSource Wealth Advisors, LLC | 115 | 0,00 | 2 | |||||
| 2026-02-12 | 13F | Nuveen, LLC | 153.187 | 74,84 | 2.631 | 632,59 | ||||
| 2025-09-29 | NP | SUNAMERICA SERIES TRUST - SA Small Cap Index Portfolio Class 1 | 5.764 | -9,34 | 22 | -52,17 | ||||
| 2026-01-21 | 13F | Apella Capital, LLC | 14.288 | 0,00 | 245 | 75,00 | ||||
| 2026-02-17 | 13F | Bridgeway Capital Management Inc | 56.715 | 0,00 | 974 | 319,83 | ||||
| 2026-01-16 | 13F | Empirical Financial Services, LLC d.b.a. Empirical Wealth Management | 10.500 | -74,07 | 180 | 8,43 | ||||
| 2026-02-04 | 13F | Pandora Wealth, Inc. | 330 | 0,00 | 6 | 400,00 | ||||
| 2026-02-17 | 13F | Alliancebernstein L.p. | 73.490 | 8,73 | 1.262 | 355,60 | ||||
| 2026-02-17 | 13F | Bank Of America Corp /de/ | 114.808 | -58,31 | 1.972 | 74,58 | ||||
| 2026-02-12 | 13F | Dimensional Fund Advisors Lp | 96.948 | 1.665 | ||||||
| 2026-02-03 | 13F | International Assets Investment Management, Llc | 5.000 | -67,85 | 86 | 84,78 | ||||
| 2026-02-12 | 13F | Bank Of Montreal /can/ | 601.643 | 6,85 | 10.333 | 347,70 | ||||
| 2026-02-17 | 13F | Two Sigma Investments, Lp | 524.757 | -43,77 | 9.013 | 135,55 | ||||
| 2026-02-02 | 13F | Fifth Third Bancorp | 1.000 | 0,00 | 17 | 325,00 | ||||
| 2026-01-13 | 13F/A | Sanctuary Advisors, LLC | 0 | -100,00 | 0 | -100,00 | ||||
| 2026-01-08 | 13F | Wealth Enhancement Advisory Services, Llc | 31.728 | 9,04 | 429 | 232,56 | ||||
| 2025-11-14 | 13F | Capstone Investment Advisors, Llc | Put | 111.400 | 221,04 | 457 | 338,46 | |||
| 2026-02-18 | 13F | GWM Advisors LLC | 1.000 | 17 | ||||||
| 2025-10-07 | 13F | Sonora Investment Management Group, LLC | Call | 12.000 | 49 | |||||
| 2026-01-27 | 13F | Brighton Jones Llc | 0 | -100,00 | 0 | -100,00 | ||||
| 2026-01-09 | 13F | SG Americas Securities, LLC | 18.825 | -58,47 | 0 | |||||
| 2026-02-09 | 13F | Geode Capital Management, Llc | 1.631.350 | 6,25 | 28.026 | 345,12 | ||||
| 2026-02-17 | 13F | Ancora Advisors, LLC | 59.250 | 1.875,00 | 1.018 | 8.375,00 | ||||
| 2026-02-17 | 13F | Ameriprise Financial Inc | 117.004 | 0,40 | 2.010 | 321,17 | ||||
| 2026-02-06 | 13F | IFP Advisors, Inc | 26 | 0,00 | 0 | |||||
| 2026-01-27 | 13F | Zurcher Kantonalbank (Zurich Cantonalbank) | 765 | -23,50 | 13 | 225,00 | ||||
| 2026-02-10 | 13F | Bank of New York Mellon Corp | 165.782 | 2,12 | 2.847 | 328,12 | ||||
| 2026-02-17 | 13F | Canada Pension Plan Investment Board | 21.700 | 373 | ||||||
| 2026-02-17 | 13F | Raymond James Financial Inc | 12.242 | 210 | ||||||
| 2026-02-13 | 13F | Charles Schwab Investment Management Inc | 593.222 | 7,18 | 10.189 | 349,01 | ||||
| 2026-02-27 | 13F | Strategic Investment Solutions, Inc. /IL | 1.827 | 0,11 | 31 | 342,86 | ||||
| 2025-09-26 | NP | FLXSX - Fidelity Flex Small Cap Index Fund This fund is a listed as child fund of Fmr Llc and if that institution has disclosed ownership in this security, then these positions will not be double counted when calculating total shares and total value | 12.642 | 15,22 | 49 | -40,00 | ||||
| 2026-02-09 | 13F | Legal & General Group Plc | 6.971 | -1,61 | 120 | 310,34 | ||||
| 2026-02-19 | 13F | Invesco Ltd. | 154.782 | 26,79 | 2.658 | 431,60 | ||||
| 2026-02-13 | 13F | Mml Investors Services, Llc | 77.875 | 31,60 | 1.338 | 452,48 | ||||
| 2026-02-17 | 13F | California State Teachers Retirement System | 4.055 | -0,02 | 70 | 331,25 | ||||
| 2026-02-17 | 13F | Susquehanna International Group, Llp | Put | 593.500 | 248,71 | 10.196 | 1.362,84 | |||
| 2026-02-13 | 13F | Sterling Capital Management LLC | 901 | 39,69 | 15 | 650,00 | ||||
| 2026-02-17 | 13F | Susquehanna International Group, Llp | Call | 1.159.600 | 108,75 | 19.922 | 774,88 | |||
| 2026-02-17 | 13F | Farallon Capital Management Llc | 23.000 | 395 | ||||||
| 2026-02-13 | 13F | Ubs Asset Management Americas Inc | 231 | 4 | ||||||
| 2026-02-17 | 13F | Susquehanna International Group, Llp | 741.895 | 570,92 | 12.742 | 2.712,80 | ||||
| 2026-02-17 | 13F | Graham Capital Management, L.P. | 13.222 | -61,63 | 227 | 60,99 | ||||
| 2026-01-21 | 13F | Newbridge Financial Services Group, Inc. | 34.310 | -74,49 | 589 | 6,90 | ||||
| 2026-02-12 | 13F | American Financial Group Inc | 64.113 | 0,00 | 1.101 | 320,23 | ||||
| 2026-02-17 | 13F | Royal Bank Of Canada | Call | 24.900 | 428 | |||||
| 2026-02-17 | 13F | Royal Bank Of Canada | 498.399 | -8,33 | 8.560 | 284,03 | ||||
| 2026-01-23 | 13F | Farther Finance Advisors, LLC | 7.106 | 16,45 | 122 | 388,00 | ||||
| 2026-02-12 | 13F | New York State Common Retirement Fund | 20.713 | 81,49 | 356 | 671,74 | ||||
| 2026-02-09 | 13F | Jefferies Financial Group Inc. | Put | 0 | -100,00 | 0 | ||||
| 2026-02-17 | 13F | Optiver Holding B.V. | 3.747 | 596,47 | 64 | 3.100,00 | ||||
| 2026-02-11 | 13F | Los Angeles Capital Management Llc | 30.920 | 233 | ||||||
| 2026-02-17 | 13F | MIRAE ASSET GLOBAL ETFS HOLDINGS Ltd. | 30.585 | 1,32 | 525 | 326,83 | ||||
| 2026-02-17 | 13F | Engineers Gate Manager LP | 20.082 | 345 | ||||||
| 2026-02-06 | 13F | Larson Financial Group LLC | 151 | 0,67 | 3 | |||||
| 2026-02-13 | 13F | SRS Capital Advisors, Inc. | 5.255 | 56,35 | 90 | 592,31 | ||||
| 2026-02-10 | 13F | Rothschild Investment Llc | 60 | 1 | ||||||
| 2026-02-13 | 13F | State Street Corp | 1.573.526 | 26,93 | 27.025 | 431,78 | ||||
| 2026-02-13 | 13F | Squarepoint Ops LLC | 0 | -100,00 | 0 | -100,00 | ||||
| 2026-02-13 | 13F | Barclays Plc | 120.490 | -8,68 | 2.069 | 283,15 | ||||
| 2025-09-26 | NP | USMIX - Extended Market Index Fund | 6.320 | -2,32 | 24 | -48,94 | ||||
| 2026-01-30 | 13F | Us Bancorp \de\ | 0 | -100,00 | 0 | |||||
| 2026-02-10 | 13F/A | Northwestern Mutual Wealth Management Co | 500 | 0,00 | 9 | 300,00 | ||||
| 2026-02-12 | 13F | Voya Investment Management Llc | 11.405 | 1,93 | 196 | 333,33 | ||||
| 2026-02-13 | 13F | Truvestments Capital Llc | 1.682 | 0,00 | 29 | 366,67 | ||||
| 2026-02-03 | 13F | SBI Securities Co., Ltd. | 208 | 0,00 | 4 | |||||
| 2026-02-09 | 13F | Quest Partners LLC | 82.597 | 8.259.600,00 | 1.419 | |||||
| 2026-02-12 | 13F | Renaissance Technologies Llc | 0 | -100,00 | 0 | -100,00 | ||||
| 2026-02-17 | 13F | Boothbay Fund Management, Llc | Put | 247.000 | 4.242 | |||||
| 2025-09-26 | NP | SLPIX - Small-cap Profund Investor Class | 51 | -7,27 | 0 | |||||
| 2026-02-13 | 13F | MAI Capital Management | 0 | -100,00 | 0 | -100,00 | ||||
| 2026-02-13 | 13F | Stifel Financial Corp | 1.809.766 | -0,14 | 31.083 | 318,33 | ||||
| 2026-02-14 | 13F | Rockefeller Capital Management L.P. | 195 | 3 | ||||||
| 2026-02-17 | 13F | State Of Wisconsin Investment Board | 0 | -100,00 | 0 | -100,00 | ||||
| 2026-02-06 | 13F | ProShare Advisors LLC | 15.171 | 12,10 | 261 | 372,73 | ||||
| 2026-02-17 | 13F | Boothbay Fund Management, Llc | Call | 141.300 | 2.427 | |||||
| 2026-02-10 | 13F | State of Wyoming | 1.433 | 25 | ||||||
| 2026-02-11 | 13F | Ameritas Investment Partners, Inc. | 5.027 | 0,00 | 86 | 330,00 | ||||
| 2026-01-28 | 13F | Badgley Phelps Wealth Managers, LLC | 263.556 | 0,00 | 4.527 | 319,07 | ||||
| 2026-02-17 | 13F | Fmr Llc | 18.068 | 36,98 | 310 | 474,07 | ||||
| 2026-02-10 | 13F | Intech Investment Management Llc | 29.967 | 16,86 | 515 | 389,52 | ||||
| 2026-02-13 | 13F | Ingalls & Snyder Llc | Call | 0 | -100,00 | 0 | ||||
| 2026-02-17 | 13F | Toronto Dominion Bank | Put | 317.900 | 1.171,60 | 5.460 | 5.251,96 | |||
| 2026-02-05 | 13F | Amalgamated Bank | 2.069 | 0,83 | 0 | |||||
| 2026-02-05 | 13F | Plante Moran Financial Advisors, LLC | 1.000 | 0,00 | 17 | 325,00 | ||||
| 2026-02-17 | 13F | Caption Management, LLC | Call | 475.700 | 8.170 | |||||
| 2026-02-13 | 13F | Walleye Trading LLC | Put | 43.200 | 742 | |||||
| 2026-02-13 | 13F | Walleye Trading LLC | Call | 35.400 | 608 | |||||
| 2026-01-21 | 13F | Rocky Mountain Advisers, Llc | 50 | 0,00 | 1 | |||||
| 2026-02-17 | 13F | Brevan Howard Capital Management LP | 64.957 | -49,80 | 1.116 | 110,38 | ||||
| 2025-11-05 | 13F | SPC Financial, Inc. | 17.400 | 0,00 | 71 | 36,54 | ||||
| 2026-02-11 | 13F | Jpmorgan Chase & Co | 37.191 | -91,06 | 639 | -62,60 | ||||
| 2026-02-13 | 13F | Walleye Trading LLC | 69.653 | 409,42 | 1.196 | 2.035,71 | ||||
| 2026-02-17 | 13F | Susquehanna Portfolio Strategies, LLC | 92.759 | -45,78 | 1.593 | 127,25 | ||||
| 2025-09-26 | NP | TISBX - TIAA-CREF Small-Cap Blend Index Fund Institutional Class | 73.296 | 0,00 | 284 | -47,40 | ||||
| 2026-02-12 | 13F | EAM Investors, LLC | 207.480 | 3.563 | ||||||
| 2026-02-09 | 13F | Coldstream Capital Management Inc | 53.605 | 107,53 | 921 | 776,19 | ||||
| 2026-02-17 | 13F | Polar Asset Management Partners Inc. | Call | 200.000 | -85,45 | 3.435 | -39,02 | |||
| 2026-02-17 | 13F | Polar Asset Management Partners Inc. | 68.800 | -95,41 | 1.182 | -80,78 | ||||
| 2025-09-26 | NP | FSSNX - Fidelity Small Cap Index Fund This fund is a listed as child fund of Fmr Llc and if that institution has disclosed ownership in this security, then these positions will not be double counted when calculating total shares and total value | 564.494 | -0,18 | 2.185 | -47,45 | ||||
| 2026-01-15 | 13F | Nisa Investment Advisors, Llc | 804 | -51,97 | 14 | 116,67 | ||||
| 2026-02-17 | 13F | Northern Trust Corp | 526.732 | -1,67 | 9.047 | 311,93 | ||||
| 2025-09-24 | NP | SWTSX - Schwab Total Stock Market Index Fund This fund is a listed as child fund of Charles Schwab Investment Management Inc and if that institution has disclosed ownership in this security, then these positions will not be double counted when calculating total shares and total value | 26.846 | 0,00 | 104 | -47,72 | ||||
| 2025-09-24 | NP | BLACKROCK FUNDS - iShares Russell Small/Mid-Cap Index Fund Investor A | 9.808 | 27,74 | 38 | -33,93 | ||||
| 2026-02-05 | 13F | Cambridge Investment Research Advisors, Inc. | 81.643 | 348,12 | 1 | |||||
| 2026-02-10 | 13F | Axq Capital, Lp | 29.151 | 501 | ||||||
| 2026-02-17 | 13F | Two Sigma Advisers, Lp | 76.100 | -86,84 | 1.307 | -44,85 | ||||
| 2026-02-17 | 13F | Creative Planning | 16.916 | 291 | ||||||
| 2025-09-29 | NP | KCXIX - Knights of Columbus U.S. All Cap Index Fund I Shares | 244 | 1,67 | 1 | -100,00 | ||||
| 2026-02-13 | 13F | Rhumbline Advisers | 100.105 | -5,45 | 1.719 | 296,08 | ||||
| 2026-02-17 | 13F | Ikarian Capital, LLC | Put | 950.000 | 16.316 | |||||
| 2025-11-14 | 13F/A | Skopos Labs, Inc. | 49.197 | 0,00 | 157 | 6,80 | ||||
| 2026-01-26 | 13F | Mirae Asset Global Investments Co., Ltd. | 3.445 | 30,94 | 59 | 490,00 | ||||
| 2026-02-17 | 13F | Ikarian Capital, LLC | Call | 550.000 | 9.446 | |||||
| 2026-02-11 | 13F | Parallel Advisors, LLC | 3.909 | 23,74 | 67 | 458,33 | ||||
| 2026-02-13 | 13F | Colony Group, LLC | 31.034 | 533 | ||||||
| 2026-02-17 | 13F | Toronto Dominion Bank | Call | 1.000 | 17 | |||||
| 2026-02-13 | 13F | Wells Fargo & Company/mn | 165.280 | 23,25 | 2.839 | 416,94 | ||||
| 2026-02-17 | 13F | Jump Financial, LLC | 228.000 | 3.916 | ||||||
| 2026-02-26 | 13F/A | Sculptor Capital LP | Put | 0 | -100,00 | 0 | -100,00 | |||
| 2026-02-09 | 13F | Hartland & Co., LLC | 0 | -100,00 | 0 | |||||
| 2026-02-26 | 13F/A | Sculptor Capital LP | 0 | -100,00 | 0 | -100,00 | ||||
| 2026-02-13 | 13F | Manufacturers Life Insurance Company, The | 19.850 | -0,24 | 341 | 319,75 | ||||
| 2025-09-26 | NP | FZROX - Fidelity ZERO Total Market Index Fund This fund is a listed as child fund of Fmr Llc and if that institution has disclosed ownership in this security, then these positions will not be double counted when calculating total shares and total value | 26.430 | 0,00 | 102 | -47,42 | ||||
| 2026-02-13 | 13F/A | Virtus ETF Advisers LLC | 0 | -100,00 | 0 | -100,00 | ||||
| 2025-09-24 | NP | BLACKROCK FUNDS - iShares Total U.S. Stock Market Index Fund Investor A | 4.825 | 0,00 | 19 | -48,57 | ||||
| 2026-02-13 | 13F | Clutterbuck Capital Management LLC | 150.000 | 2.576 | ||||||
| 2025-11-14 | 13F | Corton Capital Inc. | 0 | -100,00 | 0 | -100,00 | ||||
| 2025-11-14 | 13F | State Board Of Administration Of Florida Retirement System | 0 | -100,00 | 0 | -100,00 | ||||
| 2026-02-17 | 13F | Caption Management, LLC | Put | 0 | -100,00 | 0 | ||||
| 2026-02-13 | 13F | Vontobel Holding Ltd. | 5.450 | 94 | ||||||
| 2026-02-13 | 13F | Vontobel Holding Ltd. | Call | 20.000 | 344 | |||||
| 2026-02-17 | 13F | Kynam Capital Management, LP | Put | 200.000 | 3.436 | |||||
| 2026-02-02 | 13F | Breakwater Investment Management | 17.048 | 0,00 | 293 | 323,19 | ||||
| 2026-01-29 | 13F | UBS Group AG | 2.222.982 | 213,50 | 38.180 | 1.213,35 | ||||
| 2025-11-06 | 13F | CBIZ Investment Advisory Services, LLC | 0 | -100,00 | 0 | |||||
| 2026-02-17 | 13F | Atom Investors LP | 0 | -100,00 | 0 | -100,00 | ||||
| 2025-11-06 | 13F | Ameritas Advisory Services, LLC | 0 | -100,00 | 0 | |||||
| 2026-03-03 | 13F/A | Caitong International Asset Management Co., Ltd | 9.276 | 159 | ||||||
| 2026-01-21 | 13F | Sowell Financial Services LLC | 10.650 | 1,91 | 183 | 333,33 | ||||
| 2026-01-29 | 13F | China Universal Asset Management Co., Ltd. | 16.553 | -24,52 | 284 | 219,10 | ||||
| 2025-11-13 | 13F | Hsbc Holdings Plc | 0 | -100,00 | 0 | -100,00 | ||||
| 2026-02-06 | 13F | Profund Advisors Llc | 14.330 | 246 | ||||||
| 2026-02-13 | 13F | Walleye Capital LLC | 109.956 | 636,82 | 1.888 | 2.995,08 | ||||
| 2026-02-09 | 13F | Harbour Investments, Inc. | 21.835 | 62,11 | 375 | 581,82 | ||||
| 2026-02-10 | 13F | Quantbot Technologies LP | 7.220 | 124 | ||||||
| 2026-02-13 | 13F | Walleye Capital LLC | Call | 20.500 | 10,22 | 352 | 363,16 | |||
| 2026-02-17 | 13F | Aqr Capital Management Llc | 22.838 | 7,19 | 392 | 350,57 | ||||
| 2026-02-13 | 13F | Walleye Capital LLC | Put | 35.000 | 601 | |||||
| 2026-02-17 | 13F | D. E. Shaw & Co., Inc. | 754.999 | -24,89 | 12.967 | 214,66 | ||||
| 2026-02-17 | 13F | Kotler Kevin | Call | 218.700 | 3.794 | |||||
| 2026-02-12 | 13F | MetLife Investment Management, LLC | 36.200 | 76,55 | 622 | 639,29 | ||||
| 2026-02-13 | 13F | Morgan Stanley | 386.152 | -80,59 | 6.632 | -18,70 | ||||
| 2026-01-27 | 13F | Stordahl Capital Management, Inc. | 22.860 | 0,00 | 393 | 321,51 | ||||
| 2026-02-11 | 13F | Cerity Partners LLC | 30.450 | 6,10 | 523 | 346,15 | ||||
| 2026-02-06 | 13F | HighTower Advisors, LLC | 104.059 | 9,32 | 1.787 | 358,21 | ||||
| 2026-02-17 | 13F | Millennium Management Llc | 441.811 | 9,95 | 7.588 | 360,72 | ||||
| 2026-02-13 | 13F | Sei Investments Co | 31.766 | 142,23 | 546 | 928,30 | ||||
| 2026-02-17 | 13F | Kotler Kevin | 905.635 | 15.554 | ||||||
| 2026-02-17 | 13F | Man Group plc | 27.099 | 465 | 159,78 | |||||
| 2026-02-11 | 13F | Simplex Trading, Llc | Put | 119.700 | 35,25 | 2.056 | ||||
| 2026-02-05 | 13F | Allworth Financial LP | 44 | -22,81 | 1 | |||||
| 2026-02-12 | 13F | Jane Street Group, Llc | Put | 171.100 | 352,65 | 2.939 | 1.807,79 | |||
| 2026-02-05 | 13F | Avantax Planning Partners, Inc. | 13.200 | 30,69 | 227 | 451,22 | ||||
| 2026-02-17 | 13F | Abel Hall, LLC | 10.240 | 176 | ||||||
| 2026-02-17 | 13F | Advisor Group Holdings, Inc. | 7.547 | 34,55 | 130 | 460,87 | ||||
| 2026-01-29 | 13F | Comerica Bank | 38.000 | 8,57 | 653 | 355,94 | ||||
| 2026-02-11 | 13F | Simplex Trading, Llc | 123.979 | 457,96 | 2.129 | |||||
| 2026-02-12 | 13F | Jane Street Group, Llc | 463.622 | 64,94 | 7.963 | 591,15 | ||||
| 2026-02-11 | 13F | Cypress Capital Group | 42.000 | 0,00 | 721 | 319,19 | ||||
| 2026-02-11 | 13F | Simplex Trading, Llc | Call | 129.500 | 43,09 | 2.224 | ||||
| 2026-02-12 | 13F | Jane Street Group, Llc | Call | 109.500 | 665,73 | 1.881 | 3.141,38 | |||
| 2026-02-17 | 13F | ADAR1 Capital Management, LLC | Put | 75.000 | 1.288 | |||||
| 2026-02-17 | 13F | ADAR1 Capital Management, LLC | 25.000 | 429 | ||||||
| 2026-02-17 | 13F | Nomura Holdings Inc | 655.021 | 1.399,56 | 11.250 | 6.184,36 | ||||
| 2026-02-17 | 13F | Nomura Holdings Inc | Call | 126.400 | 2.171 | |||||
| 2026-02-17 | 13F | Nomura Holdings Inc | Put | 30.000 | 515 | |||||
| 2026-02-11 | 13F | Group One Trading, L.p. | Put | 178.600 | 151,20 | 3.067 | 953,95 | |||
| 2025-09-26 | NP | UAPIX - Ultrasmall-cap Profund Investor Class | 625 | 9,46 | 2 | -50,00 | ||||
| 2025-09-29 | NP | PRFZ - Invesco FTSE RAFI US 1500 Small-Mid ETF This fund is a listed as child fund of Invesco Ltd. and if that institution has disclosed ownership in this security, then these positions will not be double counted when calculating total shares and total value | 42.954 | 94,04 | 166 | 2,47 | ||||
| 2025-09-29 | NP | RSSL - Global X Russell 2000 ETF | 29.494 | -12,07 | 114 | -53,66 | ||||
| 2026-02-06 | 13F | Gsa Capital Partners Llp | 0 | -100,00 | 0 | |||||
| 2026-02-13 | 13F | Ingalls & Snyder Llc | 3.448.699 | -16,02 | 59 | 268,75 | ||||
| 2026-02-05 | 13F | AlphaCore Capital LLC | 17.647 | 303 | ||||||
| 2026-02-11 | 13F | Group One Trading, L.p. | Call | 277.300 | 13,79 | 4.763 | 376,68 | |||
| 2026-02-11 | 13F | Deutsche Bank Ag\ | 48.694 | 19,34 | 837 | 400,60 | ||||
| 2026-01-07 | 13F | Massmutual Trust Co Fsb/adv | 360 | 190,32 | 6 | |||||
| 2026-02-11 | 13F | Group One Trading, L.p. | 133.269 | 35,58 | 2.289 | 467,74 | ||||
| 2026-02-13 | 13F | Affinity Asset Advisors, LLC | Put | 0 | -100,00 | 0 | -100,00 | |||
| 2026-02-17 | 13F | Virtus Investment Advisers, Inc. | 26.212 | 450 | ||||||
| 2026-02-12 | 13F | Federation des caisses Desjardins du Quebec | 300 | 0,00 | 5 | 400,00 | ||||
| 2025-09-26 | NP | FXSCX - Fidelity Flex Small Cap Focused Index Fund | 415 | 2 | ||||||
| 2026-01-27 | 13F | Gf Fund Management Co. Ltd. | 1.392 | -4,92 | 24 | 283,33 | ||||
| 2026-02-13 | 13F | Citigroup Inc | 27.489 | 398,26 | 472 | 2.045,45 | ||||
| 2025-11-14 | 13F | Wolverine Trading, Llc | 25.971 | 48,52 | 109 | 96,36 | ||||
| 2025-11-14 | 13F | Wolverine Trading, Llc | Call | 97.000 | 370,87 | 405 | 523,08 | |||
| 2025-11-14 | 13F | Wolverine Trading, Llc | Put | 70.800 | 187,80 | 296 | 278,21 | |||
| 2026-02-17 | 13F | Citadel Advisors Llc | Call | 394.600 | 378,88 | 6.777 | 1.910,98 | |||
| 2025-11-13 | 13F | Marshall Wace, Llp | 464.178 | -37,39 | 1.903 | -14,43 | ||||
| 2026-02-17 | 13F | Citadel Advisors Llc | Put | 408.400 | 25,97 | 7.014 | 427,77 | |||
| 2026-02-17 | 13F | Citadel Advisors Llc | 240.352 | -38,88 | 4.128 | 156,08 | ||||
| 2026-02-06 | 13F | Pnc Financial Services Group, Inc. | 377 | -44,07 | 6 | 200,00 | ||||
| 2026-02-13 | 13F | Verition Fund Management LLC | 63.493 | 1.090 | ||||||
| 2026-02-13 | 13F | Parkside Financial Bank & Trust | 40 | 1 | ||||||
| 2025-09-26 | NP | FZIPX - Fidelity ZERO Extended Market Index Fund This fund is a listed as child fund of Fmr Llc and if that institution has disclosed ownership in this security, then these positions will not be double counted when calculating total shares and total value | 16.884 | 0,00 | 65 | -47,58 | ||||
| 2026-02-17 | 13F | National Asset Management, Inc. | 11.369 | 5,66 | 195 | 343,18 | ||||
| 2025-09-24 | NP | PJARX - SmallCap Value Fund II R-3 | 436 | -84,72 | 2 | -95,00 | ||||
| 2026-01-05 | 13F | GAMMA Investing LLC | 107 | 2 | ||||||
| 2026-02-10 | 13F | Daiwa Securities Group Inc. | 191 | 0,00 | 0 | |||||
| 2026-02-12 | 13F | BlackRock, Inc. | 5.062.438 | 13,71 | 86.947 | 376,34 | ||||
| 2026-02-10 | 13F | Bnp Paribas Arbitrage, Sa | 16.351 | -81,44 | 281 | -22,44 | ||||
| 2026-02-13 | 13F | Itau Unibanco Holding S.A. | 180.000 | 3.053 | ||||||
| 2026-02-17 | 13F | Tower Research Capital LLC (TRC) | 1.916 | -44,11 | 33 | 128,57 | ||||
| 2026-02-19 | 13F | CI Private Wealth, LLC | 687.325 | 12,91 | 11.805 | 373,11 | ||||
| 2026-02-13 | 13F | Police & Firemen's Retirement System of New Jersey | 16.360 | 0,00 | 281 | 317,91 | ||||
| 2026-02-17 | 13F | Quadrature Capital Ltd | 0 | -100,00 | 0 | -100,00 | ||||
| 2026-02-17 | 13F | Wellington Management Group Llp | 202.617 | 4,20 | 3.480 | 336,51 | ||||
| 2026-02-17 | 13F | Russell Investments Group, Ltd. | 14.014 | 31,03 | 241 | 458,14 | ||||
| 2026-01-26 | 13F | Cwm, Llc | 1.232 | -2,22 | 0 | |||||
| 2025-09-24 | NP | PPNMX - SmallCap Growth Fund I R-3 | 2.678 | 39,84 | 10 | -28,57 | ||||
| 2026-02-17 | 13F | Schonfeld Strategic Advisors LLC | 12.667 | 218 | ||||||
| 2026-02-12 | 13F | Bank Of Montreal /can/ | Call | 600.000 | 10.305 | |||||
| 2026-01-29 | 13F | Vanguard Group Inc | 4.013.315 | 19,91 | 68.929 | 402,32 | ||||
| 2026-02-12 | 13F | Bank Of Montreal /can/ | Put | 320.400 | 5.503 | |||||
| 2026-02-13 | 13F | Rafferty Asset Management, LLC | 12.226 | 210 | ||||||
| 2025-09-29 | NP | PKW - Invesco BuyBack Achievers ETF This fund is a listed as child fund of Invesco Ltd. and if that institution has disclosed ownership in this security, then these positions will not be double counted when calculating total shares and total value | 42.588 | 40,64 | 165 | -26,13 | ||||
| 2026-02-10 | 13F | Goldman Sachs Group Inc | 227.294 | -32,37 | 3.904 | 183,44 | ||||
| 2026-02-17 | 13F | Quantinno Capital Management LP | 25.074 | 37,71 | 431 | 481,08 | ||||
| 2026-02-17 | 13F | Price T Rowe Associates Inc /md/ | 95.745 | 6,94 | 2 | |||||
| 2025-11-14 | 13F | XTX Topco Ltd | 0 | -100,00 | 0 | -100,00 | ||||
| 2026-02-11 | 13F | Capital Analysts, Inc. | 1.000 | 0,00 | 0 | |||||
| 2025-09-24 | NP | SWSSX - Schwab Small-Cap Index Fund This fund is a listed as child fund of Charles Schwab Investment Management Inc and if that institution has disclosed ownership in this security, then these positions will not be double counted when calculating total shares and total value | 147.664 | 6,52 | 571 | -43,91 | ||||
| 2026-02-13 | 13F | DeepCurrents Investment Group LLC | 0 | -100,00 | 0 | -100,00 | ||||
| 2026-02-12 | 13F | Mindset Wealth Management, Llc | 52.000 | -13,33 | 893 | 263,01 |