Grundlæggende statistik
| Institutionelle ejere | 58 total, 58 long only, 0 short only, 0 long/short - change of 31,11% MRQ |
| Gennemsnitlig porteføljeallokering | 0.2328 % - change of -9,04% MRQ |
| Institutionelle aktier (lange) | 4.120.136 (ex 13D/G) - change of 0,27MM shares 6,93% MRQ |
| Institutionel værdi (lang) | $ 75.326 USD ($1000) |
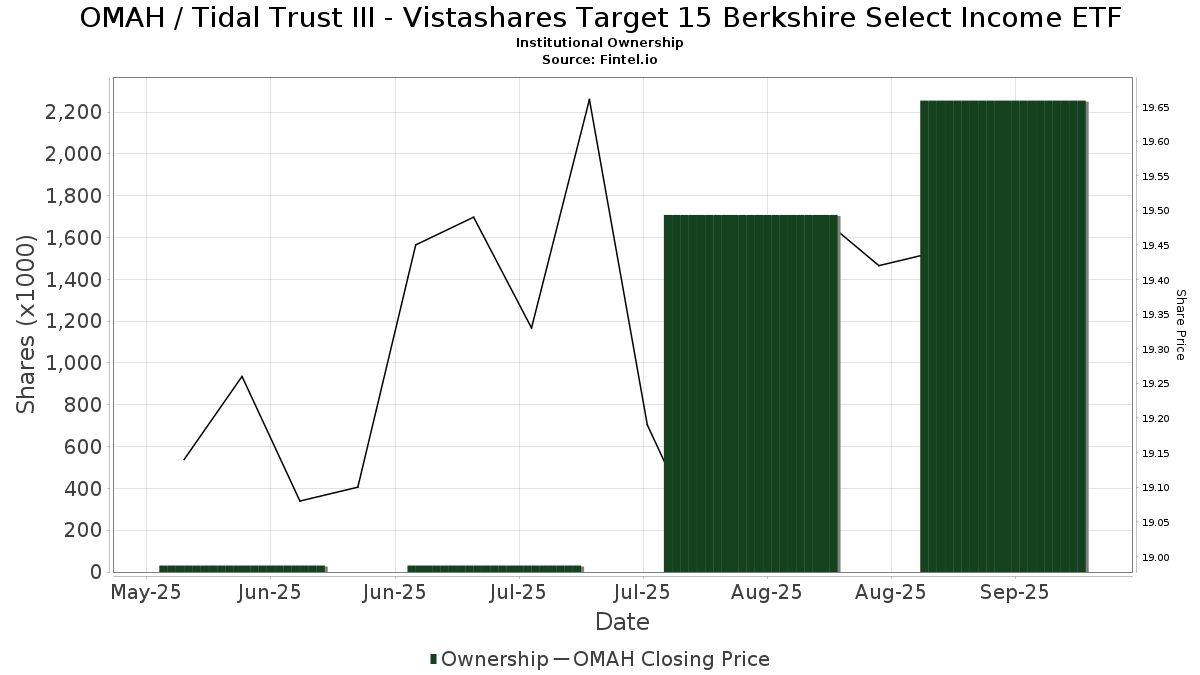
Institutionelt ejerskab og aktionærer
Tidal Trust III - Vistashares Target 15 Berkshire Select Income ETF (US:OMAH) har 58 institutionelle ejere og aktionærer, der har indsendt 13D/G- eller 13F-formularer til Securities Exchange Commission (SEC). Disse institutioner har i alt 4,120,136 aktier. Største aktionærer omfatter Merit Financial Group, LLC, Second Half Financial Partners, LLC, Beaumont Financial Advisors, LLC, Redhawk Wealth Advisors, Inc., Stifel Financial Corp, Sherry Group, Inc., Cambridge Investment Research Advisors, Inc., Susquehanna International Group, Llp, Formidable Asset Management, LLC, and Kestra Advisory Services, LLC .
Tidal Trust III - Vistashares Target 15 Berkshire Select Income ETF (ARCA:OMAH) institutionel ejerskabsstruktur viser aktuelle positioner i virksomheden efter institutioner og fonde, samt seneste ændringer i positionsstørrelse. Større aktionærer kan omfatte individuelle investorer, investeringsforeninger, hedgefonde eller institutioner. Skema 13D angiver, at investoren besidder (eller besidder) mere end 5 % af virksomheden og har til hensigt (eller har til hensigt at) aktivt at forfølge en ændring i forretningsstrategi. Skema 13G indikerer en passiv investering på over 5%.
The share price as of March 4, 2026 is 18,26 / share. Previously, on March 5, 2025, the share price was 19,89 / share. This represents a decline of 8,21% over that period.
Fondens stemningsscore
Fund Sentiment Score (fka Ownership Accumulation Score) finder de aktier, der bliver mest købt af fonde. Det er resultatet af en sofistikeret, multi-faktor kvantitativ model, der identificerer virksomheder med de højeste niveauer af institutionel akkumulering. Scoringsmodellen bruger en kombination af den samlede stigning i oplyste ejere, ændringerne i porteføljeallokeringer i disse ejere og andre målinger. Tallet går fra 0 til 100, hvor højere tal indikerer et højere niveau af akkumulering for sine jævnaldrende, og 50 er gennemsnittet.
Opdateringsfrekvens: Dagligt
Se Ownership Explorer, som giver en liste over højest rangerende virksomheder.
AI+ Ask Fintel’s AI assistant about Tidal Trust III - Vistashares Target 15 Berkshire Select Income ETF.
Select a question to share a public post with an AI-crafted answer.
Thinking of good questions…
Institutionel Put/Call-forhold
Ud over at indberette standardaktie- og gældsudstedelser skal institutter med mere end 100 mill. aktiver under forvaltning også oplyse deres put- og call-optionsbeholdninger. Da salgsoptioner generelt indikerer negativ stemning, og købsoptioner indikerer positiv stemning, kan vi få en fornemmelse af den overordnede institutionelle stemning ved at plotte forholdet mellem put og kald. Diagrammet til højre viser det historiske put/call-forhold for dette instrument.
Brug af Put/Call Ratio som en indikator for investorernes stemning overvinder en af de vigtigste mangler ved at bruge totalt institutionelt ejerskab, som er, at en betydelig mængde af aktiver under forvaltning investeres passivt for at spore indekser. Passivt forvaltede fonde køber typisk ikke optioner, så indikatoren for put/call-forholdet følger mere nøje følelsen af aktivt forvaltede fonde.
13F og NPORT arkivering
Detaljer om 13F-arkivering er gratis. Detaljer om NP-ansøgninger kræver et premium-medlemskab. Grønne rækker angiver nye positioner. Røde rækker angiver lukkede positioner. Klik på linket ikon for at se den fulde transaktionshistorik.
Opgrader
for at låse premium-data op og eksportere til Excel ![]() .
.
| Fil dato | Kilde | Investor | Type | Gennemsnitlig pris (Øst) |
Aktier | Δ Aktier (%) |
Rapporteret Værdi ($1000) |
Δ Værdi (%) |
Port Alloc (%) |
|
|---|---|---|---|---|---|---|---|---|---|---|
| 2026-01-16 | 13F | Balboa Wealth Partners | 51.970 | -29,66 | 974 | -31,58 | ||||
| 2026-02-10 | 13F | Private Wealth Asset Management, LLC | 374 | 0,00 | 7 | 0,00 | ||||
| 2026-01-16 | 13F | Beaumont Financial Advisors, LLC | 820.995 | 6,16 | 15.385 | 3,30 | ||||
| 2026-02-12 | 13F | Jane Street Group, Llc | 0 | -100,00 | 0 | -100,00 | ||||
| 2026-01-16 | 13F | Formidable Asset Management, LLC | 74.204 | 1.429 | ||||||
| 2026-01-26 | 13F | PFG Investments, LLC | 27.572 | 517 | ||||||
| 2026-01-29 | 13F | D.a. Davidson & Co. | 45.242 | 142,62 | 848 | 135,93 | ||||
| 2026-02-10 | 13F | Hazlett, Burt & Watson, Inc. | 0 | -100,00 | 0 | |||||
| 2026-02-11 | 13F | Simplex Trading, Llc | 1.073 | 20 | ||||||
| 2026-02-17 | 13F | Camarda Financial Advisors, LLC | 0 | -100,00 | 0 | |||||
| 2026-02-12 | 13F | Hollencrest Capital Management | 1.350 | 25 | ||||||
| 2026-01-30 | 13F | Delta Investment Management, LLC | 38.274 | 717 | ||||||
| 2026-02-13 | 13F | Stifel Financial Corp | 195.495 | 3.664 | ||||||
| 2026-01-09 | 13F | Capital CS Group, LLC | 12.000 | 225 | ||||||
| 2026-02-10 | 13F/A | Northwestern Mutual Wealth Management Co | 97 | 2 | ||||||
| 2026-02-05 | 13F | Sherry Group, Inc. | 99.420 | 1.872 | ||||||
| 2026-02-13 | 13F | Kestra Advisory Services, LLC | 57.896 | 1.085 | ||||||
| 2026-02-05 | 13F | Allworth Financial LP | 700 | 16,67 | 13 | 18,18 | ||||
| 2025-11-14 | 13F | Tower Research Capital LLC (TRC) | 0 | -100,00 | 0 | |||||
| 2026-02-06 | 13F | Pnc Financial Services Group, Inc. | 0 | -100,00 | 0 | |||||
| 2026-02-09 | 13F | Integrity Alliance, Llc. | 15.455 | 0,98 | 290 | -1,70 | ||||
| 2026-02-03 | 13F | International Assets Investment Management, Llc | 3.264 | 61 | ||||||
| 2026-01-30 | 13F | Activest Wealth Management | 1 | 0,00 | 0 | |||||
| 2026-02-12 | 13F | Jane Street Group, Llc | Call | 13.300 | 249 | |||||
| 2026-02-13 | 13F | TCM Advisors, LLC | 713 | 14,47 | ||||||
| 2025-11-14 | 13F | Mariner, LLC | 0 | -100,00 | 0 | |||||
| 2026-01-21 | 13F | Rocky Mountain Advisers, Llc | 5.471 | 3,81 | 103 | 0,99 | ||||
| 2026-02-17 | 13F | Susquehanna International Group, Llp | 80.547 | 1.509 | ||||||
| 2026-01-14 | 13F | Redhawk Wealth Advisors, Inc. | 289.236 | -37,60 | 5.420 | -39,29 | ||||
| 2026-02-13 | 13F | Wells Fargo & Company/mn | 1 | 0,00 | 0 | |||||
| 2026-01-27 | 13F | Atlantic Edge Private Wealth Management, LLC | 1.300 | 0,00 | 24 | -4,00 | ||||
| 2026-02-12 | 13F | Mark Sheptoff Financial Planning, Llc | 304 | 1,33 | 6 | 0,00 | ||||
| 2026-01-29 | 13F | Kestra Private Wealth Services, Llc | 17.619 | -1,76 | 330 | -4,35 | ||||
| 2026-01-26 | 13F | Second Half Financial Partners, LLC | 865.716 | 0,00 | 16.224 | -2,70 | ||||
| 2026-02-06 | 13F | Rps Advisory Solutions Llc | 49.944 | 4,22 | 936 | 1,30 | ||||
| 2026-02-12 | 13F | Commonwealth Equity Services, Llc | 12.928 | 242 | ||||||
| 2026-02-12 | 13F | Marex Group plc | 11.000 | 206 | ||||||
| 2026-01-05 | 13F | Noble Wealth Management PBC | 1.150 | 0,00 | 22 | -4,55 | ||||
| 2026-02-06 | 13F | IFP Advisors, Inc | 450 | 0,00 | 8 | 0,00 | ||||
| 2026-02-12 | 13F | Steward Partners Investment Advisory, Llc | 8.575 | 161 | ||||||
| 2026-02-09 | 13F | Harbour Investments, Inc. | 3.693 | 309,88 | 69 | 305,88 | ||||
| 2026-02-17 | 13F | Old Mission Capital Llc | 0 | -100,00 | 0 | |||||
| 2025-11-05 | 13F | Aft, Forsyth & Sober, LLC | 0 | -100,00 | 0 | |||||
| 2026-01-27 | 13F | GHP Investment Advisors, Inc. | 53 | 0,00 | 1 | -100,00 | ||||
| 2026-02-13 | 13F | Visionary Wealth Advisors | 14.507 | 26,46 | 272 | 23,18 | ||||
| 2026-02-13 | 13F | Integrated Wealth Concepts LLC | 26.852 | -7,21 | 503 | -9,69 | ||||
| 2026-02-17 | 13F | Captrust Financial Advisors | 44.690 | 1,21 | 837 | -1,53 | ||||
| 2026-01-14 | 13F | Elevatus Welath Management | 32.546 | 52,47 | 610 | 48,18 | ||||
| 2026-02-13 | 13F | Pin Oak Investment Advisors Inc | 0 | -100,00 | 0 | |||||
| 2026-02-17 | 13F | Advisor Group Holdings, Inc. | 1.968 | 11,75 | 37 | 9,09 | ||||
| 2026-02-17 | 13F | Snowden Capital Advisors LLC | 20.980 | -5,94 | 393 | -8,39 | ||||
| 2026-02-13 | 13F | Morgan Stanley | 301 | 14.950,00 | 6 | |||||
| 2026-01-23 | 13F | First PREMIER Bank | 3.000 | 0,00 | 0 | |||||
| 2025-10-21 | 13F | Tradewinds Capital Management, LLC | 0 | -100,00 | 0 | |||||
| 2025-11-14 | 13F | Goldman Sachs Group Inc | 0 | -100,00 | 0 | |||||
| 2026-01-23 | 13F | Farther Finance Advisors, LLC | 11.374 | 213 | ||||||
| 2026-01-29 | 13F | UBS Group AG | 181 | 3 | ||||||
| 2026-02-11 | 13F | Parallel Advisors, LLC | 2.338 | -38,38 | 44 | -41,10 | ||||
| 2026-01-20 | 13F | Westwood Wealth Management | 16.292 | 305 | ||||||
| 2026-02-17 | 13F | Gladstone Institutional Advisory LLC | 0 | -100,00 | 0 | |||||
| 2026-01-27 | 13F | TD Waterhouse Canada Inc. | 630 | 2,94 | 12 | 0,00 | ||||
| 2026-01-13 | 13F | Lionshead Wealth Management, LLC | 16.292 | -15,15 | 305 | -17,34 | ||||
| 2026-01-30 | 13F | Us Bancorp \de\ | 2.000 | -66,39 | 37 | -67,54 | ||||
| 2026-02-17 | 13F | Creative Planning | 22.528 | 422 | ||||||
| 2026-01-26 | 13F | Cwm, Llc | 5.213 | 62,60 | 0 | |||||
| 2026-02-11 | 13F | IMA Wealth, Inc. | 30 | 1 | ||||||
| 2025-11-12 | 13F | Journey Strategic Wealth Llc | 0 | -100,00 | 0 | |||||
| 2026-01-21 | 13F | Naviter Wealth, LLC | 18.130 | 10,38 | 340 | 7,28 | ||||
| 2026-02-05 | 13F | Cambridge Investment Research Advisors, Inc. | 93.587 | 256,90 | 2 | |||||
| 2026-02-18 | 13F | GWM Advisors LLC | 26.784 | 3,40 | 502 | 0,60 | ||||
| 2026-01-26 | 13F | Merit Financial Group, LLC | 934.855 | 3,03 | 17.519 | 0,25 | ||||
| 2026-02-18 | 13F | Onyx Bridge Wealth Group LLC | 31.689 | 9,59 | 594 | 6,65 | ||||
| 2026-02-13 | 13F | Beacon Financial Advisory LLC | 0 | -100,00 | 0 |