Grundlæggende statistik
| Institutionelle ejere | 121 total, 120 long only, 1 short only, 0 long/short - change of 0,00% MRQ |
| Gennemsnitlig porteføljeallokering | 0.0033 % - change of -31,43% MRQ |
| Institutionelle aktier (lange) | 793.829 (ex 13D/G) - change of 0,13MM shares 19,71% MRQ |
| Institutionel værdi (lang) | $ 13.812 USD ($1000) |
Institutionelt ejerskab og aktionærer
Amplify ETF Trust - Amplify Alternative Harvest ETF (US:MJ) har 121 institutionelle ejere og aktionærer, der har indsendt 13D/G- eller 13F-formularer til Securities Exchange Commission (SEC). Disse institutioner har i alt 793,829 aktier. Største aktionærer omfatter Old Mission Capital Llc, Jane Street Group, Llc, Jaffetilchin Investment Partners, LLC, Quinn Opportunity Partners LLC, Susquehanna International Group, Llp, Millennium Management Llc, LPL Financial LLC, Advisor Group Holdings, Inc., Citadel Advisors Llc, and Commonwealth Equity Services, Llc .
Amplify ETF Trust - Amplify Alternative Harvest ETF (ARCA:MJ) institutionel ejerskabsstruktur viser aktuelle positioner i virksomheden efter institutioner og fonde, samt seneste ændringer i positionsstørrelse. Større aktionærer kan omfatte individuelle investorer, investeringsforeninger, hedgefonde eller institutioner. Skema 13D angiver, at investoren besidder (eller besidder) mere end 5 % af virksomheden og har til hensigt (eller har til hensigt at) aktivt at forfølge en ændring i forretningsstrategi. Skema 13G indikerer en passiv investering på over 5%.
The share price as of September 15, 2025 is 31,20 / share. Previously, on September 16, 2024, the share price was 40,56 / share. This represents a decline of 23,08% over that period.

Fondens stemningsscore
Fund Sentiment Score (fka Ownership Accumulation Score) finder de aktier, der bliver mest købt af fonde. Det er resultatet af en sofistikeret, multi-faktor kvantitativ model, der identificerer virksomheder med de højeste niveauer af institutionel akkumulering. Scoringsmodellen bruger en kombination af den samlede stigning i oplyste ejere, ændringerne i porteføljeallokeringer i disse ejere og andre målinger. Tallet går fra 0 til 100, hvor højere tal indikerer et højere niveau af akkumulering for sine jævnaldrende, og 50 er gennemsnittet.
Opdateringsfrekvens: Dagligt
Se Ownership Explorer, som giver en liste over højest rangerende virksomheder.
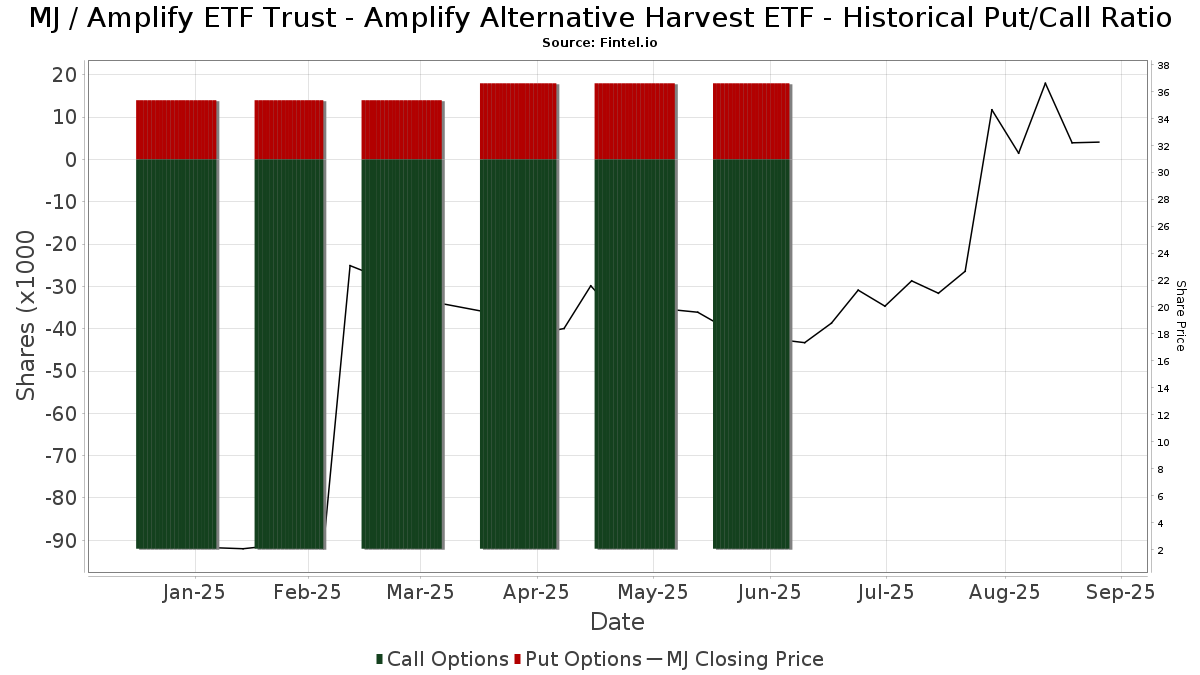
Institutionel Put/Call-forhold
Ud over at indberette standardaktie- og gældsudstedelser skal institutter med mere end 100 mill. aktiver under forvaltning også oplyse deres put- og call-optionsbeholdninger. Da salgsoptioner generelt indikerer negativ stemning, og købsoptioner indikerer positiv stemning, kan vi få en fornemmelse af den overordnede institutionelle stemning ved at plotte forholdet mellem put og kald. Diagrammet til højre viser det historiske put/call-forhold for dette instrument.
Brug af Put/Call Ratio som en indikator for investorernes stemning overvinder en af de vigtigste mangler ved at bruge totalt institutionelt ejerskab, som er, at en betydelig mængde af aktiver under forvaltning investeres passivt for at spore indekser. Passivt forvaltede fonde køber typisk ikke optioner, så indikatoren for put/call-forholdet følger mere nøje følelsen af aktivt forvaltede fonde.
13F og NPORT arkivering
Detaljer om 13F-arkivering er gratis. Detaljer om NP-ansøgninger kræver et premium-medlemskab. Grønne rækker angiver nye positioner. Røde rækker angiver lukkede positioner. Klik på linket ikon for at se den fulde transaktionshistorik.
Opgrader
for at låse premium-data op og eksportere til Excel ![]() .
.
| Fil dato | Kilde | Investor | Type | Gennemsnitlig pris (Øst) |
Aktier | Δ Aktier (%) |
Rapporteret Værdi ($1000) |
Δ Værdi (%) |
Port Alloc (%) |
|
|---|---|---|---|---|---|---|---|---|---|---|
| 2025-05-02 | 13F | Capital A Wealth Management, LLC | 14 | 0 | ||||||
| 2025-08-11 | 13F | HighTower Advisors, LLC | Call | 0 | -100,00 | 0 | ||||
| 2025-07-15 | 13F | North Star Investment Management Corp. | 289 | 0,00 | 5 | 0,00 | ||||
| 2025-05-15 | 13F | Glenmede Trust Co Na | 92 | 2 | ||||||
| 2025-07-11 | 13F | CX Institutional | 0 | -100,00 | 0 | |||||
| 2025-08-06 | 13F | Legacy Wealth Managment, LLC/ID | 23 | 0 | ||||||
| 2025-08-13 | 13F | Northwestern Mutual Wealth Management Co | 232 | 0,00 | 4 | 0,00 | ||||
| 2025-04-28 | 13F | Rossby Financial, LCC | 0 | 0 | ||||||
| 2025-08-04 | 13F | JDM Financial Group LLC | 45 | 0,00 | 1 | |||||
| 2025-08-05 | 13F | Bank Of Montreal /can/ | 120 | -42,03 | 2 | -50,00 | ||||
| 2025-08-07 | 13F | Flagship Wealth Advisors, Llc | 0 | -100,00 | 0 | |||||
| 2025-08-12 | 13F | Jpmorgan Chase & Co | 0 | -100,00 | 0 | |||||
| 2025-08-14 | 13F | Glenmede Investment Management, LP | 133 | 2 | ||||||
| 2025-07-28 | 13F | Harbour Investments, Inc. | 494 | -1,59 | 9 | -11,11 | ||||
| 2025-08-05 | 13F | Integrity Financial Corp /WA | 47 | 0,00 | 1 | |||||
| 2025-07-15 | 13F | Compagnie Lombard Odier SCmA | 0 | -100,00 | 0 | |||||
| 2025-08-08 | 13F | Cetera Investment Advisers | 12.424 | 0,10 | 223 | -7,85 | ||||
| 2025-07-17 | 13F | City Holding Co | 47 | 0,00 | 1 | |||||
| 2025-07-29 | 13F | Tradewinds Capital Management, LLC | 1 | 0,00 | 0 | |||||
| 2025-08-14 | 13F | McIlrath & Eck, LLC | 140 | 0,00 | 3 | 0,00 | ||||
| 2025-07-11 | 13F | Farther Finance Advisors, LLC | 32 | 60,00 | 1 | |||||
| 2025-08-11 | 13F | Hexagon Capital Partners LLC | 0 | -100,00 | 0 | |||||
| 2025-07-16 | 13F | PFS Partners, LLC | 260 | 0,00 | 5 | -20,00 | ||||
| 2025-07-30 | 13F | Fairway Wealth LLC | 26 | 0,00 | 0 | |||||
| 2025-07-01 | 13F | Harbor Investment Advisory, Llc | 40 | 0,00 | 1 | |||||
| 2025-08-07 | 13F | Allworth Financial LP | 363 | 84,26 | 7 | 50,00 | ||||
| 2025-08-19 | 13F | Newbridge Financial Services Group, Inc. | 127 | 0,00 | 2 | 0,00 | ||||
| 2025-08-05 | 13F | GPS Wealth Strategies Group, LLC | 22 | 0,00 | 0 | |||||
| 2025-08-06 | 13F | Commonwealth Equity Services, Llc | 18.271 | -6,44 | 0 | |||||
| 2025-08-12 | 13F | AlphaCore Capital LLC | 66 | 1 | ||||||
| 2025-08-13 | 13F | RIA Advisory Group LLC | 0 | -100,00 | 0 | |||||
| 2025-07-30 | 13F | Financial Perspectives, Inc | 0 | -100,00 | 0 | |||||
| 2025-08-13 | 13F | IAG Wealth Partners, LLC | 38 | 0,00 | 1 | |||||
| 2025-07-25 | 13F | NorthRock Partners, LLC | 141 | 0,00 | 3 | 0,00 | ||||
| 2025-07-14 | 13F | Armstrong Advisory Group, Inc | 192 | 3 | ||||||
| 2025-08-14 | 13F | GWM Advisors LLC | 231 | -50,32 | 4 | -55,56 | ||||
| 2025-08-14 | 13F | UBS Group AG | 18.124 | 37,89 | 326 | 26,95 | ||||
| 2025-08-05 | 13F | Westside Investment Management, Inc. | 8 | 0,00 | 0 | |||||
| 2025-08-13 | 13F | Millstone Evans Group, LLC | 26 | 0,00 | 0 | |||||
| 2025-08-14 | 13F | Comerica Bank | 27 | 0,00 | 0 | |||||
| 2025-08-08 | 13F | Flaharty Asset Management, LLC | 0 | -100,00 | 0 | |||||
| 2025-07-24 | 13F | Us Bancorp \de\ | 5 | -66,67 | 0 | |||||
| 2025-08-08 | 13F | Emerald Investment Partners, Llc | 157 | 0,00 | 3 | -33,33 | ||||
| 2025-07-11 | 13F | Compass Ion Advisors, LLC | 0 | -100,00 | 0 | |||||
| 2025-07-24 | 13F | Stonebridge Financial Group, LLC | 0 | -100,00 | 0 | |||||
| 2025-07-16 | 13F | Signaturefd, Llc | 269 | -1,10 | 5 | -20,00 | ||||
| 2025-07-28 | 13F | Kiker Wealth Management, LLC | 0 | -100,00 | 0 | |||||
| 2025-07-31 | 13F | CNB Bank | 8 | 0 | ||||||
| 2025-07-10 | 13F | Oliver Lagore Vanvalin Investment Group | 375 | 7 | ||||||
| 2025-08-11 | 13F | VSM Wealth Advisory, LLC | 43 | 0,00 | 1 | |||||
| 2025-08-12 | 13F | Wood Tarver Financial Group, LLC | 3 | 0,00 | 0 | |||||
| 2025-08-14 | 13F | Ancora Advisors, LLC | 31 | -85,45 | 1 | -100,00 | ||||
| 2025-07-31 | 13F | Glass Jacobson Investment Advisors llc | 7 | 0 | ||||||
| 2025-08-29 | 13F | Total Investment Management Inc | 64 | 1 | ||||||
| 2025-07-30 | 13F | Whittier Trust Co Of Nevada Inc | 91 | 0,00 | 2 | 0,00 | ||||
| 2025-08-11 | 13F | Delta Asset Management Llc/tn | 8 | 0 | ||||||
| 2025-08-15 | 13F | Morgan Stanley | 5.876 | -3,59 | 106 | -11,02 | ||||
| 2025-08-13 | 13F | Capital Analysts, Inc. | 34 | 0,00 | 0 | |||||
| 2025-04-25 | 13F | Smallwood Wealth Investment Management, LLC | 17 | 0 | ||||||
| 2025-08-14 | 13F | Raymond James Financial Inc | 3.252 | 58 | ||||||
| 2025-08-11 | 13F | Tidemark, LLC | 242 | 49,38 | 4 | 33,33 | ||||
| 2025-08-14 | 13F | Riggs Asset Managment Co. Inc. | 7 | 0,00 | 0 | |||||
| 2025-07-14 | 13F | Toth Financial Advisory Corp | 2 | 0,00 | 0 | |||||
| 2025-07-30 | 13F | Gables Capital Management Inc. | 108 | 0,00 | 2 | -50,00 | ||||
| 2025-08-06 | 13F | Legacy Investment Solutions, LLC | 23 | 0 | ||||||
| 2025-08-06 | 13F | Aspect Partners, LLC | 100 | 0,00 | 2 | 0,00 | ||||
| 2025-07-24 | 13F | Horizon Bancorp Inc /in/ | 0 | -100,00 | 0 | |||||
| 2025-08-12 | 13F | PSI Advisors, LLC | 0 | -100,00 | 0 | |||||
| 2025-07-18 | 13F | Bartlett & Co. Wealth Management Llc | 113 | 0,00 | 2 | 0,00 | ||||
| 2025-07-07 | 13F | Thurston, Springer, Miller, Herd & Titak, Inc. | 19 | 111,11 | 0 | |||||
| 2025-08-14 | 13F | Banque Transatlantique SA | 0 | -100,00 | 0 | |||||
| 2025-08-19 | 13F | Asset Dedication, LLC | 3 | 0,00 | 0 | |||||
| 2025-07-24 | 13F | Capital Advisors, Ltd. LLC | 12 | 0,00 | 0 | |||||
| 2025-08-01 | 13F | Bessemer Group Inc | 24 | 0 | ||||||
| 2025-08-08 | 13F | New England Capital Financial Advisors LLC | 10 | 0,00 | 0 | |||||
| 2025-09-04 | 13F/A | Advisor Group Holdings, Inc. | 20.577 | -5,73 | 369 | -13,18 | ||||
| 2025-08-06 | 13F | Equitec Proprietary Markets, Llc | 83 | 0,00 | 1 | 0,00 | ||||
| 2025-08-08 | 13F | Quinn Opportunity Partners LLC | 109.068 | 0,00 | 1.959 | -7,90 | ||||
| 2025-07-17 | 13F | Peoples Financial Services Corp. | 8 | 0,00 | 0 | |||||
| 2025-08-06 | 13F | Golden State Wealth Management, LLC | 70 | -5,41 | 1 | 0,00 | ||||
| 2025-08-12 | 13F | SRS Capital Advisors, Inc. | 6 | 0,00 | 0 | |||||
| 2025-07-15 | 13F | Main Street Group, LTD | 85 | 0,00 | 2 | 0,00 | ||||
| 2025-08-14 | 13F | Old Mission Capital Llc | 233.414 | 466,44 | 4.192 | 422,04 | ||||
| 2025-08-13 | 13F | Kilter Group LLC | 236 | 4 | ||||||
| 2025-08-15 | 13F | WealthCollab, LLC | 166 | 0,00 | 3 | -33,33 | ||||
| 2025-08-14 | 13F | Mpwm Advisory Solutions, Llc | 41 | 0,00 | 1 | |||||
| 2025-08-14 | 13F | Susquehanna International Group, Llp | Call | 79.300 | 65,21 | 1.424 | 52,14 | |||
| 2025-08-12 | 13F | Jaffetilchin Investment Partners, LLC | 110.175 | -12,40 | 1.979 | -19,33 | ||||
| 2025-07-08 | 13F | Zrc Wealth Management, Llc | 39 | 0,00 | 1 | |||||
| 2025-08-01 | 13F | Belvedere Trading LLC | Call | 12.800 | 1,59 | 24 | 9,09 | |||
| 2025-08-08 | 13F | Pinney & Scofield, Inc. | 34 | 0,00 | 1 | |||||
| 2025-08-12 | 13F | Founders Financial Alliance, LLC | 235 | 0,00 | 4 | 0,00 | ||||
| 2025-07-24 | 13F | IFP Advisors, Inc | 72 | 800,00 | 1 | |||||
| 2025-08-14 | 13F | Millennium Management Llc | 55.272 | 104,92 | 993 | 88,95 | ||||
| 2025-08-05 | 13F | Key FInancial Inc | 63 | 1 | ||||||
| 2025-08-12 | 13F | Global Retirement Partners, LLC | 1.570 | 28 | ||||||
| 2025-08-08 | 13F | Capital Investment Advisory Services, LLC | 165 | 0,00 | 3 | -33,33 | ||||
| 2025-08-04 | 13F | Creekmur Asset Management LLC | 2 | 0,00 | 0 | |||||
| 2025-08-11 | 13F | Rothschild Investment Llc | 71 | 0,00 | 1 | 0,00 | ||||
| 2025-07-18 | 13F | SOA Wealth Advisors, LLC. | 20 | 0,00 | 0 | |||||
| 2025-07-29 | 13F | Activest Wealth Management | 27 | 0,00 | 0 | |||||
| 2025-08-12 | 13F | MAI Capital Management | 122 | 0,00 | 2 | 0,00 | ||||
| 2025-08-14 | 13F | CoreCap Advisors, LLC | 16 | 0,00 | 0 | |||||
| 2025-08-11 | 13F | TD Waterhouse Canada Inc. | 16 | 0,00 | 0 | |||||
| 2025-08-08 | 13F | TD Capital Management LLC | 4 | 0,00 | 0 | |||||
| 2025-08-08 | 13F | Hartland & Co., LLC | 30 | 0,00 | 1 | |||||
| 2025-08-14 | 13F | Murphy & Mullick Capital Management Corp | 83 | 0,00 | 1 | 0,00 | ||||
| 2025-08-11 | 13F | HighTower Advisors, LLC | 0 | -100,00 | 0 | |||||
| 2025-07-21 | 13F | Future Financial Wealth Managment LLC | 12 | 0,00 | 0 | |||||
| 2025-07-31 | 13F | Optimum Investment Advisors | 107 | 0,00 | 2 | -50,00 | ||||
| 2025-08-12 | 13F | Proequities, Inc. | 0 | 0 | ||||||
| 2025-08-14 | 13F | Citadel Advisors Llc | Call | 0 | -100,00 | 0 | -100,00 | |||
| 2025-08-14 | 13F | Bank Of America Corp /de/ | 630 | 0,16 | 11 | -8,33 | ||||
| 2025-07-30 | 13F | Atlantic Edge Private Wealth Management, LLC | 37 | 0,00 | 1 | |||||
| 2025-07-29 | 13F | Harbor Asset Planning, Inc. | 35 | 1 | ||||||
| 2025-08-11 | 13F | Aptus Capital Advisors, LLC | 2 | 0,00 | 0 | |||||
| 2025-08-14 | 13F | Citadel Advisors Llc | 0 | -100,00 | 0 | -100,00 | ||||
| 2025-08-14 | 13F | Jane Street Group, Llc | 144.129 | -21,08 | 2.589 | -27,32 | ||||
| 2025-07-09 | 13F | Bulwark Capital Corp | 35 | 1 | ||||||
| 2025-07-16 | 13F | Brown, Lisle/cummings, Inc. | 108 | 0,00 | 2 | -50,00 | ||||
| 2025-08-08 | 13F | Larson Financial Group LLC | 0 | -100,00 | 0 | |||||
| 2025-07-17 | 13F | Beacon Capital Management, LLC | 16 | 0,00 | 0 | |||||
| 2025-07-08 | 13F | Nbc Securities, Inc. | 181 | 0,00 | 0 | |||||
| 2025-07-25 | 13F | Hazlett, Burt & Watson, Inc. | 250 | 0,00 | 0 | |||||
| 2025-08-19 | 13F | Cape Investment Advisory, Inc. | 41 | -6,82 | 1 | |||||
| 2025-08-14 | 13F | Royal Bank Of Canada | 7.939 | 3,29 | 142 | -5,33 | ||||
| 2025-08-11 | 13F | Blue Bell Private Wealth Management, Llc | 79 | -91,41 | 1 | -94,12 | ||||
| 2025-08-14 | 13F | Federation des caisses Desjardins du Quebec | 9 | 0,00 | 0 | |||||
| 2025-08-12 | 13F | LPL Financial LLC | 39.160 | -2,85 | 703 | -10,56 | ||||
| 2025-08-13 | 13F | Mount Yale Investment Advisors, LLC | 48 | 1 | ||||||
| 2025-07-14 | 13F | Painted Porch Advisors LLC | 0 | -100,00 | 0 | |||||
| 2025-07-30 | 13F | LGT Financial Advisors LLC | 0 | -100,00 | 0 | |||||
| 2025-08-12 | 13F | BlackRock, Inc. | 0 | -100,00 | 0 | |||||
| 2025-08-11 | 13F | CBIZ Investment Advisory Services, LLC | 0 | -100,00 | 0 | |||||
| 2025-08-08 | 13F | Fortis Group Advisors, LLC | 11 | 0,00 | 0 | |||||
| 2025-07-21 | 13F | HighMark Wealth Management LLC | 1.319 | 318,73 | 24 | 283,33 | ||||
| 2025-08-05 | 13F | Simplex Trading, Llc | 2.858 | 79,30 | 0 | |||||
| 2025-08-06 | 13F | AE Wealth Management LLC | 541 | 161,35 | 10 | 125,00 | ||||
| 2025-08-14 | 13F | Wells Fargo & Company/mn | 33 | 1 | ||||||
| 2025-08-14 | 13F | Citadel Advisors Llc | Put | 18.472 | 28,14 | 332 | 17,79 | |||
| 2025-07-25 | 13F | Cwm, Llc | 114 | -20,28 | 0 | |||||
| 2025-07-15 | 13F | Financial Management Professionals, Inc. | 36 | 0,00 | 1 | |||||
| 2025-08-12 | 13F | CIBC Private Wealth Group, LLC | 463 | -1,07 | 8 | 14,29 | ||||
| 2025-07-17 | 13F | Albion Financial Group /ut | 136 | 0,00 | 2 | 0,00 | ||||
| 2025-08-12 | 13F | Steward Partners Investment Advisory, Llc | 323 | 0,00 | 6 | -16,67 | ||||
| 2025-08-14 | 13F | Sunbelt Securities, Inc. | 409 | 1.139,39 | 1 |