Grundlæggende statistik
| Institutionelle ejere | 93 total, 93 long only, 0 short only, 0 long/short - change of 4,49% MRQ |
| Gennemsnitlig porteføljeallokering | 0.0611 % - change of 16,91% MRQ |
| Institutionelle aktier (lange) | 18.848.910 (ex 13D/G) - change of 1,10MM shares 6,18% MRQ |
| Institutionel værdi (lang) | $ 94.907 USD ($1000) |
Institutionelt ejerskab og aktionærer
MFS Municipal Income Trust (US:MFM) har 93 institutionelle ejere og aktionærer, der har indsendt 13D/G- eller 13F-formularer til Securities Exchange Commission (SEC). Disse institutioner har i alt 18,848,910 aktier. Største aktionærer omfatter Pathstone Holdings, LLC, Bank Of America Corp /de/, UBS Group AG, Advisors Asset Management, Inc., Guggenheim Capital Llc, Rivernorth Capital Management, Llc, Janney Montgomery Scott LLC, Hennion & Walsh Asset Management, Inc., Invesco Ltd., and Logan Stone Capital, LLC .
MFS Municipal Income Trust (NYSE:MFM) institutionel ejerskabsstruktur viser aktuelle positioner i virksomheden efter institutioner og fonde, samt seneste ændringer i positionsstørrelse. Større aktionærer kan omfatte individuelle investorer, investeringsforeninger, hedgefonde eller institutioner. Skema 13D angiver, at investoren besidder (eller besidder) mere end 5 % af virksomheden og har til hensigt (eller har til hensigt at) aktivt at forfølge en ændring i forretningsstrategi. Skema 13G indikerer en passiv investering på over 5%.
The share price as of February 27, 2026 is 5,59 / share. Previously, on March 3, 2025, the share price was 5,59 / share. This represents an increase of 0,00% over that period.

Fondens stemningsscore
Fund Sentiment Score (fka Ownership Accumulation Score) finder de aktier, der bliver mest købt af fonde. Det er resultatet af en sofistikeret, multi-faktor kvantitativ model, der identificerer virksomheder med de højeste niveauer af institutionel akkumulering. Scoringsmodellen bruger en kombination af den samlede stigning i oplyste ejere, ændringerne i porteføljeallokeringer i disse ejere og andre målinger. Tallet går fra 0 til 100, hvor højere tal indikerer et højere niveau af akkumulering for sine jævnaldrende, og 50 er gennemsnittet.
Opdateringsfrekvens: Dagligt
Se Ownership Explorer, som giver en liste over højest rangerende virksomheder.
AI+ Ask Fintel’s AI assistant about MFS Municipal Income Trust.
Select a question to share a public post with an AI-crafted answer.
Thinking of good questions…
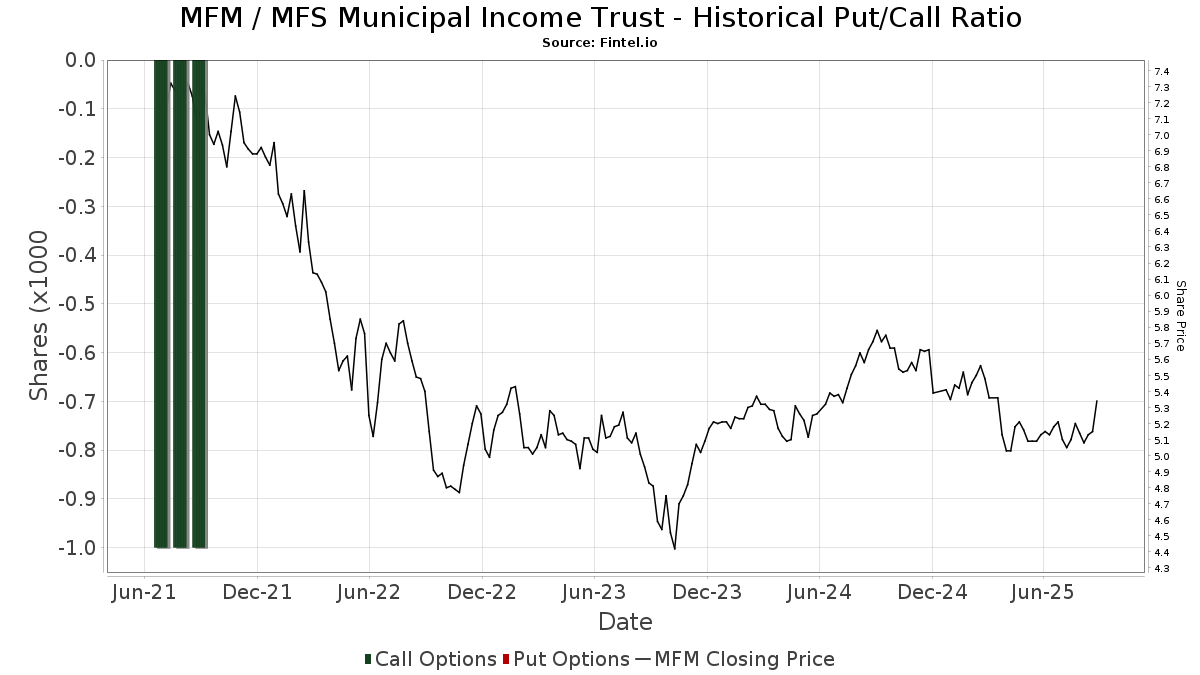
Institutionel Put/Call-forhold
Ud over at indberette standardaktie- og gældsudstedelser skal institutter med mere end 100 mill. aktiver under forvaltning også oplyse deres put- og call-optionsbeholdninger. Da salgsoptioner generelt indikerer negativ stemning, og købsoptioner indikerer positiv stemning, kan vi få en fornemmelse af den overordnede institutionelle stemning ved at plotte forholdet mellem put og kald. Diagrammet til højre viser det historiske put/call-forhold for dette instrument.
Brug af Put/Call Ratio som en indikator for investorernes stemning overvinder en af de vigtigste mangler ved at bruge totalt institutionelt ejerskab, som er, at en betydelig mængde af aktiver under forvaltning investeres passivt for at spore indekser. Passivt forvaltede fonde køber typisk ikke optioner, så indikatoren for put/call-forholdet følger mere nøje følelsen af aktivt forvaltede fonde.
13F og NPORT arkivering
Detaljer om 13F-arkivering er gratis. Detaljer om NP-ansøgninger kræver et premium-medlemskab. Grønne rækker angiver nye positioner. Røde rækker angiver lukkede positioner. Klik på linket ikon for at se den fulde transaktionshistorik.
Opgrader
for at låse premium-data op og eksportere til Excel ![]() .
.
| Fil dato | Kilde | Investor | Type | Gennemsnitlig pris (Øst) |
Aktier | Δ Aktier (%) |
Rapporteret Værdi ($1000) |
Δ Værdi (%) |
Port Alloc (%) |
|
|---|---|---|---|---|---|---|---|---|---|---|
| 2026-02-13 | 13F | Mariner, LLC | 12.126 | -2,16 | 66 | -1,52 | ||||
| 2025-11-13 | 13F | Landscape Capital Management, L.l.c. | 0 | -100,00 | 0 | |||||
| 2025-11-12 | 13F | Rsm Us Wealth Management Llc | 0 | -100,00 | 0 | -100,00 | ||||
| 2026-01-13 | 13F | Balanced Wealth Group Llc | 190.172 | 1.021 | ||||||
| 2026-02-10 | 13F | Bank of New York Mellon Corp | 163.324 | 10,74 | 887 | 11,59 | ||||
| 2026-02-11 | 13F | LPL Financial LLC | 254.737 | -0,32 | 1.383 | 0,44 | ||||
| 2026-02-11 | 13F | Closed-End Fund Advisors, Inc. | 265.652 | 1.442 | ||||||
| 2025-10-28 | 13F | Wolverine Asset Management Llc | 0 | -100,00 | 0 | -100,00 | ||||
| 2026-02-17 | 13F | Cetera Investment Advisers | 28.035 | -15,61 | 152 | -15,08 | ||||
| 2026-02-12 | 13F | Commonwealth Equity Services, Llc | 0 | -100,00 | 0 | |||||
| 2026-02-13 | 13F | SRS Capital Advisors, Inc. | 27 | 0 | ||||||
| 2026-01-05 | 13F | Noble Wealth Management PBC | 30.530 | 0,00 | 166 | 0,61 | ||||
| 2026-02-17 | 13F | Susquehanna International Group, Llp | 27.627 | 78,56 | 150 | 80,72 | ||||
| 2026-02-17 | 13F | Whitebox Advisors Llc | 125.000 | 679 | ||||||
| 2026-02-06 | 13F | HighTower Advisors, LLC | 32.427 | 17,20 | 176 | 18,12 | ||||
| 2026-02-13 | 13F | Baird Financial Group, Inc. | 23.676 | 0,00 | 129 | 0,79 | ||||
| 2026-02-17 | 13F | Royal Bank Of Canada | 103.966 | 20,01 | 565 | 20,99 | ||||
| 2026-02-17 | 13F | Wiley Bros.-aintree Capital, Llc | 27.779 | 151 | ||||||
| 2026-02-17 | 13F | Nomura Holdings Inc | 17.062 | 70,62 | 93 | 73,58 | ||||
| 2026-02-17 | 13F | Advisor Group Holdings, Inc. | 46.599 | 42,85 | 253 | 48,82 | ||||
| 2025-10-02 | 13F | Bank of New Hampshire | 500 | 0,00 | 3 | 0,00 | ||||
| 2025-11-04 | 13F | Jones Financial Companies Lllp | 0 | -100,00 | 0 | |||||
| 2026-02-17 | 13F | Ameriprise Financial Inc | 91.627 | 3,12 | 498 | 3,97 | ||||
| 2026-01-13 | 13F | Riverbridge Partners Llc | 163.727 | 46,60 | 889 | 47,92 | ||||
| 2026-01-16 | 13F | Catalina Capital Group, LLC | 70.125 | 0,00 | 381 | 0,80 | ||||
| 2026-02-17 | 13F | Rivernorth Capital Management, Llc | 810.998 | 104,00 | 4.404 | 105,56 | ||||
| 2026-01-16 | 13F | Melfa Wealth Management, Llc | 151.674 | 19,22 | 824 | 20,15 | ||||
| 2026-01-23 | 13F | Tyche Wealth Partners LLC | 80.005 | -1,44 | 434 | -0,69 | ||||
| 2026-02-12 | 13F | Jane Street Group, Llc | 38.866 | 274,50 | 211 | 283,64 | ||||
| 2026-02-17 | 13F | Raymond James Financial Inc | 209.675 | 6,10 | 1.139 | 6,85 | ||||
| 2026-01-14 | 13F | Hennion & Walsh Asset Management, Inc. | 675.044 | 29,95 | 3.665 | 30,94 | ||||
| 2026-02-12 | 13F | Summit Financial, LLC | 56.105 | 0,06 | 305 | 0,66 | ||||
| 2026-02-05 | 13F | Center for Financial Planning, Inc. | 15.000 | -50,00 | 81 | -49,69 | ||||
| 2026-02-13 | 13F | Integrated Wealth Concepts LLC | 15.789 | -1,10 | 86 | -1,16 | ||||
| 2025-11-05 | 13F | Anderson Financial Strategies, LLC | 0 | -100,00 | 0 | |||||
| 2026-01-26 | 13F | PFG Investments, LLC | 27.176 | 0,20 | 148 | 0,68 | ||||
| 2026-01-08 | 13F | Integrated Capital Management, Inc. | 24.148 | -3,30 | 131 | -2,24 | ||||
| 2026-02-19 | 13F | CI Private Wealth, LLC | 20.513 | 0,00 | 111 | 0,91 | ||||
| 2026-01-29 | 13F | Ashton Thomas Private Wealth, LLC | 0 | -100,00 | 0 | |||||
| 2026-02-06 | 13F | Commonwealth Financial Services, LLC | 10.000 | 0,00 | 54 | 1,89 | ||||
| 2026-02-13 | 13F | MAI Capital Management | 700 | 0,00 | 4 | 0,00 | ||||
| 2026-01-30 | 13F | Activest Wealth Management | 14.816 | 0,00 | 80 | 1,27 | ||||
| 2026-02-12 | 13F | Colonial Trust Advisors | 5.414 | -52,57 | 29 | -52,46 | ||||
| 2026-02-18 | 13F | Garton & Associates Financial Advisors LLC | 6.871 | 37 | ||||||
| 2026-02-18 | 13F | GWM Advisors LLC | 140.658 | 45,11 | 764 | 46,17 | ||||
| 2026-01-23 | 13F | Bridgewater Advisors Inc. | 127.250 | 21,61 | 696 | 23,84 | ||||
| 2026-01-21 | 13F | Wealthbridge Capital Management, Llc | 0 | -100,00 | 0 | |||||
| 2026-01-28 | 13F | Amarillo National Bank | 11.502 | 0,00 | 62 | 1,64 | ||||
| 2026-02-17 | 13F | Saba Capital Management, L.P. | 265.800 | -71,07 | 1.443 | -70,86 | ||||
| 2026-02-09 | 13F | Blue Bell Private Wealth Management, Llc | 38.571 | -3,45 | 209 | -2,79 | ||||
| 2026-02-14 | 13F | Rockefeller Capital Management L.P. | 154.492 | 5,68 | 839 | 6,48 | ||||
| 2026-01-20 | 13F | American National Bank | 2.820 | 0,00 | 15 | 0,00 | ||||
| 2026-02-13 | 13F | Verition Fund Management LLC | 11.076 | 0,00 | 60 | 1,69 | ||||
| 2026-02-17 | 13F | Guggenheim Capital Llc | 918.774 | -2,65 | 4.989 | -1,93 | ||||
| 2026-02-12 | 13F | Steward Partners Investment Advisory, Llc | 55.835 | 0,00 | 303 | 1,00 | ||||
| 2026-01-29 | 13F | UBS Group AG | 1.165.389 | 2,19 | 6.328 | 2,94 | ||||
| 2026-02-11 | 13F | Ackerman Capital Advisors, LLC | 34.993 | 48,02 | 190 | 49,61 | ||||
| 2026-02-17 | 13F | Almitas Capital LLC | 134.361 | 730 | ||||||
| 2025-10-31 | 13F | NWF Advisory Services Inc. | 10.000 | 0,00 | 54 | 3,92 | ||||
| 2025-11-13 | 13F | Parallel Advisors, LLC | 0 | -100,00 | 0 | |||||
| 2026-02-17 | 13F | Balyasny Asset Management Llc | 11.300 | 61 | ||||||
| 2026-02-17 | 13F | Creative Planning | 124.460 | -21,99 | 676 | -21,42 | ||||
| 2026-02-17 | 13F | Equitable Holdings, Inc. | 40.349 | 0,58 | 219 | 1,39 | ||||
| 2026-01-28 | 13F | Chicago Partners Investment Group LLC | 22.224 | 0,89 | 120 | 0,84 | ||||
| 2026-01-08 | 13F | Gridiron Partners, LLC | 11.873 | -96,15 | 64 | 1,59 | ||||
| 2026-02-06 | 13F | IFP Advisors, Inc | 8.010 | 0,00 | 43 | 0,00 | ||||
| 2025-09-24 | NP | XMPT - VanEck Vectors CEF Municipal Income ETF | 293.235 | 2,38 | 1.504 | 1,42 | ||||
| 2026-02-13 | 13F | Thomas J. Herzfeld Advisors, Inc. | 137.475 | 1,53 | 746 | 2,33 | ||||
| 2026-02-12 | 13F | Advisors Asset Management, Inc. | 1.131.102 | 27,73 | 6.142 | 28,66 | ||||
| 2026-02-06 | 13F | Aviance Capital Partners, LLC | 46.422 | 0,33 | 252 | 1,20 | ||||
| 2026-02-19 | 13F | Invesco Ltd. | 477.800 | 7,51 | 2.594 | 8,31 | ||||
| 2026-01-14 | 13F | Wealthcare Advisory Partners LLC | 27.230 | 0,00 | 148 | 0,68 | ||||
| 2026-02-13 | 13F | Wells Fargo & Company/mn | 100.222 | 6,92 | 544 | 7,72 | ||||
| 2026-02-17 | 13F | Advisory Services Network, LLC | 0 | -100,00 | 0 | |||||
| 2026-01-05 | 13F | Park Avenue Securities Llc | 0 | -100,00 | 0 | |||||
| 2026-02-17 | 13F | Bank Of America Corp /de/ | 1.587.494 | -4,91 | 8.620 | -4,20 | ||||
| 2026-02-05 | 13F | Cambridge Investment Research Advisors, Inc. | 117.525 | 3,99 | 1 | |||||
| 2026-02-13 | 13F | Morgan Stanley | 177.680 | 1,97 | 965 | 2,66 | ||||
| 2026-02-26 | 13F | Anchor Investment Management, LLC | 650 | 0,00 | 4 | 0,00 | ||||
| 2026-02-17 | 13F | Citadel Advisors Llc | 15.626 | 85 | ||||||
| 2026-01-29 | 13F | Matisse Capital | 52.241 | 0,00 | 284 | 0,71 | ||||
| 2026-02-13 | 13F | Robinson Capital Management, Llc | 161.488 | 59,12 | 877 | 60,15 | ||||
| 2026-01-13 | 13F | Capital Investment Advisors, LLC | 107.298 | -6,72 | 583 | -6,13 | ||||
| 2026-01-29 | 13F | Sanctuary Advisors, LLC | 11.578 | 0,00 | 63 | 0,00 | ||||
| 2026-01-29 | 13F | Mackay Shields Llc | 339.657 | -21,59 | 1.844 | -20,99 | ||||
| 2026-02-06 | 13F | GPS Wealth Strategies Group, LLC | 0 | -100,00 | 0 | |||||
| 2026-02-13 | 13F | Pathstone Holdings, LLC | 4.646.069 | 17,77 | 25.228 | 18,65 | ||||
| 2026-02-13 | 13F | Cohen & Steers, Inc. | 170.000 | 6,25 | 1 | |||||
| 2026-02-17 | 13F | Logan Stone Capital, LLC | 439.446 | -13,54 | 2.386 | -12,89 | ||||
| 2026-02-11 | 13F | Commonwealth Retirement Investments LLC | 3.618 | 20 | ||||||
| 2025-10-14 | 13F | S.A. Mason LLC | 0 | -100,00 | 0 | |||||
| 2026-02-10 | 13F/A | Northwestern Mutual Wealth Management Co | 43.863 | -26,63 | 238 | -26,09 | ||||
| 2026-02-10 | 13F | Rothschild Investment Llc | 53.000 | 0,00 | 288 | 0,70 | ||||
| 2026-02-04 | 13F | Pensionmark Financial Group, Llc | 14.212 | 0,00 | 77 | 1,32 | ||||
| 2026-02-11 | 13F | Janney Montgomery Scott LLC | 712.453 | 7,20 | 4 | 0,00 | ||||
| 2025-10-27 | 13F | Bogart Wealth, LLC | 0 | -100,00 | 0 | |||||
| 2026-02-17 | 13F | Warren Averett Asset Management, LLC | 21.292 | 17,65 | 116 | 18,56 | ||||
| 2026-02-17 | 13F | Private Advisor Group, LLC | 152.627 | -26,06 | 829 | -25,54 | ||||
| 2025-11-07 | 13F | Readystate Asset Management Lp | 0 | -100,00 | 0 | -100,00 | ||||
| 2026-01-30 | 13F | Us Bancorp \de\ | 2.080 | 0,00 | 11 | 0,00 | ||||
| 2026-02-04 | 13F | Ameritas Advisory Services, LLC | 0 | -100,00 | 0 | |||||
| 2026-01-16 | 13F | Beaumont Financial Advisors, LLC | 11.253 | 61 | ||||||
| 2026-02-13 | 13F | Van Eck Associates Corp | 346.471 | 13,32 | 2 | 0,00 | ||||
| 2026-01-14 | 13F | Eastern Bank | 500 | 0,00 | 3 | 0,00 | ||||
| 2025-11-10 | 13F | First Financial Bankshares Inc | 0 | -100,00 | 0 | |||||
| 2026-02-19 | 13F | Atomi Financial Group, Inc. | 19.595 | 106 | ||||||
| 2026-02-13 | 13F | Kilter Group LLC | 2.426 | 1,38 | 13 | 8,33 | ||||
| 2026-02-10 | 13F | Envestnet Asset Management Inc | 240.866 | -1,20 | 1.308 | -0,53 | ||||
| 2026-02-13 | 13F | Mml Investors Services, Llc | 46.820 | -3,07 | 254 | -2,31 | ||||
| 2026-01-09 | 13F | Silverlake Wealth Management Llc | 10.347 | 0,00 | 56 | 1,82 |