Grundlæggende statistik
| Institutionelle aktier (lange) | 76.530.765 - 104,85% (ex 13D/G) - change of 25,14MM shares 48,92% MRQ |
| Institutionel værdi (lang) | $ 758.086 USD ($1000) |
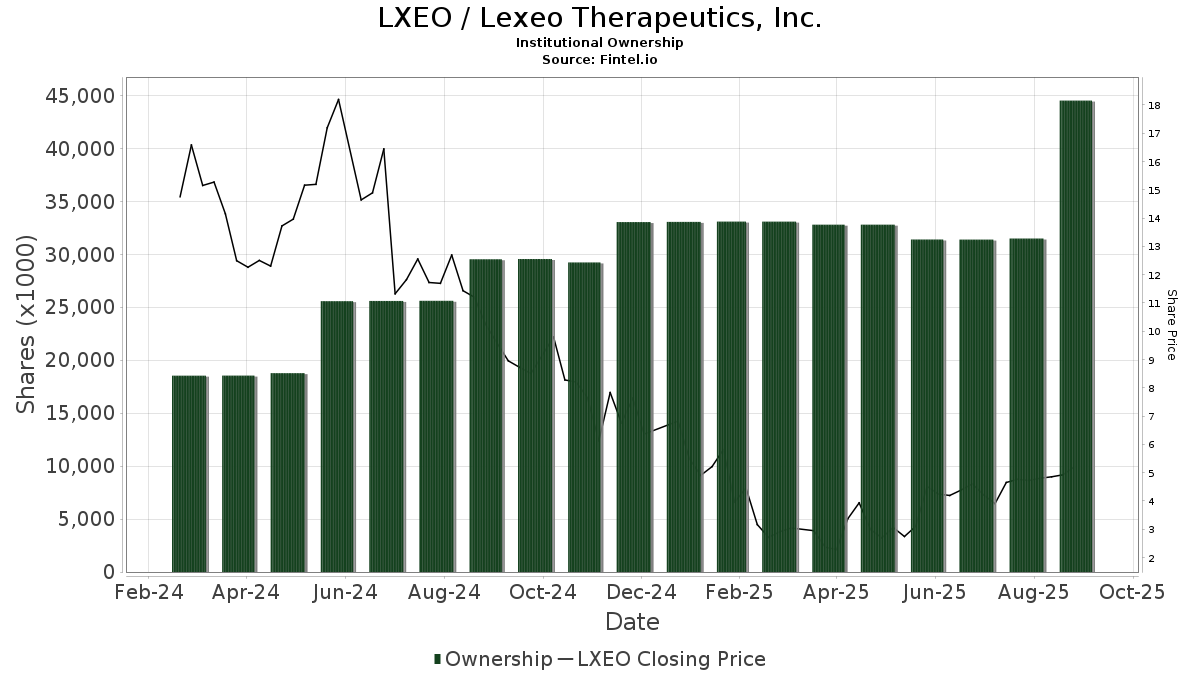
Institutionelt ejerskab og aktionærer
Lexeo Therapeutics, Inc. (US:LXEO) har 168 institutionelle ejere og aktionærer, der har indsendt 13D/G- eller 13F-formularer til Securities Exchange Commission (SEC). Disse institutioner har i alt 76,530,765 aktier. Største aktionærer omfatter Janus Henderson Group Plc, Ra Capital Management, L.p., BlackRock, Inc., Paradigm Biocapital Advisors LP, Vestal Point Capital, LP, Frazier Life Sciences Management, L.P., Vanguard Group Inc, Citadel Advisors Llc, Avoro Capital Advisors LLC, and Affinity Asset Advisors, LLC .
Lexeo Therapeutics, Inc. (NasdaqGM:LXEO) institutionel ejerskabsstruktur viser aktuelle positioner i virksomheden efter institutioner og fonde, samt seneste ændringer i positionsstørrelse. Større aktionærer kan omfatte individuelle investorer, investeringsforeninger, hedgefonde eller institutioner. Skema 13D angiver, at investoren besidder (eller besidder) mere end 5 % af virksomheden og har til hensigt (eller har til hensigt at) aktivt at forfølge en ændring i forretningsstrategi. Skema 13G indikerer en passiv investering på over 5%.
The share price as of March 13, 2026 is 6,66 / share. Previously, on March 17, 2025, the share price was 3,11 / share. This represents an increase of 114,15% over that period.
Fondens stemningsscore
Fund Sentiment Score (fka Ownership Accumulation Score) finder de aktier, der bliver mest købt af fonde. Det er resultatet af en sofistikeret, multi-faktor kvantitativ model, der identificerer virksomheder med de højeste niveauer af institutionel akkumulering. Scoringsmodellen bruger en kombination af den samlede stigning i oplyste ejere, ændringerne i porteføljeallokeringer i disse ejere og andre målinger. Tallet går fra 0 til 100, hvor højere tal indikerer et højere niveau af akkumulering for sine jævnaldrende, og 50 er gennemsnittet.
Opdateringsfrekvens: Dagligt
Se Ownership Explorer, som giver en liste over højest rangerende virksomheder.
AI+ Ask Fintel’s AI assistant about Lexeo Therapeutics, Inc..
Select a question to share a public post with an AI-crafted answer.
Thinking of good questions…
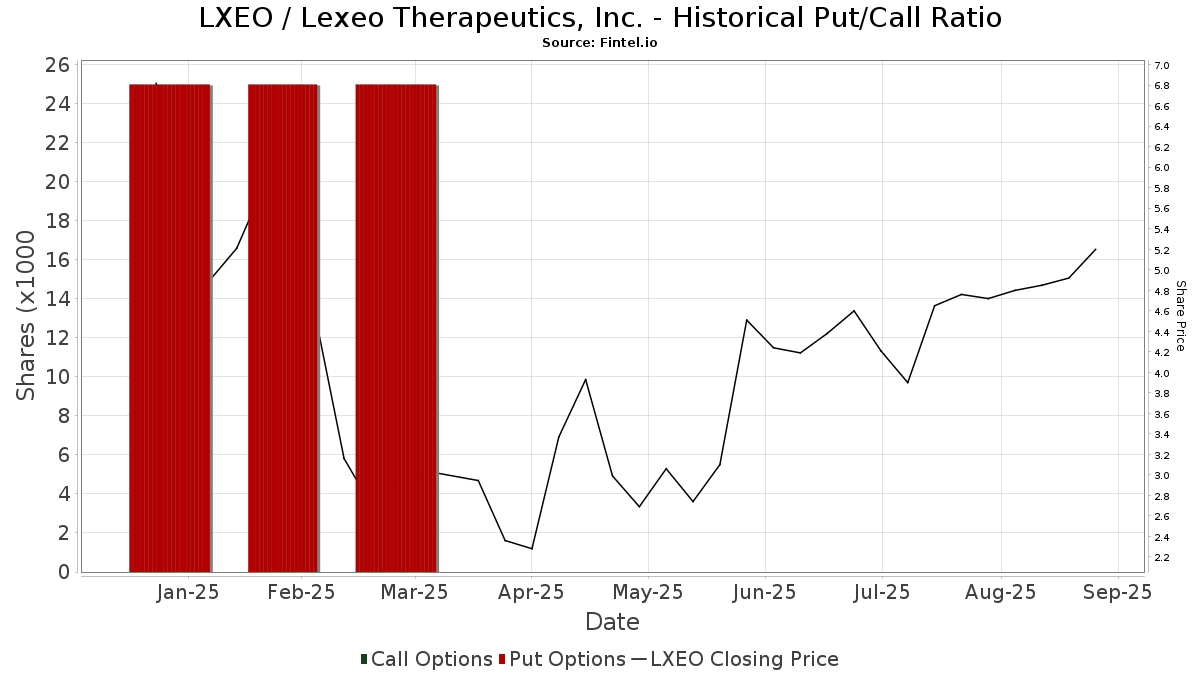
Institutionel Put/Call-forhold
Ud over at indberette standardaktie- og gældsudstedelser skal institutter med mere end 100 mill. aktiver under forvaltning også oplyse deres put- og call-optionsbeholdninger. Da salgsoptioner generelt indikerer negativ stemning, og købsoptioner indikerer positiv stemning, kan vi få en fornemmelse af den overordnede institutionelle stemning ved at plotte forholdet mellem put og kald. Diagrammet til højre viser det historiske put/call-forhold for dette instrument.
Brug af Put/Call Ratio som en indikator for investorernes stemning overvinder en af de vigtigste mangler ved at bruge totalt institutionelt ejerskab, som er, at en betydelig mængde af aktiver under forvaltning investeres passivt for at spore indekser. Passivt forvaltede fonde køber typisk ikke optioner, så indikatoren for put/call-forholdet følger mere nøje følelsen af aktivt forvaltede fonde.
13D/G-arkivering
Vi præsenterer 13D/G ansøgninger separat fra 13F ansøgninger på grund af den forskellige behandling af SEC. 13D/G-ansøgninger kan indgives af grupper af investorer (med én ledende), hvorimod 13F-ansøgninger ikke kan. Dette resulterer i situationer, hvor en investor kan indsende en 13D/G, der rapporterer én værdi for de samlede aktier (der repræsenterer alle de aktier, der ejes af investorgruppen), men derefter indsender en 13F, der rapporterer en anden værdi for de samlede aktier (der udelukkende repræsenterer deres egne) ejendomsret). Det betyder, at aktieejerskab af 13D/G-arkiver og 13F-arkiveringer ofte ikke er direkte sammenlignelige, så vi præsenterer dem separat.
Bemærk: Fra den 16. maj 2021 viser vi ikke længere ejere, der ikke har indsendt en 13D/G inden for det seneste år. Tidligere viste vi den fulde historie af 13D/G-arkiver. Generelt skal enheder, der er forpligtet til at indgive 13D/G-ansøgninger, indgive mindst årligt, før de indsender en afsluttende ansøgning. Dog forlader fonde nogle gange positioner uden at indsende en afsluttende ansøgning (dvs. de afvikler), så visning af den fulde historie resulterede nogle gange i forvirring om det nuværende ejerskab. For at undgå forvirring viser vi nu kun 'aktuelle' ejere - det vil sige - ejere, der har anmeldt inden for det seneste år.
Upgrade to unlock premium data.
| Fil dato | Form | Investor | Forrige Aktier |
Seneste Aktier |
Δ Aktier (Procent) |
Ejendomsret (Procent) |
Δ Ejerskab (Procent) |
|
|---|---|---|---|---|---|---|---|---|
| 2026-02-17 | CITADEL ADVISORS LLC | 5,334,112 | 5,498,219 | 3.08 | 7.40 | -22.92 | ||
| 2026-02-17 | BALYASNY ASSET MANAGEMENT LLC | 5,394,721 | 7,221,555 | 33.86 | 9.89 | -1.00 | ||
| 2026-02-17 | Paradigm Biocapital Advisors LP | 3,671,999 | 4,763,198 | 29.72 | 6.50 | 30.00 | ||
| 2026-02-13 | Frazier Life Sciences Public Fund, L.P. | 3,073,467 | 3,698,271 | 20.33 | 5.10 | -10.53 | ||
| 2026-01-30 | VANGUARD GROUP INC | 3,894,310 | 5.33 | |||||
| 2026-01-29 | Affinity Asset Advisors, LLC | 4,252,005 | 5,217,660 | 22.71 | 7.10 | -8.39 | ||
| 2026-01-21 | BlackRock, Inc. | 2,168,444 | 4,885,814 | 125.31 | 6.70 | 67.50 | ||
| 2025-12-08 | JANUS HENDERSON GROUP PLC | 6,105,527 | 7,291,434 | 19.42 | 9.99 | -11.59 | ||
| 2025-11-14 | Vestal Point Capital, LP | 3,228,161 | 4,117,302 | 27.54 | 7.50 | 25.00 | ||
| 2025-11-14 | Longitude Capital Partners IV, LLC | 2,765,381 | 2,765,381 | 0.00 | 3.80 | -54.76 | ||
| 2025-11-07 | INTEGRATED CORE STRATEGIES (US) LLC | 2,836,292 | 2,313,642 | -18.43 | 3.20 | -39.62 | ||
| 2025-10-27 | RA CAPITAL MANAGEMENT, L.P. | 5,000,000 | 6.90 | |||||
| 2025-05-15 | D1 Capital Partners L.P. | 2,506,607 | 978,652 | -60.96 | 2.90 | -69.15 | ||
| 2025-05-13 | MIZUHO FINANCIAL GROUP INC | 1,926,331 | 2,203,631 | 14.40 | 6.60 | 13.79 | ||
| 2025-05-12 | Adage Capital Management, L.P. | 2,209,615 | 237,953 | -89.23 | 0.70 | -89.52 | ||
| 2025-02-14 | Omega Fund VI, L.P. | 2,157,623 | 1,184,636 | -45.10 | 3.60 | -55.56 | ||
| 2025-02-14 | EVENTIDE ASSET MANAGEMENT, LLC | 1,855,986 | 1,234,834 | -33.47 | 3.73 | -33.51 |
13F og NPORT arkivering
Detaljer om 13F-arkivering er gratis. Detaljer om NP-ansøgninger kræver et premium-medlemskab. Grønne rækker angiver nye positioner. Røde rækker angiver lukkede positioner. Klik på linket ikon for at se den fulde transaktionshistorik.
Opgrader
for at låse premium-data op og eksportere til Excel ![]() .
.
| Fil dato | Kilde | Investor | Type | Gennemsnitlig pris (Øst) |
Aktier | Δ Aktier (%) |
Rapporteret Værdi ($1000) |
Δ Værdi (%) |
Port Alloc (%) |
|
|---|---|---|---|---|---|---|---|---|---|---|
| 2026-02-10 | 13F | Rothschild Investment Llc | 1 | 0 | ||||||
| 2026-02-10 | 13F | Intech Investment Management Llc | 14.188 | 19,52 | 141 | 79,49 | ||||
| 2026-01-05 | 13F | GAMMA Investing LLC | 50 | 0 | ||||||
| 2026-02-17 | 13F | Atom Investors LP | 68.491 | 680 | ||||||
| 2026-02-19 | 13F | Invesco Ltd. | 463.029 | 4.598 | ||||||
| 2026-02-12 | 13F | Renaissance Technologies Llc | 217.772 | 45,86 | 2.162 | 118,16 | ||||
| 2026-02-13 | 13F | American Century Companies Inc | 45.988 | 27,20 | 457 | 90,00 | ||||
| 2026-02-13 | 13F | Ieq Capital, Llc | 24.692 | -26,47 | 245 | 10,36 | ||||
| 2025-12-15 | 13F | FNY Investment Advisers, LLC | 0 | -100,00 | 0 | |||||
| 2026-02-11 | 13F | Los Angeles Capital Management Llc | 11.555 | 4,33 | 109 | 47,95 | ||||
| 2026-02-17 | 13F | Two Sigma Advisers, Lp | 81.300 | 807 | ||||||
| 2026-02-17 | 13F | Royal Bank Of Canada | 6.721 | -1,87 | 67 | 45,65 | ||||
| 2026-02-17 | 13F | Aqr Capital Management Llc | 337.386 | -3,03 | 3.350 | 45,02 | ||||
| 2025-09-29 | NP | SUNAMERICA SERIES TRUST - SA Small Cap Index Portfolio Class 1 | 2.041 | -23,87 | 10 | -10,00 | ||||
| 2026-02-13 | 13F | Morgan Stanley | 140.181 | 42,96 | 1.392 | 113,67 | ||||
| 2026-02-17 | 13F | Bank Of America Corp /de/ | 160.288 | 466,81 | 1.592 | 750,80 | ||||
| 2026-02-03 | 13F | SBI Securities Co., Ltd. | 217 | 10,15 | 2 | 100,00 | ||||
| 2026-02-12 | 13F | Jane Street Group, Llc | 140.096 | 8,21 | 1.391 | 61,93 | ||||
| 2026-02-17 | 13F | Price T Rowe Associates Inc /md/ | 33.872 | 183,09 | 0 | |||||
| 2026-02-17 | 13F | Advisor Group Holdings, Inc. | 57 | -66,47 | 1 | -100,00 | ||||
| 2026-02-17 | 13F | Susquehanna International Group, Llp | Put | 12.100 | -6,20 | 120 | 41,18 | |||
| 2026-02-13 | 13F | Smartleaf Asset Management LLC | 4 | 0 | ||||||
| 2026-02-17 | 13F | Raymond James Financial Inc | 12.538 | 125 | ||||||
| 2026-02-17 | 13F | Susquehanna International Group, Llp | Call | 12.200 | 121 | |||||
| 2026-02-17 | 13F | Susquehanna International Group, Llp | 37.009 | 27,92 | 367 | 91,15 | ||||
| 2026-02-17 | 13F | Creative Planning | 10.358 | 103 | ||||||
| 2026-01-29 | 13F | Vanguard Group Inc | 3.894.310 | 74,92 | 38.670 | 161,60 | ||||
| 2026-02-12 | 13F | Silverarc Capital Management, Llc | 617.608 | -20,68 | 6.133 | 18,63 | ||||
| 2026-02-17 | 13F | Blackstone Group Inc | 904.959 | -19,55 | 8.986 | 20,31 | ||||
| 2025-11-14 | 13F | Omega Fund Management, LLC | 0 | -100,00 | 0 | |||||
| 2026-02-12 | 13F | Hrt Financial Lp | 0 | -100,00 | 0 | |||||
| 2026-02-17 | 13F | Scientech Research LLC | 0 | -100,00 | 0 | |||||
| 2026-02-17 | 13F | Millennium Management Llc | 908.024 | -60,75 | 9.017 | -41,31 | ||||
| 2026-02-17 | 13F | Ra Capital Management, L.p. | 5.000.000 | 49.650 | ||||||
| 2026-02-17 | 13F | Vestal Point Capital, LP | 4.475.000 | 37,69 | 44.437 | 105,91 | ||||
| 2025-09-24 | NP | Innovator ETFs Trust - Innovator U.S. Small Cap Managed Floor ETF | 1.600 | 6,24 | 8 | 40,00 | ||||
| 2026-01-27 | 13F | Gf Fund Management Co. Ltd. | 1.434 | 23,41 | 14 | 100,00 | ||||
| 2026-02-13 | 13F | Citigroup Inc | 15.293 | 105,77 | 152 | 208,16 | ||||
| 2025-09-26 | NP | UAPIX - Ultrasmall-cap Profund Investor Class | 264 | 10,46 | 1 | |||||
| 2026-02-13 | 13F | SRS Capital Advisors, Inc. | 0 | -100,00 | 0 | |||||
| 2026-02-17 | 13F | Janus Henderson Group Plc | 5.509.635 | -9,76 | 54.669 | 35,01 | ||||
| 2026-01-30 | 13F | Us Bancorp \de\ | 555 | 6 | ||||||
| 2026-01-20 | 13F | Signaturefd, Llc | 290 | 62,92 | 3 | 100,00 | ||||
| 2026-02-06 | 13F | EverSource Wealth Advisors, LLC | 731 | 0,00 | 7 | 75,00 | ||||
| 2026-02-13 | 13F | Panagora Asset Management Inc | 34.297 | 0,00 | 341 | 49,78 | ||||
| 2026-02-17 | 13F | Point72 Asset Management, L.P. | 1.894.722 | -2,43 | 18.815 | 45,92 | ||||
| 2026-02-03 | 13F | Mitsubishi UFJ Kokusai Asset Management Co., Ltd. | 26.209 | 252 | ||||||
| 2026-02-17 | 13F | Ikarian Capital, LLC | 513.011 | -9,62 | 5.094 | 35,19 | ||||
| 2026-02-11 | 13F | Simplex Trading, Llc | 13.031 | 2.511,42 | 129 | |||||
| 2026-02-17 | 13F | Persistent Asset Partners Ltd | 16.025 | 159 | ||||||
| 2026-02-09 | 13F | Legal & General Group Plc | 5.631 | 177,12 | 56 | 323,08 | ||||
| 2026-02-17 | 13F | Balyasny Asset Management Llc | 1.635.026 | -58,22 | 16.236 | -37,53 | ||||
| 2026-02-13 | 13F | Rafferty Asset Management, LLC | 102.159 | 1.014 | ||||||
| 2026-02-05 | 13F | Soltis Investment Advisors LLC | 20.000 | 0,00 | 199 | 50,00 | ||||
| 2026-02-17 | 13F | Burkehill Global Management, LP | 125.000 | 1.241 | ||||||
| 2026-02-13 | 13F | Y-Intercept (Hong Kong) Ltd | 231.163 | 2.295 | ||||||
| 2026-02-06 | 13F | ProShare Advisors LLC | 14.752 | 146 | ||||||
| 2026-02-05 | 13F | Bessemer Group Inc | 2.380 | 0 | ||||||
| 2026-02-06 | 13F | Gsa Capital Partners Llp | 11.463 | 0 | ||||||
| 2026-02-13 | 13F | Police & Firemen's Retirement System of New Jersey | 16.373 | 171,08 | 163 | 305,00 | ||||
| 2026-02-17 | 13F | Susquehanna Portfolio Strategies, LLC | 26.205 | 14,39 | 260 | 71,05 | ||||
| 2026-02-17 | 13F | Woodline Partners LP | 3.197.760 | 24,32 | 31.754 | 85,92 | ||||
| 2025-11-14 | 13F | Ally Bridge Group (NY) LLC | 0 | -100,00 | 0 | -100,00 | ||||
| 2026-02-17 | 13F | Two Sigma Investments, Lp | 400.567 | 372,57 | 3.978 | 607,65 | ||||
| 2025-09-29 | NP | KCXIX - Knights of Columbus U.S. All Cap Index Fund I Shares | 77 | 1,32 | 0 | |||||
| 2025-11-14 | 13F | Skopos Labs, Inc. | 0 | -100,00 | 0 | |||||
| 2026-02-17 | 13F | Ameriprise Financial Inc | 243.294 | 46,09 | 2.416 | 118,55 | ||||
| 2026-02-13 | 13F | Verition Fund Management LLC | 428.458 | 3,28 | 4.255 | 54,47 | ||||
| 2026-02-10 | 13F | Goldman Sachs Group Inc | 781.855 | 449,05 | 7.764 | 721,48 | ||||
| 2026-02-11 | 13F | Cerity Partners LLC | 22.439 | -4,88 | 223 | 42,31 | ||||
| 2026-01-23 | 13F | Farther Finance Advisors, LLC | 57 | 1 | ||||||
| 2026-02-11 | 13F | Deutsche Bank Ag\ | 57.166 | 135,04 | 568 | 252,17 | ||||
| 2026-02-10 | 13F | Bnp Paribas Arbitrage, Sa | 257.417 | 737,76 | 2.556 | 1.152,94 | ||||
| 2026-01-08 | 13F | Wealth Enhancement Advisory Services, Llc | 14.330 | 0,60 | 136 | 15,25 | ||||
| 2026-02-17 | 13F | Suvretta Capital Management, Llc | 1.250.000 | 12.412 | ||||||
| 2026-02-13 | 13F | Rhumbline Advisers | 69.369 | 118,39 | 689 | 227,62 | ||||
| 2026-02-13 | 13F | JustInvest LLC | 16.436 | -0,96 | 163 | 48,18 | ||||
| 2026-01-21 | 13F | Palumbo Wealth Management LLC | 0 | -100,00 | 0 | |||||
| 2026-02-11 | 13F | Ameritas Investment Partners, Inc. | 5.121 | 51 | ||||||
| 2025-11-13 | 13F | Quadrature Capital Ltd | 0 | -100,00 | 0 | -100,00 | ||||
| 2026-02-06 | 13F | Pnc Financial Services Group, Inc. | 487 | -27,64 | 5 | 0,00 | ||||
| 2026-01-15 | 13F | Nisa Investment Advisors, Llc | 2.765 | 0,00 | 27 | 50,00 | ||||
| 2026-02-09 | 13F | Geode Capital Management, Llc | 1.445.887 | 100,29 | 14.361 | 199,56 | ||||
| 2026-02-10 | 13F | Daiwa Securities Group Inc. | 243 | 0 | ||||||
| 2026-01-26 | 13F | Cwm, Llc | 18.953 | 0,47 | 0 | |||||
| 2026-02-13 | 13F | Manufacturers Life Insurance Company, The | 19.147 | 190 | ||||||
| 2026-02-23 | 13F | Virtu Financial LLC | 0 | -100,00 | 0 | |||||
| 2026-01-29 | 13F | UBS Group AG | 281.083 | 12,47 | 2.791 | 68,23 | ||||
| 2025-09-25 | NP | DFAT - Dimensional U.S. Targeted Value ETF | 16.428 | 78 | ||||||
| 2025-09-25 | NP | DFSCX - U.s. Micro Cap Portfolio - Institutional Class This fund is a listed as child fund of Dimensional Fund Advisors Lp and if that institution has disclosed ownership in this security, then these positions will not be double counted when calculating total shares and total value | 14.523 | 69 | ||||||
| 2026-02-17 | 13F | Alliancebernstein L.p. | 61.810 | 110,45 | 614 | 214,36 | ||||
| 2026-02-17 | 13F | Boothbay Fund Management, Llc | 136.377 | -24,55 | 1.354 | 12,83 | ||||
| 2026-02-09 | 13F | Quest Partners LLC | 11.726 | 116 | ||||||
| 2026-02-13 | 13F | Spruce Street Capital LP | 175.000 | 1.738 | ||||||
| 2025-09-24 | NP | PJARX - SmallCap Value Fund II R-3 | 1.329 | 1.445,35 | 6 | |||||
| 2026-02-13 | 13F | Frazier Life Sciences Management, L.P. | 4.424.725 | 0,00 | 43.938 | 49,55 | ||||
| 2026-02-17 | 13F | Orbimed Advisors Llc | 2.125.000 | 21.101 | ||||||
| 2026-02-12 | 13F | Dimensional Fund Advisors Lp | 862.892 | -5,44 | 8.568 | 41,39 | ||||
| 2026-02-13 | 13F | Pale Fire Capital SE | 22.302 | -33,72 | 221 | -0,90 | ||||
| 2026-02-17 | 13F | D. E. Shaw & Co., Inc. | 480.205 | 3.646,33 | 4.768 | 5.509,41 | ||||
| 2026-02-17 | 13F | Octagon Capital Advisors LP | 1.725.000 | 17.129 | ||||||
| 2026-02-12 | 13F | BRYN MAWR TRUST Co | 0 | -100,00 | 0 | -100,00 | ||||
| 2026-02-10 | 13F | Axq Capital, Lp | 0 | -100,00 | 0 | |||||
| 2026-02-17 | 13F | Optiver Holding B.V. | 312 | 0,00 | 3 | 50,00 | ||||
| 2026-02-06 | 13F | Profund Advisors Llc | 38.054 | 378 | ||||||
| 2026-02-05 | 13F | Allworth Financial LP | 3.386 | 1.002,93 | 34 | 1.550,00 | ||||
| 2026-02-17 | 13F | Qube Research & Technologies Ltd | 133.257 | 1.323 | ||||||
| 2026-02-11 | 13F | Winton Capital Group Ltd | 26.900 | 267 | ||||||
| 2025-09-26 | NP | FSSNX - Fidelity Small Cap Index Fund This fund is a listed as child fund of Fmr Llc and if that institution has disclosed ownership in this security, then these positions will not be double counted when calculating total shares and total value | 240.360 | -1,83 | 1.137 | 18,09 | ||||
| 2026-02-13 | 13F | Squarepoint Ops LLC | 92.608 | 920 | ||||||
| 2026-02-17 | 13F | ExodusPoint Capital Management, LP | 0 | -100,00 | 0 | -100,00 | ||||
| 2026-02-17 | 13F | Brevan Howard Capital Management LP | 0 | -100,00 | 0 | |||||
| 2026-02-12 | 13F | Commonwealth Equity Services, Llc | 11.234 | 3,16 | 112 | |||||
| 2025-09-24 | NP | BLACKROCK FUNDS - iShares Russell Small/Mid-Cap Index Fund Investor A | 2.923 | 0,00 | 14 | 18,18 | ||||
| 2025-09-24 | NP | SWSSX - Schwab Small-Cap Index Fund This fund is a listed as child fund of Charles Schwab Investment Management Inc and if that institution has disclosed ownership in this security, then these positions will not be double counted when calculating total shares and total value | 64.220 | 14,32 | 304 | 37,73 | ||||
| 2026-02-17 | 13F | ADAR1 Capital Management, LLC | 1.393.161 | -9,06 | 13.834 | 36,00 | ||||
| 2026-01-08 | 13F | True Wealth Design, LLC | 226 | 0,00 | 2 | 100,00 | ||||
| 2026-02-13 | 13F | Nantahala Capital Management, LLC | 1.000.000 | 9.930 | ||||||
| 2026-02-13 | 13F | State Street Corp | 3.187.722 | 485,07 | 31.654 | 775,15 | ||||
| 2025-09-25 | NP | DFFVX - U.S. Targeted Value Portfolio - Institutional Class This fund is a listed as child fund of Dimensional Fund Advisors Lp and if that institution has disclosed ownership in this security, then these positions will not be double counted when calculating total shares and total value | 16.072 | 76 | ||||||
| 2026-02-13 | 13F | OMERS ADMINISTRATION Corp | 20.900 | 208 | ||||||
| 2026-02-17 | 13F | Bridgeway Capital Management Inc | 13.400 | -72,31 | 133 | -58,57 | ||||
| 2026-02-17 | 13F | 683 Capital Management, LLC | 1.120.000 | 21,39 | 11.122 | 81,54 | ||||
| 2026-02-17 | 13F | DAFNA Capital Management LLC | 340.859 | -4,81 | 3.385 | 42,36 | ||||
| 2026-01-30 | 13F | Torren Management, LLC | 321 | 3 | ||||||
| 2026-02-17 | 13F | Perceptive Advisors Llc | 139.835 | 0,00 | 1.389 | 49,57 | ||||
| 2025-09-26 | NP | SLPIX - Small-cap Profund Investor Class | 21 | -8,70 | 0 | |||||
| 2026-02-17 | 13F | Wellington Management Group Llp | 83.230 | 826 | ||||||
| 2025-11-14 | 13F | Cubist Systematic Strategies, LLC | 2.506 | 17 | ||||||
| 2026-02-17 | 13F | Russell Investments Group, Ltd. | 5.872 | 160,17 | 58 | 314,29 | ||||
| 2026-02-10 | 13F | Acadian Asset Management Llc | 50.909 | 1 | ||||||
| 2026-02-09 | 13F | Hartland & Co., LLC | 4 | -98,68 | 0 | -100,00 | ||||
| 2026-02-03 | 13F | Privium Fund Management B.V. | 192.550 | 0,10 | 1.912 | 49,73 | ||||
| 2026-02-13 | 13F | Charles Schwab Investment Management Inc | 192.210 | 81,74 | 1.909 | 171,79 | ||||
| 2025-09-17 | NP | GMRAX - Nationwide Small Cap Index Fund Class A | 2.138 | 0,00 | 10 | 25,00 | ||||
| 2026-02-13 | 13F | Caxton Corp | 13.943 | -19,55 | 138 | 20,00 | ||||
| 2026-01-12 | 13F | Rialto Wealth Management, LLC | 53 | 1 | ||||||
| 2026-02-12 | 13F | Steward Partners Investment Advisory, Llc | 100 | 0,00 | 1 | |||||
| 2026-02-13 | 13F | Siren, L.L.C. | 720.622 | 19,42 | 7.156 | 78,61 | ||||
| 2026-02-03 | 13F | Ethic Inc. | 11.449 | 1,15 | 114 | 50,67 | ||||
| 2026-02-10 | 13F | Bank of New York Mellon Corp | 166.749 | 132,64 | 1.656 | 248,42 | ||||
| 2026-02-17 | 13F | Tower Research Capital LLC (TRC) | 826 | -77,90 | 8 | -66,67 | ||||
| 2026-02-17 | 13F | D1 Capital Partners L.P. | 0 | -100,00 | 0 | |||||
| 2026-02-12 | 13F | Voya Investment Management Llc | 10.976 | 109 | ||||||
| 2026-02-17 | 13F | Graham Capital Management, L.P. | 32.898 | 327 | ||||||
| 2026-02-12 | 13F | New York State Common Retirement Fund | 19.887 | 374,97 | 197 | 629,63 | ||||
| 2026-02-12 | 13F | BlackRock, Inc. | 4.907.563 | 126,04 | 48.732 | 238,04 | ||||
| 2026-02-10 | 13F | Savant Capital, LLC | 0 | -100,00 | 0 | |||||
| 2026-02-17 | 13F | Aquatic Capital Management LLC | 1.085 | 11 | ||||||
| 2025-09-26 | NP | TISBX - TIAA-CREF Small-Cap Blend Index Fund Institutional Class | 31.235 | 0,00 | 148 | 20,49 | ||||
| 2026-02-05 | 13F | Amalgamated Bank | 1.982 | 218,14 | 0 | |||||
| 2026-02-17 | 13F | Virtus Investment Advisers, Inc. | 27.230 | 270 | ||||||
| 2025-09-29 | NP | RSSL - Global X Russell 2000 ETF | 12.493 | -12,25 | 59 | 7,27 | ||||
| 2026-02-20 | 13F | Sunbelt Securities, Inc. | 16 | 0,00 | 0 | |||||
| 2026-02-17 | 13F | Fmr Llc | 13.388 | -0,33 | 133 | 48,31 | ||||
| 2026-03-03 | 13F/A | Caitong International Asset Management Co., Ltd | 3.714 | 37 | ||||||
| 2026-02-17 | 13F | Northern Trust Corp | 457.052 | 93,30 | 4.539 | 189,04 | ||||
| 2026-02-17 | 13F | Avoro Capital Advisors LLC | 3.300.000 | 32.769 | ||||||
| 2026-02-12 | 13F | Nuveen, LLC | 211.529 | 539,02 | 2.100 | 858,90 | ||||
| 2026-01-09 | 13F | SG Americas Securities, LLC | 18.640 | 0 | ||||||
| 2026-02-06 | 13F | IFP Advisors, Inc | 203 | 0,00 | 2 | 100,00 | ||||
| 2026-01-29 | 13F | China Universal Asset Management Co., Ltd. | 11.893 | 25,64 | 118 | 90,32 | ||||
| 2026-02-17 | 13F | Paradigm Biocapital Advisors LP | 4.763.198 | 47.299 | ||||||
| 2026-01-26 | 13F | Mirae Asset Global Investments Co., Ltd. | 3.547 | 69,88 | 35 | 169,23 | ||||
| 2026-01-15 | 13F | Fortitude Family Office, LLC | 124 | 0,00 | 1 | |||||
| 2026-02-13 | 13F | Wells Fargo & Company/mn | 70.736 | 267,23 | 702 | 452,76 | ||||
| 2026-02-17 | 13F | California State Teachers Retirement System | 3.884 | 123,73 | 39 | 245,45 | ||||
| 2026-02-11 | 13F | Group One Trading, L.p. | 1.816 | 18 | ||||||
| 2026-02-13 | 13F | Barclays Plc | 188.754 | 69,17 | 1.874 | 153,24 | ||||
| 2026-02-17 | 13F | MIRAE ASSET GLOBAL ETFS HOLDINGS Ltd. | 35.257 | 207,84 | 349 | 357,89 | ||||
| 2026-02-06 | 13F | Larson Financial Group LLC | 240 | 4.700,00 | 2 | |||||
| 2026-02-13 | 13F | Sterling Capital Management LLC | 3.636 | 109,81 | 36 | 227,27 | ||||
| 2026-02-11 | 13F | Jpmorgan Chase & Co | 29.861 | 107,96 | 297 | 211,58 | ||||
| 2026-02-13 | 13F | Affinity Asset Advisors, LLC | 3.200.000 | -17,32 | 31.776 | 23,64 | ||||
| 2026-02-17 | 13F | XTX Topco Ltd | 11.144 | -58,29 | 111 | -37,85 | ||||
| 2026-02-12 | 13F | MetLife Investment Management, LLC | 35.721 | 355 | ||||||
| 2026-02-14 | 13F | Rockefeller Capital Management L.P. | 700 | 250,00 | 7 | 500,00 | ||||
| 2026-02-17 | 13F | Citadel Advisors Llc | 3.774.317 | 1,49 | 37.479 | 51,77 |