Grundlæggende statistik
| Institutionelle aktier (lange) | 10.088.158 - 96,49% (ex 13D/G) - change of -3,89MM shares -27,80% MRQ |
| Institutionel værdi (lang) | $ 1.130.442 USD ($1000) |
Institutionelt ejerskab og aktionærer
Lindsay Corporation (US:LNN) har 237 institutionelle ejere og aktionærer, der har indsendt 13D/G- eller 13F-formularer til Securities Exchange Commission (SEC). Disse institutioner har i alt 10,088,158 aktier. Største aktionærer omfatter BlackRock, Inc., Vanguard Group Inc, Neuberger Berman Group LLC, State Street Corp, Dimensional Fund Advisors Lp, Westwood Holdings Group Inc, Jennison Associates Llc, Amundi, Geode Capital Management, Llc, and Royce & Associates Lp .
Lindsay Corporation (NYSE:LNN) institutionel ejerskabsstruktur viser aktuelle positioner i virksomheden efter institutioner og fonde, samt seneste ændringer i positionsstørrelse. Større aktionærer kan omfatte individuelle investorer, investeringsforeninger, hedgefonde eller institutioner. Skema 13D angiver, at investoren besidder (eller besidder) mere end 5 % af virksomheden og har til hensigt (eller har til hensigt at) aktivt at forfølge en ændring i forretningsstrategi. Skema 13G indikerer en passiv investering på over 5%.
The share price as of March 27, 2026 is 117,72 / share. Previously, on March 28, 2025, the share price was 126,71 / share. This represents a decline of 7,09% over that period.

Fondens stemningsscore
Fund Sentiment Score (fka Ownership Accumulation Score) finder de aktier, der bliver mest købt af fonde. Det er resultatet af en sofistikeret, multi-faktor kvantitativ model, der identificerer virksomheder med de højeste niveauer af institutionel akkumulering. Scoringsmodellen bruger en kombination af den samlede stigning i oplyste ejere, ændringerne i porteføljeallokeringer i disse ejere og andre målinger. Tallet går fra 0 til 100, hvor højere tal indikerer et højere niveau af akkumulering for sine jævnaldrende, og 50 er gennemsnittet.
Opdateringsfrekvens: Dagligt
Se Ownership Explorer, som giver en liste over højest rangerende virksomheder.
AI+ Ask Fintel’s AI assistant about Lindsay Corporation.
Select a question to share a public post with an AI-crafted answer.
Thinking of good questions…
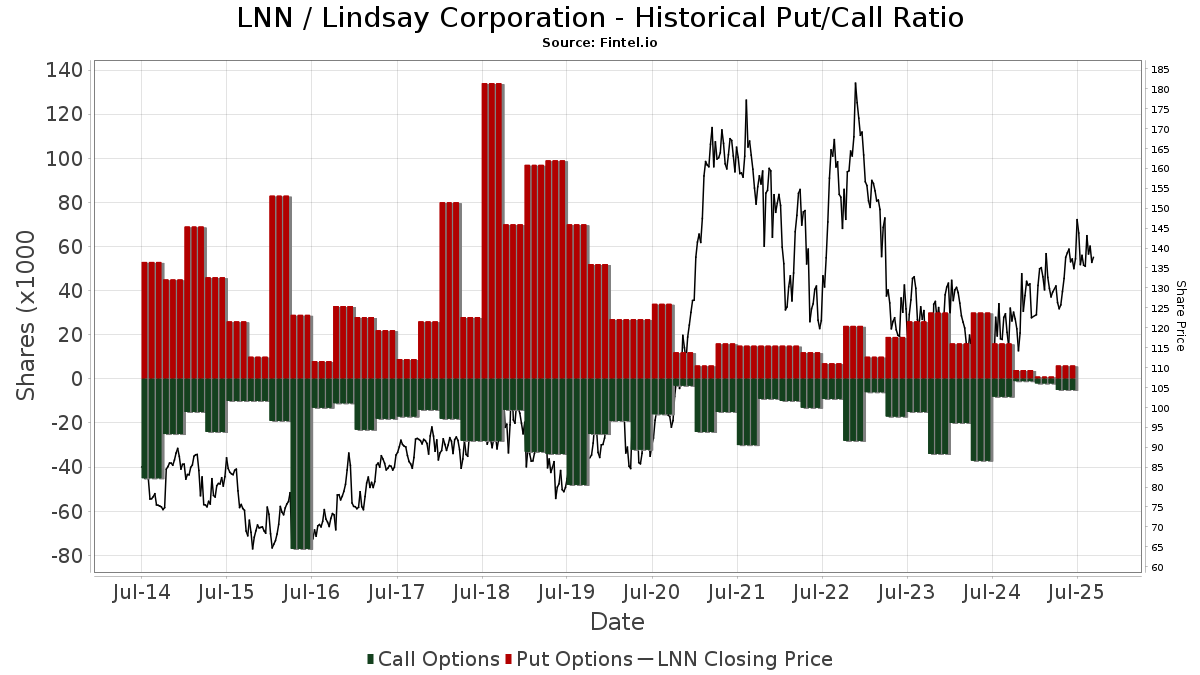
Institutionel Put/Call-forhold
Ud over at indberette standardaktie- og gældsudstedelser skal institutter med mere end 100 mill. aktiver under forvaltning også oplyse deres put- og call-optionsbeholdninger. Da salgsoptioner generelt indikerer negativ stemning, og købsoptioner indikerer positiv stemning, kan vi få en fornemmelse af den overordnede institutionelle stemning ved at plotte forholdet mellem put og kald. Diagrammet til højre viser det historiske put/call-forhold for dette instrument.
Brug af Put/Call Ratio som en indikator for investorernes stemning overvinder en af de vigtigste mangler ved at bruge totalt institutionelt ejerskab, som er, at en betydelig mængde af aktiver under forvaltning investeres passivt for at spore indekser. Passivt forvaltede fonde køber typisk ikke optioner, så indikatoren for put/call-forholdet følger mere nøje følelsen af aktivt forvaltede fonde.
13F og NPORT arkivering
Detaljer om 13F-arkivering er gratis. Detaljer om NP-ansøgninger kræver et premium-medlemskab. Grønne rækker angiver nye positioner. Røde rækker angiver lukkede positioner. Klik på linket ikon for at se den fulde transaktionshistorik.
Opgrader
for at låse premium-data op og eksportere til Excel ![]() .
.
| Fil dato | Kilde | Investor | Type | Gennemsnitlig pris (Øst) |
Aktier | Δ Aktier (%) |
Rapporteret Værdi ($1000) |
Δ Værdi (%) |
Port Alloc (%) |
|
|---|---|---|---|---|---|---|---|---|---|---|
| 2026-02-11 | 13F | Los Angeles Capital Management Llc | 58 | 6 | ||||||
| 2026-02-17 | 13F | Balyasny Asset Management Llc | 32.745 | 2.045,81 | 3.860 | 1.703,27 | ||||
| 2026-02-17 | 13F | Jones Financial Companies Lllp | 210 | -37,31 | 25 | -47,83 | ||||
| 2025-11-14 | 13F | Wolverine Trading, Llc | Put | 0 | -100,00 | 0 | -100,00 | |||
| 2026-02-13 | 13F | Sei Investments Co | 6.471 | 58,99 | 763 | 33,22 | ||||
| 2026-02-11 | 13F | Franklin Resources Inc | 6.667 | 0,03 | 786 | -16,13 | ||||
| 2026-02-17 | 13F | Susquehanna International Group, Llp | 0 | -100,00 | 0 | |||||
| 2026-02-17 | 13F | Millennium Management Llc | 3.438 | -61,77 | 405 | -67,93 | ||||
| 2026-02-13 | 13F | Citigroup Inc | 3.683 | -18,93 | 434 | -31,97 | ||||
| 2026-02-13 | 13F | Candriam Luxembourg S.C.A. | 18.512 | -28,97 | 2.182 | -40,43 | ||||
| 2026-02-17 | 13F | Canada Pension Plan Investment Board | 800 | -84,31 | 94 | -86,87 | ||||
| 2026-02-05 | 13F | Bank Julius Baer & Co. Ltd, Zurich | 0 | -100,00 | 0 | |||||
| 2026-02-06 | 13F | EverSource Wealth Advisors, LLC | 63 | 96,88 | 7 | 75,00 | ||||
| 2026-02-10 | 13F/A | Northwestern Mutual Wealth Management Co | 27 | 3 | ||||||
| 2026-02-13 | 13F | MAI Capital Management | 14 | 2 | ||||||
| 2026-01-26 | 13F | Private Trust Co Na | 1 | 0,00 | 0 | |||||
| 2026-02-05 | 13F | Stephens Investment Management Group LLC | 91.587 | -0,29 | 10.795 | -16,38 | ||||
| 2026-02-17 | 13F | Gotham Asset Management, LLC | 5.482 | -0,09 | 646 | -16,21 | ||||
| 2026-02-05 | 13F | Cambridge Investment Research Advisors, Inc. | 2.618 | 0,00 | 0 | |||||
| 2026-02-13 | 13F | Kennedy Capital Management, Inc. | 21.918 | 2.583 | ||||||
| 2026-01-29 | 13F | Pictet Asset Management Holding SA | 0 | -100,00 | 0 | |||||
| 2026-02-12 | 13F | Aristides Capital LLC | 0 | -100,00 | 0 | |||||
| 2026-02-04 | 13F | Ameritas Advisory Services, LLC | 0 | -100,00 | 0 | |||||
| 2026-02-10 | 13F | Intech Investment Management Llc | 6.419 | -2,71 | 757 | -18,45 | ||||
| 2026-02-13 | 13F | Stifel Financial Corp | 0 | -100,00 | 0 | |||||
| 2026-02-13 | 13F | Neuberger Berman Group LLC | 930.799 | -5,63 | 109.713 | -20,87 | ||||
| 2026-01-08 | 13F | Versant Capital Management, Inc | 268 | 764,52 | 32 | 675,00 | ||||
| 2026-02-17 | 13F | Janus Henderson Group Plc | 5.067 | 0,00 | 598 | -16,13 | ||||
| 2026-02-11 | 13F | Nuance Investments, Llc | 178.571 | 293,49 | 21.048 | 230,01 | ||||
| 2026-02-10 | 13F | Private Wealth Asset Management, LLC | 200 | 0,00 | 24 | -17,86 | ||||
| 2026-01-30 | 13F | Ares Financial Consulting, LLC | 8 | 1 | ||||||
| 2026-02-04 | 13F | Swiss Life Asset Management Ltd | 1.772 | 209 | ||||||
| 2026-02-09 | 13F | Geode Capital Management, Llc | 265.135 | 0,24 | 31.257 | -15,94 | ||||
| 2026-02-12 | 13F | Ankerstar Wealth, LLC | 1 | 0 | ||||||
| 2026-02-17 | 13F | Mangrove Partners | 0 | -100,00 | 0 | |||||
| 2026-01-12 | 13F | Canvas Wealth Advisors, LLC | 1.971 | 232 | ||||||
| 2026-02-11 | 13F | Cerity Partners LLC | 4.485 | 116,25 | 529 | 81,44 | ||||
| 2026-02-12 | 13F | Principal Securities, Inc. | 0 | -100,00 | 0 | |||||
| 2026-02-11 | 13F | Group One Trading, L.p. | Put | 3.200 | 377 | |||||
| 2026-02-13 | 13F | SRS Capital Advisors, Inc. | 723 | -39,75 | 85 | -49,40 | ||||
| 2026-02-17 | 13F | Advisor Group Holdings, Inc. | 305 | 4,10 | 36 | -12,50 | ||||
| 2025-09-29 | NP | KBIWX - KBI GLOBAL INVESTORS AQUARIUS FUND Institutional Shares | 1.874 | 0,00 | 256 | 5,81 | ||||
| 2026-02-13 | 13F | Lord, Abbett & Co. Llc | 0 | -100,00 | 0 | |||||
| 2026-02-05 | 13F | Atria Investments Llc | 2.726 | -15,99 | 321 | -29,61 | ||||
| 2026-02-17 | 13F | Ameriprise Financial Inc | 20.958 | -6,65 | 2.469 | -21,77 | ||||
| 2026-01-16 | 13F | Perigon Wealth Management, LLC | 2.170 | 256 | ||||||
| 2026-01-23 | 13F | Sumitomo Mitsui Trust Holdings, Inc. | 0 | -100,00 | 0 | |||||
| 2026-02-06 | 13F | HighTower Advisors, LLC | 72.392 | 1,06 | 8.533 | -15,26 | ||||
| 2026-02-17 | 13F | Westwood Holdings Group Inc | 315.353 | 37.171 | ||||||
| 2026-02-13 | 13F | Schroder Investment Management Group | 10.312 | 1.226 | ||||||
| 2026-02-10 | 13F | Bnp Paribas Arbitrage, Sa | 3.270 | -75,91 | 385 | -79,82 | ||||
| 2026-02-03 | 13F | Farmers & Merchants Investments Inc | 8 | 0,00 | 1 | -100,00 | ||||
| 2026-02-10 | 13F | Rothschild Investment Llc | 14 | -6,67 | 2 | -50,00 | ||||
| 2025-11-14 | 13F | Dark Forest Capital Management Lp | 6.565 | 0,00 | 947 | 0,00 | ||||
| 2026-02-09 | 13F | Atlantic Trust, LLC | 0 | -100,00 | 0 | |||||
| 2026-02-17 | 13F | Qube Research & Technologies Ltd | 44.629 | -30,08 | 5.260 | -41,37 | ||||
| 2026-02-10 | 13F | Goldman Sachs Group Inc | 41.295 | -23,79 | 4.867 | -36,10 | ||||
| 2026-02-11 | 13F | Manchester Capital Management LLC | 200 | 24 | ||||||
| 2025-10-10 | 13F | USA Financial Portformulas Corp | 0 | -100,00 | 0 | -100,00 | ||||
| 2026-02-05 | 13F | John G Ullman & Associates Inc | 82.300 | 41,96 | 9.701 | 19,05 | ||||
| 2026-02-17 | 13F | T. Rowe Price Investment Management, Inc. | 163.088 | -26,48 | 19 | -38,71 | ||||
| 2026-02-05 | 13F | Bessemer Group Inc | 41 | -53,41 | 0 | |||||
| 2026-02-09 | 13F | Annis Gardner Whiting Capital Advisors, LLC | 0 | -100,00 | 0 | |||||
| 2026-01-27 | 13F | Round Rock Advisors, LLC | 0 | -100,00 | 0 | |||||
| 2026-02-06 | 13F | ProShare Advisors LLC | 51.927 | 12,12 | 6.121 | -5,98 | ||||
| 2026-01-28 | 13F | Klp Kapitalforvaltning As | 5.600 | -5,08 | 660 | -20,39 | ||||
| 2026-02-13 | 13F | Wexford Capital Lp | 287 | 11,67 | 34 | -8,33 | ||||
| 2025-09-29 | NP | RSSL - Global X Russell 2000 ETF | 5.543 | -15,87 | 757 | -11,06 | ||||
| 2026-01-23 | 13F | Farther Finance Advisors, LLC | 215 | 24,28 | 25 | 4,17 | ||||
| 2026-01-20 | 13F | Harbor Capital Advisors, Inc. | 48 | -2,04 | 0 | |||||
| 2025-10-31 | 13F | Mutual Of America Capital Management Llc | 0 | -100,00 | 0 | -100,00 | ||||
| 2026-03-06 | 13F | Hsbc Holdings Plc | 6.557 | 778 | ||||||
| 2026-02-11 | 13F | O'shaughnessy Asset Management, Llc | 0 | -100,00 | 0 | |||||
| 2026-02-12 | 13F | EntryPoint Capital, LLC | 6.090 | 718 | ||||||
| 2026-02-17 | 13F | Man Group plc | 2.439 | -74,55 | 287 | -78,68 | ||||
| 2025-09-29 | NP | CRSSX - CATHOLIC RESPONSIBLE INVESTMENTS SMALL-CAP FUND Institutional Shares | 4.818 | -1,41 | 658 | 4,29 | ||||
| 2026-01-09 | 13F | Diversified Trust Co | 1.990 | 14,17 | 235 | -4,10 | ||||
| 2026-02-17 | 13F | Citadel Advisors Llc | Put | 3.200 | 52,38 | 377 | 27,80 | |||
| 2026-02-17 | 13F | Sandler Capital Management | 0 | -100,00 | 0 | |||||
| 2026-01-23 | 13F | State of Alaska, Department of Revenue | 10.169 | 67,58 | 1 | |||||
| 2026-02-17 | 13F | Trexquant Investment LP | 7.694 | 907 | ||||||
| 2026-02-17 | 13F | Citadel Advisors Llc | 29.884 | 3.522 | ||||||
| 2026-02-17 | 13F | Price T Rowe Associates Inc /md/ | 10.108 | 17,91 | 1 | 0,00 | ||||
| 2026-01-08 | 13F | Tompkins Financial Corp | 600 | 0,00 | 71 | -16,67 | ||||
| 2026-02-10 | 13F | Welch & Forbes Llc | 0 | -100,00 | 0 | |||||
| 2026-02-13 | 13F | Corient IA LLC | 3.000 | 0,00 | 354 | -16,15 | ||||
| 2025-11-14 | 13F/A | Skopos Labs, Inc. | 0 | -100,00 | 0 | |||||
| 2026-02-09 | 13F | Hartland & Co., LLC | 0 | -100,00 | 0 | |||||
| 2026-02-17 | 13F | Wellington Management Group Llp | 118.722 | 13.994 | ||||||
| 2026-02-02 | 13F | Horizon Investments, LLC | 5.224 | 616 | ||||||
| 2026-02-04 | 13F | Pacer Advisors, Inc. | 0 | -100,00 | 0 | -100,00 | ||||
| 2026-02-06 | 13F | Banque Cantonale Vaudoise | 156 | 0,00 | 18 | |||||
| 2026-02-13 | 13F | State Street Corp | 439.131 | -7,12 | 51.760 | -22,11 | ||||
| 2025-11-14 | 13F | Corton Capital Inc. | 0 | -100,00 | 0 | -100,00 | ||||
| 2026-01-26 | 13F | Cwm, Llc | 1.384 | -40,91 | 0 | |||||
| 2026-02-12 | 13F | Hrt Financial Lp | 0 | -100,00 | 0 | |||||
| 2026-02-04 | 13F | Oregon Public Employees Retirement Fund | 2.473 | 0,00 | 291 | -16,14 | ||||
| 2026-02-17 | 13F | Polymer Capital Management (US) LLC | 0 | -100,00 | 0 | |||||
| 2025-11-12 | 13F | Simplex Trading, Llc | Put | 0 | -100,00 | 0 | ||||
| 2025-09-29 | NP | PRFZ - Invesco FTSE RAFI US 1500 Small-Mid ETF This fund is a listed as child fund of Invesco Ltd. and if that institution has disclosed ownership in this security, then these positions will not be double counted when calculating total shares and total value | 11.041 | 9,76 | 1.507 | 16,10 | ||||
| 2026-02-11 | 13F | Heartland Advisors Inc | 0 | -100,00 | 0 | |||||
| 2026-02-10 | 13F | REAP Financial Group, LLC | 50 | 0,00 | 6 | -28,57 | ||||
| 2026-01-29 | 13F | Copeland Capital Management, LLC | 522 | 62 | ||||||
| 2025-11-14 | 13F | Tudor Investment Corp Et Al | 0 | -100,00 | 0 | |||||
| 2026-02-06 | 13F | Creative Financial Designs Inc /adv | 0 | -100,00 | 0 | |||||
| 2026-02-13 | 13F | Mariner, LLC | 11.172 | 300,72 | 1.317 | 236,83 | ||||
| 2026-02-13 | 13F | BNP Paribas Asset Management Holding S.A. | 223 | 38,51 | 0 | |||||
| 2025-11-14 | 13F | Hotchkis & Wiley Capital Management Llc | 0 | -100,00 | 0 | -100,00 | ||||
| 2026-02-10 | 13F | Allred Capital Management, LLC | 2.970 | -1,20 | 350 | -17,06 | ||||
| 2026-02-12 | 13F | Advisors Asset Management, Inc. | 2.976 | 7,83 | 351 | -9,56 | ||||
| 2026-02-17 | 13F | Fmr Llc | 892 | -27,66 | 105 | -39,31 | ||||
| 2026-02-09 | 13F | Harbour Investments, Inc. | 17 | 2 | ||||||
| 2026-02-09 | 13F | Prairie Wealth Advisors, Inc. | 0 | -100,00 | 45.234 | -16,15 | ||||
| 2026-02-09 | 13F | Hantz Financial Services, Inc. | 168 | 124,00 | 0 | |||||
| 2026-01-08 | 13F | True Wealth Design, LLC | 9 | 125,00 | 1 | |||||
| 2026-02-17 | 13F | Northern Trust Corp | 108.140 | -6,37 | 12.746 | -21,49 | ||||
| 2026-02-17 | 13F | CWM Advisors, LLC | 4.015 | 22,26 | 473 | 2,60 | ||||
| 2026-02-10 | 13F | Hillsdale Investment Management Inc. | 0 | -100,00 | 0 | |||||
| 2026-02-17 | 13F | Susquehanna International Group, Llp | Put | 2.300 | 43,75 | 271 | 20,98 | |||
| 2026-02-17 | 13F | Susquehanna International Group, Llp | Call | 2.300 | 35,29 | 271 | 13,87 | |||
| 2026-02-17 | 13F | Maryland State Retirement & Pension System | 0 | -100,00 | 0 | -100,00 | ||||
| 2026-02-09 | 13F | Huntington National Bank | 23 | 1.050,00 | 3 | |||||
| 2026-02-13 | 13F | Parkside Financial Bank & Trust | 24 | 41,18 | 3 | 0,00 | ||||
| 2026-01-09 | 13F | SG Americas Securities, LLC | 17.354 | 5,06 | 2 | 0,00 | ||||
| 2026-02-17 | 13F | Advisory Services Network, LLC | 0 | -100,00 | 0 | |||||
| 2026-02-12 | 13F | Swiss National Bank | 21.400 | 1,90 | 2.522 | -14,54 | ||||
| 2026-02-17 | 13F | Bank Of America Corp /de/ | 31.616 | -2,33 | 3.727 | -18,09 | ||||
| 2026-02-12 | 13F | Skandinaviska Enskilda Banken AB (publ) | 0 | -100,00 | 0 | |||||
| 2026-02-12 | 13F | UniSuper Management Pty Ltd | 0 | -100,00 | 0 | |||||
| 2025-11-21 | 13F | Nebula Research & Development LLC | 0 | -100,00 | 0 | |||||
| 2026-02-17 | 13F | Amundi | 269.817 | 39,42 | 31.843 | 16,97 | ||||
| 2026-02-06 | 13F | Tortoise Investment Management, LLC | 0 | -100,00 | 0 | |||||
| 2026-02-13 | 13F | Pinnacle Wealth Planning Services, Inc. | 57 | 7 | ||||||
| 2026-01-20 | 13F | Signaturefd, Llc | 5 | -37,50 | 1 | -100,00 | ||||
| 2026-02-13 | 13F | Squarepoint Ops LLC | 0 | -100,00 | 0 | |||||
| 2026-01-30 | 13F | NJ State Employees Deferred Compensation Plan | 0 | -100,00 | 0 | -100,00 | ||||
| 2025-11-14 | 13F | Centiva Capital, LP | 0 | -100,00 | 0 | -100,00 | ||||
| 2026-01-29 | 13F | Comerica Bank | 2.849 | -12,95 | 336 | -27,17 | ||||
| 2025-11-13 | 13F | Blueshift Asset Management, LLC | 0 | -100,00 | 0 | -100,00 | ||||
| 2026-02-13 | 13F | Manufacturers Life Insurance Company, The | 0 | -100,00 | 0 | |||||
| 2026-02-13 | 13F | Prudential Financial Inc | 10.161 | -34,03 | 1.198 | -44,71 | ||||
| 2026-02-19 | 13F | CI Private Wealth, LLC | 8.854 | 106,82 | 1.044 | 73,54 | ||||
| 2026-02-12 | 13F | MetLife Investment Management, LLC | 6.104 | -6,03 | 719 | -21,25 | ||||
| 2026-02-02 | 13F | Fifth Third Bancorp | 37 | 105,56 | 4 | 100,00 | ||||
| 2026-02-03 | 13F | SBI Securities Co., Ltd. | 3 | 0,00 | 0 | |||||
| 2026-02-05 | 13F | Gamco Investors, Inc. Et Al | 54.000 | -0,92 | 6.365 | -16,92 | ||||
| 2026-02-17 | 13F | Aster Capital Management (DIFC) Ltd | 212 | 25 | ||||||
| 2025-11-04 | 13F | Gitterman Wealth Management, LLC | 2.485 | 38,67 | 349 | 35,27 | ||||
| 2026-02-13 | 13F | Barclays Plc | 20.647 | 5,30 | 2.434 | -0,41 | ||||
| 2025-10-30 | 13F | Twin Peaks Wealth Advisors, LLC | 0 | -100,00 | 0 | |||||
| 2026-01-29 | 13F | Vanguard Group Inc | 1.228.314 | -2,41 | 144.781 | -18,17 | ||||
| 2026-02-12 | 13F | CIBC Private Wealth Group, LLC | 2 | 0 | ||||||
| 2025-11-13 | 13F | Norges Bank | 0 | -100,00 | 0 | |||||
| 2026-01-12 | 13F | Abound Wealth Management | 1 | 0,00 | 0 | |||||
| 2026-02-13 | 13F | American Century Companies Inc | 161.728 | 22,16 | 19.063 | 2,43 | ||||
| 2026-02-12 | 13F | Renaissance Technologies Llc | 16.100 | -74,81 | 1.898 | -78,89 | ||||
| 2026-02-13 | 13F | Charles Schwab Investment Management Inc | 131.636 | -5,73 | 15.516 | -20,95 | ||||
| 2026-02-11 | 13F | Weik Capital Management | 3.000 | 0,00 | 354 | -16,15 | ||||
| 2026-02-17 | 13F | Aquatic Capital Management LLC | 0 | -100,00 | 0 | |||||
| 2026-02-12 | 13F | Steward Partners Investment Advisory, Llc | 10 | 0,00 | 1 | 0,00 | ||||
| 2025-09-29 | NP | PHO - Invesco Water Resources ETF This fund is a listed as child fund of Invesco Ltd. and if that institution has disclosed ownership in this security, then these positions will not be double counted when calculating total shares and total value | 71.338 | -1,89 | 9.738 | 3,77 | ||||
| 2026-02-13 | 13F | Smartleaf Asset Management LLC | 65 | -5,80 | 8 | -22,22 | ||||
| 2026-02-17 | 13F | Aqr Capital Management Llc | 33.033 | 3,15 | 3.894 | -13,51 | ||||
| 2026-02-12 | 13F | Davy Global Fund Management Ltd | 12.827 | -10,76 | 1.512 | -25,20 | ||||
| 2026-02-17 | 13F | Cresset Asset Management, LLC | 5.428 | -2,22 | 640 | -18,08 | ||||
| 2025-11-04 | 13F | Cornerstone Planning Group LLC | 0 | -100,00 | 0 | |||||
| 2026-02-13 | 13F | Public Employees Retirement Association Of Colorado | 1.953 | 0,00 | 0 | |||||
| 2026-02-12 | 13F | Voya Investment Management Llc | 1.918 | -3,86 | 226 | -19,29 | ||||
| 2026-01-30 | 13F | Jennison Associates Llc | 296.017 | -39,44 | 34.892 | -49,21 | ||||
| 2026-02-13 | 13F | Marshall Wace, Llp | 20.192 | 2.380 | ||||||
| 2026-01-09 | 13F | Assenagon Asset Management S.A. | 9.806 | 312,19 | 1.156 | 245,81 | ||||
| 2026-01-14 | 13F | Chatham Capital Group, Inc. | 12.440 | 1,39 | 1.466 | -14,97 | ||||
| 2026-02-13 | 13F | Caitong International Asset Management Co., Ltd | 0 | -100,00 | 0 | |||||
| 2026-02-12 | 13F | Jane Street Group, Llc | 0 | -100,00 | 0 | |||||
| 2026-02-13 | 13F | Panagora Asset Management Inc | 36.062 | 3,72 | 4.251 | -13,03 | ||||
| 2026-01-05 | 13F | GAMMA Investing LLC | 136 | -65,74 | 16 | -70,91 | ||||
| 2026-02-17 | 13F | Public Employees Retirement System Of Ohio | 11.357 | 7.841,96 | 1.339 | 6.590,00 | ||||
| 2025-09-29 | NP | SMDX - Intech S&P Small-Mid Cap Diversified Alpha ETF | 252 | 196,47 | 34 | 240,00 | ||||
| 2026-01-14 | 13F | Exchange Traded Concepts, Llc | 1.400 | -61,50 | 165 | -67,71 | ||||
| 2025-09-29 | NP | KCXIX - Knights of Columbus U.S. All Cap Index Fund I Shares | 48 | 6,67 | 7 | 20,00 | ||||
| 2025-09-29 | NP | CGW - Invesco S&P Global Water Index ETF This fund is a listed as child fund of Invesco Ltd. and if that institution has disclosed ownership in this security, then these positions will not be double counted when calculating total shares and total value | 39.282 | -4,17 | 5.362 | 1,36 | ||||
| 2026-02-17 | 13F | Freestone Grove Partners LP | 10.424 | 1.229 | ||||||
| 2025-09-29 | NP | CAFG - Pacer US Small Cap Cash Cows Growth Leaders ETF | 1.816 | 200,17 | 248 | 225,00 | ||||
| 2026-02-13 | 13F | Ieq Capital, Llc | 3.014 | 26,69 | 355 | 6,29 | ||||
| 2026-02-06 | 13F | Pnc Financial Services Group, Inc. | 2.926 | 0,17 | 345 | -16,10 | ||||
| 2026-02-13 | 13F | Evelyn Partners Investment Management LLP | 245 | 0,00 | 29 | -17,65 | ||||
| 2026-02-12 | 13F | Bank Of Montreal /can/ | 3.015 | 355 | ||||||
| 2026-02-17 | 13F | Mercer Global Advisors Inc /adv | 2.257 | 0,53 | 266 | -15,56 | ||||
| 2026-02-12 | 13F | Ensign Peak Advisors, Inc | 919 | -71,00 | 108 | -75,73 | ||||
| 2026-02-06 | 13F | Handelsbanken Fonder AB | 2.872 | 0,00 | 0 | |||||
| 2026-02-10 | 13F | Commonwealth Of Pennsylvania Public School Empls Retrmt Sys | 2.675 | -3,29 | 315 | -18,81 | ||||
| 2026-02-11 | 13F | Vestcor Inc | 1.076 | 0,00 | 0 | |||||
| 2026-02-17 | 13F | Quantinno Capital Management LP | 4.646 | 84,22 | 548 | 54,52 | ||||
| 2026-01-07 | 13F | Massmutual Trust Co Fsb/adv | 1.626 | -22,65 | 192 | -35,25 | ||||
| 2026-01-28 | 13F | Universal- Beteiligungs- und Servicegesellschaft mbH | 6.418 | -35,09 | 759 | -45,43 | ||||
| 2025-09-29 | NP | CFSSX - Column Small Cap Select Fund | 9.027 | 1,80 | 1.239 | 0,16 | ||||
| 2026-02-13 | 13F | First Trust Advisors Lp | 197.123 | 2,76 | 23.235 | -13,83 | ||||
| 2026-02-17 | 13F | California State Teachers Retirement System | 10.057 | -0,10 | 1.185 | -16,25 | ||||
| 2025-09-29 | NP | CFSLX - Column Small Cap Fund | 1.746 | 0,00 | 240 | -1,65 | ||||
| 2026-02-11 | 13F | Parallel Advisors, LLC | 24 | -47,83 | 3 | -66,67 | ||||
| 2026-02-12 | 13F | Raiffeisen Bank International AG | 24.341 | 0,00 | 2.893 | -15,11 | ||||
| 2026-01-27 | 13F | Zurcher Kantonalbank (Zurich Cantonalbank) | 2.600 | -95,08 | 306 | -95,88 | ||||
| 2026-02-06 | 13F | Covestor Ltd | 60 | 1,69 | 0 | |||||
| 2026-02-13 | 13F | Verition Fund Management LLC | 3.077 | -72,22 | 363 | -76,74 | ||||
| 2026-01-23 | 13F | Putney Financial Group LLC | 0 | -100,00 | 0 | |||||
| 2026-01-30 | 13F | Cardinal Capital Management | 17.258 | 1,51 | 2.034 | -14,86 | ||||
| 2025-11-06 | 13F | MQS Management LLC | 0 | -100,00 | 0 | -100,00 | ||||
| 2026-02-13 | 13F | Cullen Capital Management, LLC | 1.720 | 0,94 | 203 | -15,48 | ||||
| 2026-02-13 | 13F | Morgan Stanley | 143.207 | 15,31 | 16.880 | -3,31 | ||||
| 2026-02-13 | 13F | Nfj Investment Group, Llc | 0 | -100,00 | 0 | |||||
| 2025-11-14 | 13F | Texas Permanent School Fund | 0 | -100,00 | 0 | -100,00 | ||||
| 2026-02-11 | 13F | Inceptionr Llc | 0 | -100,00 | 0 | |||||
| 2026-02-13 | 13F | Rhumbline Advisers | 30.232 | -3,92 | 3.563 | -19,43 | ||||
| 2026-02-17 | 13F | Lazard Asset Management Llc | 34.827 | -13,91 | 4.105 | -27,81 | ||||
| 2026-02-05 | 13F | Gabelli Funds Llc | 30.000 | 0,00 | 3.536 | -16,13 | ||||
| 2026-02-18 | 13F | State of Tennessee, Treasury Department | 6.979 | 4,65 | 874 | -6,72 | ||||
| 2026-02-03 | 13F | Pier Capital, LLC | 0 | -100,00 | 0 | |||||
| 2026-02-17 | 13F | Royal Bank Of Canada | 5.210 | -83,11 | 614 | -85,84 | ||||
| 2026-01-29 | 13F | UBS Group AG | 126.745 | 43,44 | 14.939 | 20,29 | ||||
| 2025-11-14 | 13F | Larson Financial Group LLC | 0 | -100,00 | 0 | |||||
| 2026-01-30 | 13F | New York State Teachers Retirement System | 17.062 | -0,58 | 2 | 0,00 | ||||
| 2026-01-05 | 13F | Union Bancaire Privee, UBP SA | 0 | -100,00 | 0 | |||||
| 2026-02-09 | 13F | Royce & Associates Lp | 261.527 | -12,20 | 30.826 | -26,37 | ||||
| 2025-10-24 | 13F | Meeder Asset Management Inc | 0 | -100,00 | 0 | |||||
| 2026-02-17 | 13F | ISAM Funds (UK) Ltd | 0 | -100,00 | 0 | |||||
| 2026-02-17 | 13F | Alliancebernstein L.p. | 13.299 | 13,76 | 1.568 | -4,63 | ||||
| 2026-02-17 | 13F | Cetera Investment Advisers | 0 | -100,00 | 0 | |||||
| 2026-02-12 | 13F | Quadrant Capital Group Llc | 7 | -97,81 | 1 | -100,00 | ||||
| 2026-02-17 | 13F | Two Sigma Investments, Lp | 3.147 | -80,89 | 371 | -84,02 | ||||
| 2026-02-17 | 13F | Engineers Gate Manager LP | 5.606 | 131,84 | 661 | 94,69 | ||||
| 2026-01-23 | 13F | Baillie Gifford & Co | 137 | 16 | ||||||
| 2026-02-12 | 13F | DRW Securities, LLC | 0 | -100,00 | 0 | -100,00 | ||||
| 2026-01-29 | 13F | Teachers Retirement System Of The State Of Kentucky | 2.730 | -11,82 | 0 | |||||
| 2026-02-10 | 13F | State of Wyoming | 640 | -68,69 | 75 | -73,87 | ||||
| 2026-02-02 | 13F | Principal Financial Group Inc | 67.215 | 6,48 | 7.923 | -10,71 | ||||
| 2025-10-28 | 13F | Campbell & CO Investment Adviser LLC | 0 | -100,00 | 0 | |||||
| 2026-02-13 | 13F | Police & Firemen's Retirement System of New Jersey | 3.013 | 0,00 | 355 | -16,08 | ||||
| 2026-02-11 | 13F | Ameritas Investment Partners, Inc. | 911 | 107 | ||||||
| 2026-02-17 | 13F | D. E. Shaw & Co., Inc. | 11.623 | 0,00 | 1.370 | -16,11 | ||||
| 2026-02-12 | 13F | Dimensional Fund Advisors Lp | 345.596 | 2,54 | 40.736 | -14,01 | ||||
| 2026-02-10 | 13F | Envestnet Asset Management Inc | 2.122 | 250 | ||||||
| 2026-02-11 | 13F | Deutsche Bank Ag\ | 10.547 | 3,14 | 1.243 | -13,50 | ||||
| 2026-02-13 | 13F | Umb Bank N A/mo | 48 | -9,43 | 6 | -28,57 | ||||
| 2026-01-08 | 13F | Wealth Enhancement Advisory Services, Llc | 2.194 | 273 | ||||||
| 2026-02-13 | 13F | Great West Life Assurance Co /can/ | 9.397 | 0,74 | 1 | 0,00 | ||||
| 2026-02-06 | 13F | Global Retirement Partners, LLC | 925 | 0,00 | 109 | -16,28 | ||||
| 2026-01-21 | 13F | Yousif Capital Management, Llc | 2.945 | -12,82 | 362 | -23,63 | ||||
| 2026-02-11 | 13F | Simplex Trading, Llc | Call | 0 | -100,00 | 0 | ||||
| 2026-01-15 | 13F | Nisa Investment Advisors, Llc | 131 | -32,82 | 15 | -44,44 | ||||
| 2026-01-16 | 13F | Louisiana State Employees Retirement System | 4.900 | -2,00 | 578 | -17,81 | ||||
| 2026-02-13 | 13F | Quarry LP | 47 | 6 | ||||||
| 2026-02-13 | 13F | Kestra Advisory Services, LLC | 700 | 83 | ||||||
| 2026-02-12 | 13F | Nuveen, LLC | 29.414 | -2,19 | 3.467 | -17,98 | ||||
| 2026-02-17 | 13F | Blair William & Co/il | 2.072 | 244 | ||||||
| 2026-02-17 | 13F | Russell Investments Group, Ltd. | 935 | -1,99 | 110 | -17,91 | ||||
| 2026-02-11 | 13F | Jpmorgan Chase & Co | 39.739 | -60,25 | 4.684 | -66,67 | ||||
| 2026-02-17 | 13F | Creative Planning | 16.102 | 584,90 | 1.898 | 474,85 | ||||
| 2026-01-26 | 13F | KBC Group NV | 233.835 | -15,60 | 28 | -28,95 | ||||
| 2026-02-09 | 13F | Jackson Creek Investment Advisors LLC | 14.991 | 2 | ||||||
| 2026-02-11 | 13F | Illinois Municipal Retirement Fund | 5.558 | -2,30 | 655 | -18,02 | ||||
| 2026-02-11 | 13F | Winton Capital Group Ltd | 32.017 | 1.488,14 | 3.774 | 1.233,22 | ||||
| 2026-01-21 | 13F | SJS Investment Consulting Inc. | 4 | -42,86 | 0 | |||||
| 2026-01-23 | 13F | Ritholtz Wealth Management | 0 | -100,00 | 0 | |||||
| 2026-02-06 | 13F | IFP Advisors, Inc | 20 | 150,00 | 2 | 100,00 | ||||
| 2026-01-30 | 13F | Keybank National Association/oh | 4.839 | -19,13 | 570 | -32,22 | ||||
| 2026-02-13 | 13F | Van Eck Associates Corp | 1.945 | 11,85 | 0 | |||||
| 2026-02-11 | 13F | Gilpin Wealth Management, Llc | 1 | 0 | ||||||
| 2026-02-17 | 13F | Citadel Advisors Llc | Call | 0 | -100,00 | 0 | ||||
| 2025-11-14 | 13F | Sherbrooke Park Advisers Llc | 0 | -100,00 | 0 | |||||
| 2026-02-13 | 13F | Rodgers Brothers Inc. | 48.730 | 82,99 | 5.744 | 53,43 | ||||
| 2026-02-17 | 13F | Tower Research Capital LLC (TRC) | 677 | -60,41 | 80 | -67,08 | ||||
| 2026-02-13 | 13F | Aigen Investment Management, Lp | 0 | -100,00 | 0 | |||||
| 2026-02-10 | 13F | Acadian Asset Management Llc | 914 | -8,78 | 0 | |||||
| 2026-01-29 | 13F | Impax Asset Management Group plc | 62.768 | 0,00 | 7.398 | -16,14 | ||||
| 2026-02-12 | 13F | Wealthspire Advisors, LLC | 0 | -100,00 | 0 | |||||
| 2026-01-28 | 13F | Teacher Retirement System Of Texas | 8.840 | -1,85 | 1.042 | -17,77 | ||||
| 2026-02-09 | 13F | Quest Partners LLC | 10.076 | 81,88 | 1.188 | 52,57 | ||||
| 2025-09-29 | NP | SUNAMERICA SERIES TRUST - SA Small Cap Index Portfolio Class 1 | 1.240 | 0,73 | 169 | 6,96 | ||||
| 2026-02-05 | 13F | Allworth Financial LP | 9 | -55,00 | 1 | -50,00 | ||||
| 2026-02-13 | 13F | Ubs Asset Management Americas Inc | 30.902 | 2,16 | 3.642 | -14,33 | ||||
| 2025-11-17 | 13F | Jacobs Levy Equity Management, Inc | 0 | -100,00 | 0 | |||||
| 2026-02-17 | 13F | XTX Topco Ltd | 2.116 | 249 | ||||||
| 2026-01-30 | 13F | Us Bancorp \de\ | 107 | -57,71 | 13 | -65,71 | ||||
| 2026-02-17 | 13F | MIRAE ASSET GLOBAL ETFS HOLDINGS Ltd. | 8.282 | 63,48 | 976 | 37,08 | ||||
| 2026-01-21 | 13F | Sound Income Strategies, LLC | 10 | 1 | ||||||
| 2026-01-16 | 13F | Ronald Blue Trust, Inc. | 0 | -100,00 | 0 | |||||
| 2026-02-11 | 13F | Group One Trading, L.p. | Call | 0 | -100,00 | 0 | -100,00 | |||
| 2025-11-07 | 13F | Gsa Capital Partners Llp | 0 | -100,00 | 0 | |||||
| 2025-11-06 | 13F | Versor Investments LP | 0 | -100,00 | 0 | -100,00 | ||||
| 2026-02-05 | 13F | Amalgamated Bank | 3.157 | -1,47 | 0 | |||||
| 2026-02-03 | 13F | Mitsubishi UFJ Kokusai Asset Management Co., Ltd. | 24 | 0,00 | 3 | -33,33 | ||||
| 2026-02-17 | 13F | Quadrature Capital Ltd | 0 | -100,00 | 0 | |||||
| 2026-02-13 | 13F | Sterling Capital Management LLC | 73 | 170,37 | 9 | 166,67 | ||||
| 2026-02-13 | 13F | Wells Fargo & Company/mn | 12.178 | 75,83 | 1.435 | 47,48 | ||||
| 2026-02-09 | 13F | Legal & General Group Plc | 160.199 | 2,30 | 18.883 | -14,22 | ||||
| 2026-02-12 | 13F | BlackRock, Inc. | 1.773.532 | -0,37 | 209.046 | -16,45 | ||||
| 2026-02-13 | 13F | Public Sector Pension Investment Board | 0 | -100,00 | 0 | |||||
| 2026-02-17 | 13F | Raymond James Financial Inc | 5.124 | 79,73 | 604 | 50,75 | ||||
| 2025-10-31 | 13F | Y-Intercept (Hong Kong) Ltd | 0 | -100,00 | 0 | |||||
| 2025-10-17 | 13F | Fortitude Family Office, LLC | 0 | -100,00 | 0 | |||||
| 2026-02-10 | 13F | Bank of New York Mellon Corp | 94.877 | 2,61 | 11.183 | -13,95 | ||||
| 2026-02-14 | 13F | Rockefeller Capital Management L.P. | 96 | 118,18 | 11 | 83,33 | ||||
| 2026-02-02 | 13F | Strs Ohio | 4.200 | -26,32 | 495 | -38,20 | ||||
| 2026-02-19 | 13F | Invesco Ltd. | 226.796 | 10,10 | 26.732 | -7,67 | ||||
| 2026-02-06 | 13F | Leonteq Securities AG | 54 | -74,41 | 6 | -79,31 | ||||
| 2025-11-14 | 13F | Cubist Systematic Strategies, LLC | 0 | -100,00 | 0 | |||||
| 2026-02-11 | 13F | LPL Financial LLC | 2.059 | -19,88 | 243 | -32,96 | ||||
| 2026-02-12 | 13F | New York State Common Retirement Fund | 4.285 | 0,00 | 505 | -16,11 | ||||
| 2026-01-23 | 13F | Robeco Institutional Asset Management B.V. | 2.479 | 0,00 | 292 | -16,09 | ||||
| 2026-02-13 | 13F | Victory Capital Management Inc | 0 | -100,00 | 0 | |||||
| 2026-02-17 | 13F | Quantedge Capital Pte Ltd | 0 | -100,00 | 0 | |||||
| 2026-02-11 | 13F | Cedar Mountain Advisors, LLC | 2 | 0 | ||||||
| 2026-02-05 | 13F | Thrivent Financial For Lutherans | 7.424 | -5,26 | 1 | -100,00 | ||||
| 2026-02-17 | 13F | Banco Bilbao Vizcaya Argentaria, S.a. | 0 | -100,00 | 0 | |||||
| 2026-02-17 | 13F | Credit Agricole S A | 11.270 | -44,16 | 1.328 | -53,17 | ||||
| 2026-02-11 | 13F | Janney Montgomery Scott LLC | 2.173 | -25,43 | 0 | |||||
| 2026-01-26 | 13F | Lightrock Netherlands B.V. | 132.415 | 5,16 | 15.608 | 3,62 | ||||
| 2026-01-28 | 13F | Arizona State Retirement System | 3.037 | -5,54 | 358 | -20,84 | ||||
| 2026-02-13 | 13F | Seneschal Advisors, LLC | 28 | 0,00 | 3 | 0,00 | ||||
| 2026-01-28 | 13F | Salomon & Ludwin, LLC | 103 | -31,33 | 12 | -42,86 |
Other Listings
| DE:LMF | 102,70 € |