Grundlæggende statistik
| Institutionelle aktier (lange) | 53.472.710 - 83,78% (ex 13D/G) - change of 36,93MM shares 223,31% MRQ |
| Institutionel værdi (lang) | $ 3.973.969 USD ($1000) |
Institutionelt ejerskab og aktionærer
Liberty Live Holdings, Inc. (US:LLYVK) har 259 institutionelle ejere og aktionærer, der har indsendt 13D/G- eller 13F-formularer til Securities Exchange Commission (SEC). Disse institutioner har i alt 53,472,710 aktier. Største aktionærer omfatter Berkshire Hathaway Inc, Linonia Partnership LP, Vanguard Group Inc, ValueAct Holdings, L.P., T. Rowe Price Investment Management, Inc., Morgan Stanley, BlackRock, Inc., Principal Financial Group Inc, Bamco Inc /ny/, and Deutsche Bank Ag\ .
Liberty Live Holdings, Inc. (NasdaqGS:LLYVK) institutionel ejerskabsstruktur viser aktuelle positioner i virksomheden efter institutioner og fonde, samt seneste ændringer i positionsstørrelse. Større aktionærer kan omfatte individuelle investorer, investeringsforeninger, hedgefonde eller institutioner. Skema 13D angiver, at investoren besidder (eller besidder) mere end 5 % af virksomheden og har til hensigt (eller har til hensigt at) aktivt at forfølge en ændring i forretningsstrategi. Skema 13G indikerer en passiv investering på over 5%.
The share price as of April 1, 2026 is 94,84 / share. Previously, on April 2, 2025, the share price was 71,54 / share. This represents an increase of 32,57% over that period.

Fondens stemningsscore
Fund Sentiment Score (fka Ownership Accumulation Score) finder de aktier, der bliver mest købt af fonde. Det er resultatet af en sofistikeret, multi-faktor kvantitativ model, der identificerer virksomheder med de højeste niveauer af institutionel akkumulering. Scoringsmodellen bruger en kombination af den samlede stigning i oplyste ejere, ændringerne i porteføljeallokeringer i disse ejere og andre målinger. Tallet går fra 0 til 100, hvor højere tal indikerer et højere niveau af akkumulering for sine jævnaldrende, og 50 er gennemsnittet.
Opdateringsfrekvens: Dagligt
Se Ownership Explorer, som giver en liste over højest rangerende virksomheder.
AI+ Ask Fintel’s AI assistant about Liberty Live Holdings, Inc..
Select a question to share a public post with an AI-crafted answer.
Thinking of good questions…
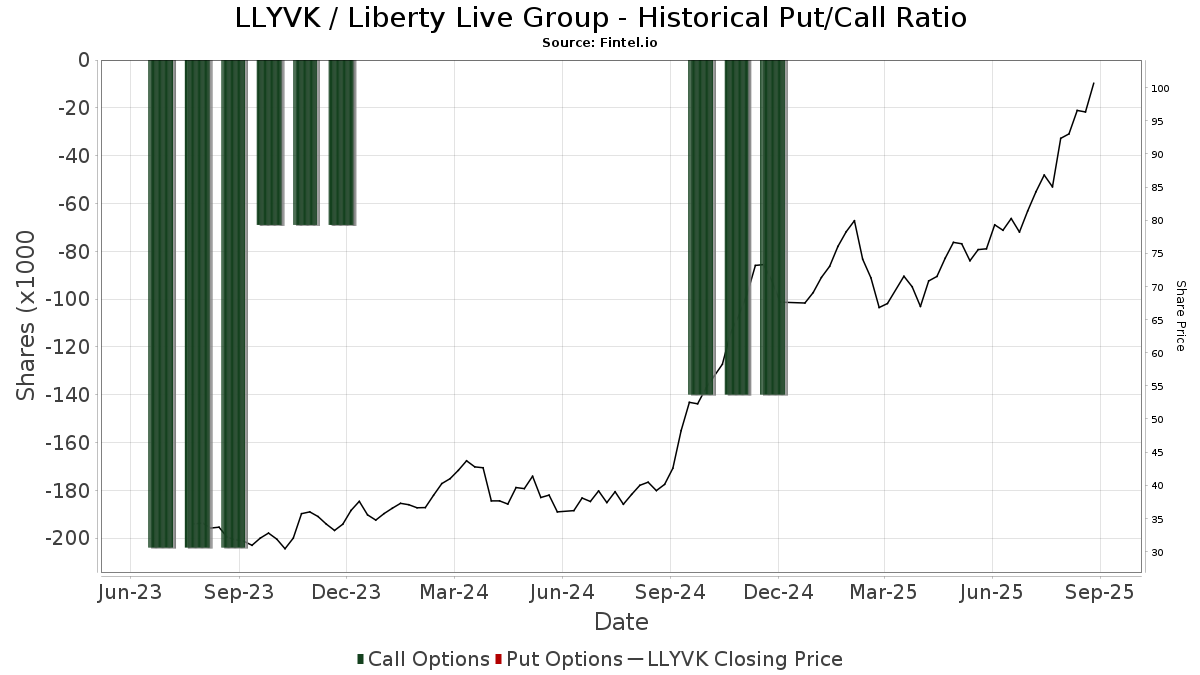
Institutionel Put/Call-forhold
Ud over at indberette standardaktie- og gældsudstedelser skal institutter med mere end 100 mill. aktiver under forvaltning også oplyse deres put- og call-optionsbeholdninger. Da salgsoptioner generelt indikerer negativ stemning, og købsoptioner indikerer positiv stemning, kan vi få en fornemmelse af den overordnede institutionelle stemning ved at plotte forholdet mellem put og kald. Diagrammet til højre viser det historiske put/call-forhold for dette instrument.
Brug af Put/Call Ratio som en indikator for investorernes stemning overvinder en af de vigtigste mangler ved at bruge totalt institutionelt ejerskab, som er, at en betydelig mængde af aktiver under forvaltning investeres passivt for at spore indekser. Passivt forvaltede fonde køber typisk ikke optioner, så indikatoren for put/call-forholdet følger mere nøje følelsen af aktivt forvaltede fonde.
13D/G-arkivering
Vi præsenterer 13D/G ansøgninger separat fra 13F ansøgninger på grund af den forskellige behandling af SEC. 13D/G-ansøgninger kan indgives af grupper af investorer (med én ledende), hvorimod 13F-ansøgninger ikke kan. Dette resulterer i situationer, hvor en investor kan indsende en 13D/G, der rapporterer én værdi for de samlede aktier (der repræsenterer alle de aktier, der ejes af investorgruppen), men derefter indsender en 13F, der rapporterer en anden værdi for de samlede aktier (der udelukkende repræsenterer deres egne) ejendomsret). Det betyder, at aktieejerskab af 13D/G-arkiver og 13F-arkiveringer ofte ikke er direkte sammenlignelige, så vi præsenterer dem separat.
Bemærk: Fra den 16. maj 2021 viser vi ikke længere ejere, der ikke har indsendt en 13D/G inden for det seneste år. Tidligere viste vi den fulde historie af 13D/G-arkiver. Generelt skal enheder, der er forpligtet til at indgive 13D/G-ansøgninger, indgive mindst årligt, før de indsender en afsluttende ansøgning. Dog forlader fonde nogle gange positioner uden at indsende en afsluttende ansøgning (dvs. de afvikler), så visning af den fulde historie resulterede nogle gange i forvirring om det nuværende ejerskab. For at undgå forvirring viser vi nu kun 'aktuelle' ejere - det vil sige - ejere, der har anmeldt inden for det seneste år.
Upgrade to unlock premium data.
| Fil dato | Form | Investor | Forrige Aktier |
Seneste Aktier |
Δ Aktier (Procent) |
Ejendomsret (Procent) |
Δ Ejerskab (Procent) |
|
|---|---|---|---|---|---|---|---|---|
| 2026-01-30 | VANGUARD GROUP INC | 4,731,711 | 4,721,818 | -0.21 | 7.40 | -0.54 | ||
| 2026-01-08 | T. Rowe Price Investment Management, Inc. | 10,315,091 | 16.20 | |||||
| 2025-10-20 | Linonia Partnership LP | 5,703,902 | 5,703,902 | 0.00 | 9.00 | 0.00 | ||
| 2025-03-21 | BARCLAYS PLC |
13F og NPORT arkivering
Detaljer om 13F-arkivering er gratis. Detaljer om NP-ansøgninger kræver et premium-medlemskab. Grønne rækker angiver nye positioner. Røde rækker angiver lukkede positioner. Klik på linket ikon for at se den fulde transaktionshistorik.
Opgrader
for at låse premium-data op og eksportere til Excel ![]() .
.
| Fil dato | Kilde | Investor | Type | Gennemsnitlig pris (Øst) |
Aktier | Δ Aktier (%) |
Rapporteret Værdi ($1000) |
Δ Værdi (%) |
Port Alloc (%) |
|
|---|---|---|---|---|---|---|---|---|---|---|
| 2026-02-11 | 13F | Ing Groep Nv | 21.600 | 1.796 | ||||||
| 2026-02-10 | 13F | Machina Capital S.a.s. | 31.828 | 2.647 | ||||||
| 2026-02-11 | 13F | Zions Bancorporation, National Association /ut/ | 3 | 0 | ||||||
| 2026-02-11 | 13F | Horizon Kinetics Asset Management Llc | 3.744 | 311 | ||||||
| 2026-02-17 | 13F | Canada Pension Plan Investment Board | 7.574 | -88,66 | 630 | -88,40 | ||||
| 2026-01-21 | 13F | Capital Advisors, Ltd. LLC | 33 | 0 | ||||||
| 2026-02-11 | 13F | Highbridge Capital Management Llc | 7.045 | 586 | ||||||
| 2026-02-09 | 13F | Geode Capital Management, Llc | 884.548 | 73.582 | ||||||
| 2026-02-17 | 13F | Raymond James Financial Inc | 19.977 | 1,54 | 1.661 | -12,90 | ||||
| 2026-02-13 | 13F | MAI Capital Management | 13.427 | 1.117 | ||||||
| 2026-02-24 | 13F | Bell Investment Advisors, Inc | 32 | 0,00 | 3 | 0,00 | ||||
| 2026-02-10 | 13F | Root Financial Partners, LLC | 5 | 0 | ||||||
| 2026-01-21 | 13F | Oak Thistle LLC | 28.978 | 2.410 | ||||||
| 2026-01-28 | 13F | Walleye Partners, LLC | 3.480 | 289 | ||||||
| 2026-02-13 | 13F | Bank Of Nova Scotia | 134.600 | 11.193 | ||||||
| 2026-02-19 | 13F | Invesco Ltd. | 97.000 | 8.067 | ||||||
| 2026-02-17 | 13F | Parallax Volatility Advisers, L.P. | 10.038 | 0,00 | 835 | -14,29 | ||||
| 2026-02-17 | 13F | First Manhattan Co | 10.859 | 903 | ||||||
| 2026-02-05 | 13F | Td Private Client Wealth Llc | 96 | 8 | ||||||
| 2026-02-13 | 13F | Neuberger Berman Group LLC | 6.715 | 558 | ||||||
| 2026-02-12 | 13F | Brown Brothers Harriman & Co | 1.861 | 155 | ||||||
| 2026-02-11 | 13F | Atlantic Private Wealth, LLC | 5 | 0 | ||||||
| 2026-02-17 | 13F | Janus Henderson Group Plc | 19.164 | 0,00 | 1.594 | -14,25 | ||||
| 2026-02-09 | 13F | Legal & General Group Plc | 45.250 | 3.763 | ||||||
| 2026-02-13 | 13F | Kayne Anderson Rudnick Investment Management Llc | 31 | 3 | ||||||
| 2026-01-14 | 13F | Waldron Private Wealth LLC | 3.753 | 312 | ||||||
| 2026-02-17 | 13F | Empyrean Capital Partners, LP | 134.300 | -23,59 | 11.168 | -34,48 | ||||
| 2026-02-17 | 13F | Millennium Management Llc | 55.344 | 53,43 | 4.602 | 31,60 | ||||
| 2026-02-09 | 13F | Key FInancial Inc | 2 | 0 | ||||||
| 2026-02-13 | 13F | Citigroup Inc | 42.198 | 3.509 | ||||||
| 2026-02-17 | 13F | Balyasny Asset Management Llc | 159.114 | 13.232 | ||||||
| 2026-02-06 | 13F | Global Retirement Partners, LLC | 523 | 43 | ||||||
| 2026-02-17 | 13F | Jones Financial Companies Lllp | 225 | 36,36 | 19 | 20,00 | ||||
| 2026-02-17 | 13F | SageView Advisory Group, LLC | 287 | 24 | ||||||
| 2026-02-11 | 13F | Winnow Wealth Llc | 1 | 0 | ||||||
| 2026-02-13 | 13F | Sei Investments Co | 121.763 | 10.126 | ||||||
| 2026-02-10 | 13F | Rothschild Investment Llc | 16 | 1 | ||||||
| 2026-02-10 | 13F | Bnp Paribas Arbitrage, Sa | 214.690 | 17.854 | ||||||
| 2026-02-05 | 13F | Bessemer Group Inc | 1.320 | 0 | ||||||
| 2026-02-06 | 13F | Kimelman & Baird, LLC | 32 | 3 | ||||||
| 2026-02-11 | 13F | Cerity Partners LLC | 4.296 | 357 | ||||||
| 2026-02-10 | 13F | Goldman Sachs Group Inc | 151.900 | 12.632 | ||||||
| 2026-02-17 | 13F | Emmett Investment Management, LP | 71.627 | -0,28 | 6.028 | -11,20 | ||||
| 2026-02-06 | 13F | HighTower Advisors, LLC | 3.228 | 268 | ||||||
| 2026-02-03 | 13F | Makena Capital Management Llc | 269.418 | 22.405 | ||||||
| 2026-02-17 | 13F | Holocene Advisors, LP | 100.000 | -30,16 | 8.316 | -40,10 | ||||
| 2026-01-16 | 13F | Trust Co Of Vermont | 246 | 20 | ||||||
| 2026-02-06 | 13F | Fortis Group Advisors, LLC | 52 | 4 | ||||||
| 2026-01-23 | 13F | Farther Finance Advisors, LLC | 97 | 8 | ||||||
| 2026-02-10 | 13F/A | Northwestern Mutual Wealth Management Co | 178 | 15 | ||||||
| 2026-02-13 | 13F | Hurley Capital, LLC | 2 | 0,00 | 0 | |||||
| 2026-01-23 | 13F | Fort Henry Capital, LLC | 2.699 | 224 | ||||||
| 2026-02-13 | 13F | Cornerstone Financial Management LLC | 6 | 0 | ||||||
| 2026-02-13 | 13F | FORA Capital, LLC | 3.875 | 322 | ||||||
| 2026-02-17 | 13F | Advisor Group Holdings, Inc. | 476 | -8,46 | 40 | -22,00 | ||||
| 2026-02-17 | 13F | State Of Wisconsin Investment Board | 60.091 | 5,29 | 4.997 | -9,70 | ||||
| 2026-02-10 | 13F | Natixis Advisors, L.p. | 10.110 | 1 | ||||||
| 2026-01-27 | 13F | Fractal Investments LLC | 5.143 | 428 | ||||||
| 2026-02-17 | 13F | ValueAct Holdings, L.P. | 3.603.988 | 2,51 | 299.708 | -12,09 | ||||
| 2026-01-29 | 13F | Pictet Asset Management Holding SA | 6.570 | 546 | ||||||
| 2026-01-23 | 13F | Third View Private Wealth, LLC | 2.912 | 242 | ||||||
| 2026-01-23 | 13F | Assetmark, Inc | 156 | 13 | ||||||
| 2026-02-13 | 13F | Manufacturers Life Insurance Company, The | 2.891 | 240 | ||||||
| 2026-01-22 | 13F | Bartlett & Co. Wealth Management Llc | 7.330 | 610 | ||||||
| 2026-01-28 | 13F | Klp Kapitalforvaltning As | 9.600 | 798 | ||||||
| 2026-01-15 | 13F | Nilsine Partners, LLC | 8.500 | 707 | ||||||
| 2026-02-05 | 13F | S&co Inc | 176.571 | 15 | ||||||
| 2026-02-04 | 13F | Hosking Partners LLP | 7.894 | 656 | ||||||
| 2026-02-13 | 13F | Aire Advisors, Llc | 10.490 | 0,87 | 872 | -13,49 | ||||
| 2026-02-13 | 13F | Charles Schwab Investment Management Inc | 635.046 | 52.810 | ||||||
| 2026-02-10 | 13F | Td Asset Management Inc | 556.610 | 46.288 | ||||||
| 2026-02-17 | 13F | Lighthouse Investment Partners, LLC | 157.819 | 0,00 | 13.124 | -14,24 | ||||
| 2026-01-23 | 13F | Steigerwald, Gordon & Koch Inc. | 41 | 3 | ||||||
| 2026-01-29 | 13F | Dunhill Financial, LLC | 1 | 0 | ||||||
| 2026-01-20 | 13F | Cromwell Holdings LLC | 3 | 0 | ||||||
| 2026-01-16 | 13F | Ronald Blue Trust, Inc. | 161 | 13 | ||||||
| 2026-01-20 | 13F | Trust Co Of Toledo Na /oh/ | 291 | 24 | ||||||
| 2026-01-23 | 13F | Avion Wealth | 12 | 0 | ||||||
| 2026-02-17 | 13F | Wallace Capital Management Inc. | 12.059 | -6,02 | 1.003 | -19,45 | ||||
| 2026-02-17 | 13F | Fmr Llc | 41.497 | 4,61 | 3.451 | -10,30 | ||||
| 2026-01-08 | 13F | True Wealth Design, LLC | 6 | 0 | ||||||
| 2026-02-05 | 13F | Pinnacle Associates Ltd | 6.657 | 554 | ||||||
| 2026-02-09 | 13F | Hartland & Co., LLC | 5.991 | 498 | ||||||
| 2026-01-12 | 13F | DAVENPORT & Co LLC | 166.490 | 13.874 | ||||||
| 2026-01-16 | 13F | PFS Partners, LLC | 6 | 0 | ||||||
| 2026-01-16 | 13F | DiNuzzo Private Wealth, Inc. | 3 | 0 | ||||||
| 2026-01-30 | 13F | Torren Management, LLC | 75 | 6 | ||||||
| 2026-02-09 | 13F | Harbour Investments, Inc. | 52 | 4 | ||||||
| 2026-02-13 | 13F | State Street Corp | 792.086 | 65.870 | ||||||
| 2026-01-29 | 13F | Dougherty Wealth Advisers LLC | 766 | 64 | ||||||
| 2026-02-17 | 13F | Price T Rowe Associates Inc /md/ | 1.341.554 | 112 | ||||||
| 2026-02-02 | 13F | CENTRAL TRUST Co | 6 | 0 | ||||||
| 2026-02-19 | 13F | CI Private Wealth, LLC | 12.670 | 102,69 | 1.054 | 73,76 | ||||
| 2026-02-13 | 13F | Pinnacle Wealth Planning Services, Inc. | 41 | 3 | ||||||
| 2026-01-20 | 13F | Signaturefd, Llc | 125 | 10 | ||||||
| 2026-02-12 | 13F | Voya Investment Management Llc | 3.376 | 281 | ||||||
| 2026-02-12 | 13F | MetLife Investment Management, LLC | 748 | 62 | ||||||
| 2026-02-05 | 13F | Gamco Investors, Inc. Et Al | 67.759 | 5.635 | ||||||
| 2026-02-12 | 13F | Swiss National Bank | 88.045 | 7.322 | ||||||
| 2026-01-27 | 13F | First Horizon Corp | 13 | 1 | ||||||
| 2026-02-17 | 13F | Northern Trust Corp | 240.101 | -2,48 | 19.967 | -16,37 | ||||
| 2026-02-13 | 13F | Bleichroeder LP | 13.802 | 1.175 | ||||||
| 2026-02-13 | 13F | BNP Paribas Asset Management Holding S.A. | 623 | 0 | ||||||
| 2026-01-29 | 13F | Anchyra Partners Llc | 4.622 | 384 | ||||||
| 2026-02-17 | 13F | Bank Of America Corp /de/ | 233.370 | -57,89 | 19.407 | -63,89 | ||||
| 2026-02-12 | 13F | CIBC Private Wealth Group, LLC | 2.074 | 172 | ||||||
| 2026-02-13 | 13F | SRS Capital Advisors, Inc. | 23 | 2 | ||||||
| 2026-02-17 | 13F | London Co Of Virginia | 178.952 | 5,82 | 14.882 | -9,25 | ||||
| 2026-02-13 | 13F | Public Employees Retirement Association Of Colorado | 5.396 | 0 | ||||||
| 2026-02-17 | 13F | Susquehanna International Group, Llp | 2.618 | -51,06 | 218 | -58,11 | ||||
| 2026-02-17 | 13F | Amundi | 82.547 | -80,62 | 6.865 | -82,10 | ||||
| 2026-02-13 | 13F | Barclays Plc | 14.709 | 1.223 | ||||||
| 2026-02-13 | 13F | Parkside Financial Bank & Trust | 65 | 5 | ||||||
| 2026-02-12 | 13F | Steward Partners Investment Advisory, Llc | 61 | 5 | ||||||
| 2026-02-06 | 13F | Larson Financial Group LLC | 195 | 16 | ||||||
| 2026-01-29 | 13F | UBS Group AG | 180.101 | 14.977 | ||||||
| 2026-02-17 | 13F | Aqr Capital Management Llc | 78.728 | 88,01 | 6.547 | 61,26 | ||||
| 2026-02-05 | 13F | GABELLI & Co INVESTMENT ADVISERS, INC. | 35.054 | 2.915 | ||||||
| 2026-02-26 | 13F/A | Alpine Global Management, LLC | 10.000 | 832 | ||||||
| 2026-02-17 | 13F | Worldquant Millennium Advisors Llc | 4.332 | 360 | ||||||
| 2026-01-09 | 13F | Assenagon Asset Management S.A. | 39.859 | 3.315 | ||||||
| 2026-02-13 | 13F | Korea Investment CORP | 36.071 | 3.000 | ||||||
| 2026-01-29 | 13F | Vanguard Group Inc | 4.721.823 | 392.667 | ||||||
| 2026-02-06 | 13F | Covestor Ltd | 179 | 0 | ||||||
| 2026-02-17 | 13F | Linonia Partnership LP | 5.746.719 | 477.897 | ||||||
| 2026-02-17 | 13F | Adage Capital Partners Gp, L.l.c. | 268.816 | 5,91 | 22.355 | -9,17 | ||||
| 2026-02-13 | 13F | American Century Companies Inc | 13.056 | 1.086 | ||||||
| 2026-01-15 | 13F | Allspring Global Investments Holdings, LLC | 568.328 | 47.830 | ||||||
| 2026-02-06 | 13F | Handelsbanken Fonder AB | 13.500 | 1 | ||||||
| 2026-02-12 | 13F | Ensign Peak Advisors, Inc | 6.692 | 557 | ||||||
| 2026-01-28 | 13F | Loring Wolcott & Coolidge Fiduciary Advisors Llp/ma | 392 | 33 | ||||||
| 2026-02-13 | 13F | Smartleaf Asset Management LLC | 275 | 23 | ||||||
| 2026-01-27 | 13F | Zurcher Kantonalbank (Zurich Cantonalbank) | 11.442 | 952 | ||||||
| 2026-02-10 | 13F | Norges Bank | 740.086 | 61.546 | ||||||
| 2026-01-07 | 13F | Massmutual Trust Co Fsb/adv | 387 | 32 | ||||||
| 2026-02-13 | 13F | JustInvest LLC | 3.942 | 328 | ||||||
| 2026-02-13 | 13F | Rhumbline Advisers | 45.140 | 3.754 | ||||||
| 2026-02-13 | 13F | Verition Fund Management LLC | 88.088 | 7.325 | ||||||
| 2026-02-17 | 13F | Maryland State Retirement & Pension System | 2.569 | 0,00 | 214 | -14,46 | ||||
| 2026-02-11 | 13F | SOUTH STATE Corp | 12 | 1 | ||||||
| 2026-01-29 | 13F | Comerica Bank | 1.717 | 143 | ||||||
| 2026-02-13 | 13F | Pin Oak Investment Advisors Inc | 4.112 | 0 | ||||||
| 2026-02-12 | 13F | Schwerin Boyle Capital Management Inc | 3.430 | 285 | ||||||
| 2026-01-28 | 13F | Universal- Beteiligungs- und Servicegesellschaft mbH | 5.228 | 435 | ||||||
| 2026-02-17 | 13F | Tudor Investment Corp Et Al | 18.783 | 1.562 | ||||||
| 2026-02-17 | 13F | Public Employees Retirement System Of Ohio | 13.771 | -3,65 | 1.145 | -17,33 | ||||
| 2026-02-09 | 13F | Keating Financial Advisory Services, Inc. | 3 | 0 | ||||||
| 2026-02-13 | 13F | Royal London Asset Management Ltd | 1 | 0 | ||||||
| 2026-02-17 | 13F | Ancora Advisors, LLC | 3.613 | 0,00 | 300 | -14,29 | ||||
| 2026-01-05 | 13F | GAMMA Investing LLC | 395 | 33 | ||||||
| 2026-02-05 | 13F | Gabelli Funds Llc | 185.052 | 15.389 | ||||||
| 2026-02-11 | 13F | Parallel Advisors, LLC | 114 | 9 | ||||||
| 2026-01-14 | 13F | R.H. Dinel Investment Counsel, Inc. | 4.579 | 381 | ||||||
| 2026-02-13 | 13F | LGT Financial Advisors LLC | 3 | 0 | ||||||
| 2026-02-13 | 13F | Brown Advisory Inc | 15.994 | 1.330 | ||||||
| 2026-02-06 | 13F | EverSource Wealth Advisors, LLC | 277 | 23 | ||||||
| 2026-02-13 | 13F | Alberta Investment Management Corp | 100.000 | 0,00 | 8.316 | -14,24 | ||||
| 2026-02-13 | 13F | Stifel Financial Corp | 3.336 | 277 | ||||||
| 2026-02-13 | 13F | Police & Firemen's Retirement System of New Jersey | 19.567 | 1.627 | ||||||
| 2026-01-26 | 13F | Cwm, Llc | 1.134 | 0 | ||||||
| 2026-02-11 | 13F | Deutsche Bank Ag\ | 1.526.760 | 126.965 | ||||||
| 2026-02-27 | 13F | Strategic Investment Solutions, Inc. /IL | 22 | 0,00 | 2 | -50,00 | ||||
| 2026-02-13 | 13F | Victory Capital Management Inc | 9.608 | 799 | ||||||
| 2026-02-13 | 13F | Atlas Capital Advisors Llc | 9.484 | 789 | ||||||
| 2026-02-13 | 13F | Walleye Capital LLC | 12.076 | 1.004 | ||||||
| 2026-02-17 | 13F | Quantinno Capital Management LP | 70.692 | 54,15 | 5.879 | 32,21 | ||||
| 2026-02-12 | 13F | Rossby Financial, LCC | 4 | 0 | ||||||
| 2026-02-13 | 13F | First Trust Advisors Lp | 83.812 | 6.970 | ||||||
| 2026-02-13 | 13F | Maplelane Capital, Llc | 67.000 | 5.572 | ||||||
| 2026-02-17 | 13F | Align Financial, LLC | 582 | 1 | ||||||
| 2026-01-08 | 13F | Wealth Enhancement Advisory Services, Llc | 7.724 | 644 | ||||||
| 2026-02-17 | 13F | Bamco Inc /ny/ | 1.613.666 | 10,61 | 134.192 | -5,14 | ||||
| 2026-02-12 | 13F | Quadrant Capital Group Llc | 16 | 1 | ||||||
| 2026-02-06 | 13F | Pnc Financial Services Group, Inc. | 2.910 | 242 | ||||||
| 2026-01-22 | 13F | Red Tortoise LLC | 2 | 0 | ||||||
| 2026-02-10 | 13F | Daiwa Securities Group Inc. | 887 | 0 | ||||||
| 2026-01-15 | 13F | Nisa Investment Advisors, Llc | 101 | 8 | ||||||
| 2026-02-09 | 13F | Choate Investment Advisors | 7.005 | 583 | ||||||
| 2026-02-09 | 13F | Delta Asset Management Llc/tn | 300 | 25 | ||||||
| 2026-02-13 | 13F | Quarry LP | 1.607 | 134 | ||||||
| 2026-01-29 | 13F | Simon Quick Advisors, Llc | 3.108 | 258 | ||||||
| 2026-01-08 | 13F | Versant Capital Management, Inc | 751 | 62 | ||||||
| 2026-01-12 | 13F | CVA Family Office, LLC | 12 | 1 | ||||||
| 2026-02-10 | 13F | Envestnet Asset Management Inc | 10.073 | 838 | ||||||
| 2026-02-17 | 13F | Alliancebernstein L.p. | 17.923 | 10,92 | 1.490 | -4,85 | ||||
| 2026-02-17 | 13F | California State Teachers Retirement System | 42.196 | 3.509 | ||||||
| 2026-02-17 | 13F | Prelude Capital Management, Llc | 6.860 | -81,49 | 570 | -84,14 | ||||
| 2026-02-05 | 13F | Allworth Financial LP | 53 | 4 | ||||||
| 2026-02-05 | 13F | Amalgamated Bank | 2.228 | 0 | ||||||
| 2026-02-18 | 13F | GWM Advisors LLC | 1 | 0,00 | 0 | |||||
| 2026-02-12 | 13F | Boussard & Gavaudan Investment Management LLP | 48.397 | 4.033 | ||||||
| 2026-02-05 | 13F | Center for Financial Planning, Inc. | 18 | 1 | ||||||
| 2026-02-17 | 13F | Utah Retirement Systems | 2.418 | 201 | ||||||
| 2026-02-12 | 13F | State Board Of Administration Of Florida Retirement System | 48.777 | 4.056 | ||||||
| 2026-02-12 | 13F | Dimensional Fund Advisors Lp | 412.489 | 34.303 | ||||||
| 2026-02-17 | 13F | NorthRock Partners, LLC | 2.831 | 235 | ||||||
| 2026-02-13 | 13F | Sculptor Capital LP | 988.500 | 82.204 | ||||||
| 2026-02-13 | 13F | Treasurer of the State of North Carolina | 23.376 | 2 | ||||||
| 2026-02-11 | 13F | Illinois Municipal Retirement Fund | 21.155 | 1.759 | ||||||
| 2026-02-12 | 13F | Nuveen, LLC | 86.704 | 7.210 | ||||||
| 2026-02-17 | 13F | Harvest Investment Services, LLC | 8.107 | 674 | ||||||
| 2026-02-17 | 13F | Bislett Management, Llc | 35.000 | -41,67 | 2.911 | -40,23 | ||||
| 2026-01-26 | 13F | KBC Group NV | 1.919 | 0 | ||||||
| 2026-02-17 | 13F | D. E. Shaw & Co., Inc. | 1.168.783 | 7,18 | 97.196 | -8,09 | ||||
| 2026-02-17 | 13F | Boothbay Fund Management, Llc | 5.017 | 417 | ||||||
| 2026-01-21 | 13F | SJS Investment Consulting Inc. | 3 | 0 | ||||||
| 2026-01-13 | 13F | CoreCap Advisors, LLC | 4 | 0 | ||||||
| 2026-01-29 | 13F | Quent Capital, LLC | 1.065 | 89 | ||||||
| 2026-01-20 | 13F | Wall Street Access Asset Management, LLC | 264 | 22 | ||||||
| 2026-01-27 | 13F | Evergreen Capital Management Llc | 6.068 | 505 | ||||||
| 2026-02-11 | 13F | TCTC Holdings, LLC | 366 | 30 | ||||||
| 2026-02-17 | 13F | Advaya LLP | 184.500 | 15.343 | ||||||
| 2026-02-04 | 13F | Virginia Retirement Systems Et Al | 6.004 | 499 | ||||||
| 2026-02-17 | 13F | Royal Bank Of Canada | 28.340 | -17,12 | 2.356 | -28,93 | ||||
| 2026-02-17 | 13F | Ameriflex Group, Inc. | 1 | 0,00 | 0 | |||||
| 2026-02-17 | 13F | T. Rowe Price Investment Management, Inc. | 3.499.318 | 291 | ||||||
| 2026-02-13 | 13F | Ubs Asset Management Americas Inc | 112.881 | 9.387 | ||||||
| 2026-02-02 | 13F | Principal Financial Group Inc | 1.812.689 | 150.744 | ||||||
| 2026-02-17 | 13F | Russell Investments Group, Ltd. | 4.827 | 170,57 | 401 | 178,47 | ||||
| 2026-02-17 | 13F | Toronto Dominion Bank | 7 | 0,00 | 1 | |||||
| 2026-02-13 | 13F | Findlay Park Partners LLP | 30.774 | 2.559 | ||||||
| 2026-02-17 | 13F | Berkshire Hathaway Inc | 10.917.661 | 907.913 | ||||||
| 2026-02-17 | 13F | Creative Planning | 6.804 | 0,53 | 566 | -13,87 | ||||
| 2026-02-10 | 13F | Bruce G. Allen Investments, LLC | 2 | 0 | ||||||
| 2026-01-07 | 13F | Harbor Investment Advisory, Llc | 5 | 0 | ||||||
| 2026-01-28 | 13F | Teacher Retirement System Of Texas | 3.019 | 251 | ||||||
| 2026-01-26 | 13F | Whittier Trust Co | 18 | 2 | ||||||
| 2026-02-17 | 13F | Summit Trail Advisors, Llc | 10.875 | 904 | ||||||
| 2026-02-11 | 13F | Janney Montgomery Scott LLC | 6.485 | 1 | ||||||
| 2026-02-13 | 13F | Wells Fargo & Company/mn | 69.557 | 5.784 | ||||||
| 2026-02-12 | 13F | New York State Common Retirement Fund | 23.668 | 1.968 | ||||||
| 2026-02-09 | 13F | Atlantic Trust, LLC | 176 | 15 | ||||||
| 2026-02-11 | 13F | LPL Financial LLC | 4.972 | 413 | ||||||
| 2026-02-13 | 13F | Sterling Capital Management LLC | 2.762 | 230 | ||||||
| 2026-01-09 | 13F | SG Americas Securities, LLC | 609.399 | 51 | ||||||
| 2026-02-13 | 13F | Commerce Bank | 17.074 | 1.420 | ||||||
| 2026-01-12 | 13F | Rialto Wealth Management, LLC | 15 | 1 | ||||||
| 2026-02-03 | 13F | Ethic Inc. | 9.036 | 751 | ||||||
| 2026-02-17 | 13F | Corvex Management LP | 32.322 | 0,00 | 2.688 | -14,26 | ||||
| 2026-01-21 | 13F | Westfuller Advisors, LLC | 125 | 10 | ||||||
| 2026-02-13 | 13F | Morgan Stanley | 2.062.231 | 171.495 | ||||||
| 2026-01-30 | 13F | Us Bancorp \de\ | 1.860 | 155 | ||||||
| 2026-02-10 | 13F | Murphy & Mullick Capital Management Corp | 645 | 54 | ||||||
| 2026-02-02 | 13F | Kornitzer Capital Management Inc /ks | 35.000 | 2.911 | ||||||
| 2026-02-17 | 13F | Tower Research Capital LLC (TRC) | 951 | 51,43 | 79 | 31,67 | ||||
| 2026-01-28 | 13F | HB Wealth Management, LLC | 20.880 | 1.736 | ||||||
| 2026-02-02 | 13F | Strs Ohio | 1.096 | 91 | ||||||
| 2026-01-28 | 13F | Arizona State Retirement System | 12.425 | 1.033 | ||||||
| 2026-01-26 | 13F | Mirae Asset Global Investments Co., Ltd. | 156 | 13 | ||||||
| 2026-02-11 | 13F | Jpmorgan Chase & Co | 103.698 | 8.624 | ||||||
| 2026-02-06 | 13F | IFP Advisors, Inc | 6 | 0 | ||||||
| 2026-02-17 | 13F | JNE Partners LLP | 1.173.090 | 97.554 | ||||||
| 2026-02-04 | 13F | Atlantic Union Bankshares Corp | 25 | 2 | ||||||
| 2026-01-30 | 13F | Valued Wealth Advisors LLC | 36 | 3 | ||||||
| 2026-01-20 | 13F | Toth Financial Advisory Corp | 1 | 0 | ||||||
| 2026-02-06 | 13F | Cullen/frost Bankers, Inc. | 1 | 0 | ||||||
| 2026-02-14 | 13F | Rockefeller Capital Management L.P. | 909 | 76 | ||||||
| 2026-02-10 | 13F | Bank of New York Mellon Corp | 126.774 | 10.543 | ||||||
| 2026-02-12 | 13F | BlackRock, Inc. | 1.913.212 | 159.103 |