Grundlæggende statistik
| Institutionelle aktier (lange) | 39.623.949 - 24,40% (ex 13D/G) - change of -1,97MM shares -4,73% MRQ |
| Institutionel værdi (lang) | $ 150.140 USD ($1000) |
Institutionelt ejerskab og aktionærer
Lithium Argentina AG (US:LAAC) har 154 institutionelle ejere og aktionærer, der har indsendt 13D/G- eller 13F-formularer til Securities Exchange Commission (SEC). Disse institutioner har i alt 39,623,949 aktier. Største aktionærer omfatter Van Eck Associates Corp, MIRAE ASSET GLOBAL ETFS HOLDINGS Ltd., ARGT - Global X MSCI Argentina ETF, PBW - Invesco WilderHill Clean Energy ETF, Millennium Management Llc, Seldon Capital Lp, Invesco Ltd., Connor, Clark & Lunn Investment Management Ltd., M&G Plc, and LIT - Global X Lithium & Battery Tech ETF .
Lithium Argentina AG (NYSE:LAAC) institutionel ejerskabsstruktur viser aktuelle positioner i virksomheden efter institutioner og fonde, samt seneste ændringer i positionsstørrelse. Større aktionærer kan omfatte individuelle investorer, investeringsforeninger, hedgefonde eller institutioner. Skema 13D angiver, at investoren besidder (eller besidder) mere end 5 % af virksomheden og har til hensigt (eller har til hensigt at) aktivt at forfølge en ændring i forretningsstrategi. Skema 13G indikerer en passiv investering på over 5%.

Fondens stemningsscore
Fund Sentiment Score (fka Ownership Accumulation Score) finder de aktier, der bliver mest købt af fonde. Det er resultatet af en sofistikeret, multi-faktor kvantitativ model, der identificerer virksomheder med de højeste niveauer af institutionel akkumulering. Scoringsmodellen bruger en kombination af den samlede stigning i oplyste ejere, ændringerne i porteføljeallokeringer i disse ejere og andre målinger. Tallet går fra 0 til 100, hvor højere tal indikerer et højere niveau af akkumulering for sine jævnaldrende, og 50 er gennemsnittet.
Opdateringsfrekvens: Dagligt
Se Ownership Explorer, som giver en liste over højest rangerende virksomheder.
AI+ Ask Fintel’s AI assistant about Lithium Argentina AG.
Select a question to share a public post with an AI-crafted answer.
Thinking of good questions…
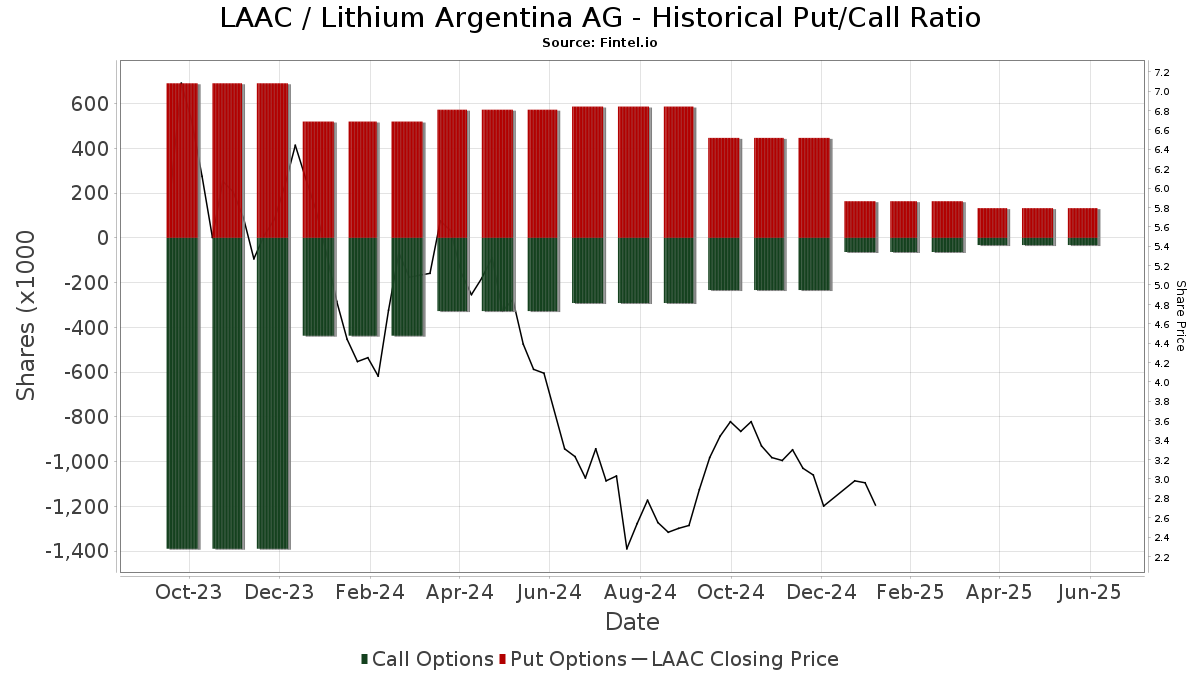
Institutionel Put/Call-forhold
Ud over at indberette standardaktie- og gældsudstedelser skal institutter med mere end 100 mill. aktiver under forvaltning også oplyse deres put- og call-optionsbeholdninger. Da salgsoptioner generelt indikerer negativ stemning, og købsoptioner indikerer positiv stemning, kan vi få en fornemmelse af den overordnede institutionelle stemning ved at plotte forholdet mellem put og kald. Diagrammet til højre viser det historiske put/call-forhold for dette instrument.
Brug af Put/Call Ratio som en indikator for investorernes stemning overvinder en af de vigtigste mangler ved at bruge totalt institutionelt ejerskab, som er, at en betydelig mængde af aktiver under forvaltning investeres passivt for at spore indekser. Passivt forvaltede fonde køber typisk ikke optioner, så indikatoren for put/call-forholdet følger mere nøje følelsen af aktivt forvaltede fonde.
13D/G-arkivering
Vi præsenterer 13D/G ansøgninger separat fra 13F ansøgninger på grund af den forskellige behandling af SEC. 13D/G-ansøgninger kan indgives af grupper af investorer (med én ledende), hvorimod 13F-ansøgninger ikke kan. Dette resulterer i situationer, hvor en investor kan indsende en 13D/G, der rapporterer én værdi for de samlede aktier (der repræsenterer alle de aktier, der ejes af investorgruppen), men derefter indsender en 13F, der rapporterer en anden værdi for de samlede aktier (der udelukkende repræsenterer deres egne) ejendomsret). Det betyder, at aktieejerskab af 13D/G-arkiver og 13F-arkiveringer ofte ikke er direkte sammenlignelige, så vi præsenterer dem separat.
Bemærk: Fra den 16. maj 2021 viser vi ikke længere ejere, der ikke har indsendt en 13D/G inden for det seneste år. Tidligere viste vi den fulde historie af 13D/G-arkiver. Generelt skal enheder, der er forpligtet til at indgive 13D/G-ansøgninger, indgive mindst årligt, før de indsender en afsluttende ansøgning. Dog forlader fonde nogle gange positioner uden at indsende en afsluttende ansøgning (dvs. de afvikler), så visning af den fulde historie resulterede nogle gange i forvirring om det nuværende ejerskab. For at undgå forvirring viser vi nu kun 'aktuelle' ejere - det vil sige - ejere, der har anmeldt inden for det seneste år.
Upgrade to unlock premium data.
| Fil dato | Form | Investor | Forrige Aktier |
Seneste Aktier |
Δ Aktier (Procent) |
Ejendomsret (Procent) |
Δ Ejerskab (Procent) |
|
|---|---|---|---|---|---|---|---|---|
| 2025-05-15 | ORION RESOURCE PARTNERS (USA) LP | 24,271,500 | 9.99 |
13F og NPORT arkivering
Detaljer om 13F-arkivering er gratis. Detaljer om NP-ansøgninger kræver et premium-medlemskab. Grønne rækker angiver nye positioner. Røde rækker angiver lukkede positioner. Klik på linket ikon for at se den fulde transaktionshistorik.
Opgrader
for at låse premium-data op og eksportere til Excel ![]() .
.
| Fil dato | Kilde | Investor | Type | Gennemsnitlig pris (Øst) |
Aktier | Δ Aktier (%) |
Rapporteret Værdi ($1000) |
Δ Værdi (%) |
Port Alloc (%) |
|
|---|---|---|---|---|---|---|---|---|---|---|
| 2026-01-23 | 13F | Optima Capital Llc | 1.705 | 10 | ||||||
| 2026-02-17 | 13F | Balyasny Asset Management Llc | 971.950 | 5.423 | ||||||
| 2026-02-13 | 13F | OMERS ADMINISTRATION Corp | 0 | -100,00 | 0 | |||||
| 2026-02-05 | 13F | Cambridge Investment Research Advisors, Inc. | 22.762 | 15,31 | 0 | |||||
| 2026-02-10 | 13F/A | Northwestern Mutual Wealth Management Co | 43.474 | -10,68 | 243 | 49,38 | ||||
| 2026-02-17 | 13F | SageView Advisory Group, LLC | 330 | 2 | ||||||
| 2026-01-23 | 13F | Farther Finance Advisors, LLC | 162 | -75,53 | 1 | -100,00 | ||||
| 2026-02-17 | 13F | Citadel Advisors Llc | 0 | -100,00 | 0 | -100,00 | ||||
| 2026-02-11 | 13F | CenterBook Partners LP | 1.231.844 | 6.874 | ||||||
| 2026-02-10 | 13F | Goldman Sachs Group Inc | 1.036.354 | 58,55 | 5.783 | 164,86 | ||||
| 2026-02-12 | 13F | Groupe la Francaise | 0 | -100,00 | 0 | |||||
| 2026-02-10 | 13F | Bnp Paribas Arbitrage, Sa | 7.836 | -31,19 | 44 | 13,16 | ||||
| 2026-02-17 | 13F | Black Maple Capital Management LP | 20.191 | -33,12 | 113 | 12,00 | ||||
| 2026-02-17 | 13F | State Of Wisconsin Investment Board | 118.000 | 659 | ||||||
| 2026-01-26 | 13F | Cwm, Llc | 627 | 0,00 | 0 | |||||
| 2026-02-13 | 13F | Morgan Stanley | 1.059.980 | 60,90 | 5.915 | 168,82 | ||||
| 2026-02-17 | 13F | Mirabella Financial Services Llp | 59.952 | 5,72 | 335 | 76,72 | ||||
| 2026-02-12 | 13F | M&G Plc | 1.401.219 | 12,16 | 8.407 | 124,37 | ||||
| 2026-02-03 | 13F | Credit Industriel Et Commercial | 0 | -100,00 | 0 | |||||
| 2026-02-03 | 13F | McCarthy Asset Management, Inc. | 0 | -100,00 | 0 | |||||
| 2026-02-12 | 13F | Jane Street Group, Llc | Put | 0 | -100,00 | 0 | -100,00 | |||
| 2026-02-06 | 13F | EverSource Wealth Advisors, LLC | 109 | 6,86 | 1 | |||||
| 2026-02-02 | 13F | Ping Capital Management, Inc. | 102.000 | 0,00 | 569 | 67,35 | ||||
| 2026-02-12 | 13F | Jane Street Group, Llc | Call | 0 | -100,00 | 0 | -100,00 | |||
| 2026-02-11 | 13F | Winton Capital Group Ltd | 90.461 | 301,34 | 505 | 572,00 | ||||
| 2026-01-08 | 13F | True Wealth Design, LLC | 600 | 0,00 | 3 | 50,00 | ||||
| 2026-02-13 | 13F | Toroso Investments, LLC | 145.977 | -0,15 | 815 | 66,80 | ||||
| 2025-11-10 | 13F/A | Flaharty Asset Management, LLC | 0 | -100,00 | 0 | |||||
| 2026-02-03 | 13F | Garner Asset Management Corp | 100 | 1 | ||||||
| 2026-02-06 | 13F | HighTower Advisors, LLC | 18.338 | -0,10 | 102 | 67,21 | ||||
| 2026-02-12 | 13F | Alps Advisors Inc | 459.929 | 2.566 | ||||||
| 2026-01-20 | 13F | AdvisorNet Financial, Inc | 4.652 | 0,00 | 26 | 66,67 | ||||
| 2026-02-17 | 13F | Quadrature Capital Ltd | 133.841 | 747 | ||||||
| 2026-02-17 | 13F | Advisor Group Holdings, Inc. | 31.117 | -1,90 | 174 | 61,68 | ||||
| 2025-09-29 | NP | PBW - Invesco WilderHill Clean Energy ETF This fund is a listed as child fund of Invesco Ltd. and if that institution has disclosed ownership in this security, then these positions will not be double counted when calculating total shares and total value | 2.215.930 | 39,96 | 5.872 | 80,96 | ||||
| 2026-01-28 | 13F | Quaker Wealth Management, LLC | 17 | 0,00 | 0 | |||||
| 2026-02-17 | 13F | Ameriprise Financial Inc | 46.022 | -3,51 | 257 | 61,01 | ||||
| 2026-02-17 | 13F | Tower Research Capital LLC (TRC) | 3.271 | -71,76 | 18 | -52,63 | ||||
| 2026-02-13 | 13F | National Bank Of Canada /fi/ | 99.446 | -6,23 | 552 | 61,40 | ||||
| 2026-02-17 | 13F | Citadel Advisors Llc | Call | 299.100 | 226,53 | 1.669 | 446,89 | |||
| 2026-01-29 | 13F | D.a. Davidson & Co. | 22.550 | 0,00 | 126 | 66,67 | ||||
| 2026-01-21 | 13F | Sound Income Strategies, LLC | 50 | 0,00 | 0 | |||||
| 2026-02-17 | 13F | XTX Topco Ltd | 88.086 | 33,34 | 492 | 123,18 | ||||
| 2026-01-08 | 13F | Chesapeake Asset Management Llc | 1.375 | 0,00 | 8 | 75,00 | ||||
| 2025-11-12 | 13F | Creative Financial Designs Inc /adv | 0 | -100,00 | 0 | -100,00 | ||||
| 2026-02-10 | 13F | Connor, Clark & Lunn Investment Management Ltd. | 2.008.800 | 11.211 | ||||||
| 2026-02-20 | 13F | Sunbelt Securities, Inc. | 600 | 0,00 | 3 | 50,00 | ||||
| 2025-11-06 | 13F | Claudia M.p. Batlle, Crp (r) Llc | 0 | -100,00 | 0 | -100,00 | ||||
| 2025-11-13 | 13F | Boston Partners | 0 | -100,00 | 0 | -100,00 | ||||
| 2026-01-16 | 13F | Balboa Wealth Partners | 34.828 | -3,58 | 194 | 61,67 | ||||
| 2026-02-17 | 13F | Polygon Management Ltd. | 0 | -100,00 | 0 | |||||
| 2026-02-13 | 13F | Manufacturers Life Insurance Company, The | 0 | -100,00 | 0 | |||||
| 2026-02-17 | 13F | Citadel Advisors Llc | Put | 48.400 | 19,51 | 270 | 100,00 | |||
| 2026-03-06 | 13F | Hsbc Holdings Plc | 19.040 | 107 | ||||||
| 2026-02-02 | 13F | Robertson Stephens Wealth Management, LLC | 0 | -100,00 | 0 | |||||
| 2026-01-29 | 13F | St Germain D J Co Inc | 324 | 0,00 | 2 | 0,00 | ||||
| 2026-02-13 | 13F | Squarepoint Ops LLC | 59.002 | 329 | ||||||
| 2026-02-17 | 13F | Fairscale Capital, LLC | 785 | 0,00 | 4 | 100,00 | ||||
| 2026-02-09 | 13F | Harbour Investments, Inc. | 150 | 0,00 | 1 | |||||
| 2025-11-13 | 13F | Diversify Advisory Services, LLC | 0 | -100,00 | 0 | |||||
| 2026-02-17 | 13F | Riverview Capital Advisers, LLC | 60.786 | 0,00 | 339 | 67,00 | ||||
| 2026-02-17 | 13F | Cetera Investment Advisers | 16.593 | -22,36 | 93 | 29,58 | ||||
| 2026-02-17 | 13F | Susquehanna International Group, Llp | 400.576 | 52,84 | 2.235 | 155,43 | ||||
| 2026-01-14 | 13F | Thompson Investment Management, Inc. | 500 | 0,00 | 3 | 100,00 | ||||
| 2026-02-13 | 13F | First Trust Advisors Lp | 45.985 | 257 | ||||||
| 2026-02-04 | 13F | Clark Wealth Partners | 376 | 0,00 | 2 | 0,00 | ||||
| 2026-02-17 | 13F | Susquehanna International Group, Llp | Put | 244.000 | 129,76 | 1.362 | 284,46 | |||
| 2026-02-17 | 13F | Susquehanna International Group, Llp | Call | 345.000 | 1.504,65 | 1.925 | 2.611,27 | |||
| 2026-02-02 | 13F | Fifth Third Bancorp | 14.000 | 250,00 | 78 | 500,00 | ||||
| 2026-02-12 | 13F | CIBC Private Wealth Group, LLC | 2.970 | 0,00 | 17 | 77,78 | ||||
| 2026-02-13 | 13F | SRS Capital Advisors, Inc. | 2.150 | 0,00 | 12 | 57,14 | ||||
| 2026-02-17 | 13F | Jones Financial Companies Lllp | 63.017 | 6,01 | 352 | 67,14 | ||||
| 2026-02-06 | 13F | Banque Cantonale Vaudoise | 77.481 | 145,19 | 432 | |||||
| 2026-02-09 | 13F | Hartland & Co., LLC | 50 | 0,00 | 0 | |||||
| 2026-02-17 | 13F | Mercer Global Advisors Inc /adv | 92.340 | -3,88 | 515 | 60,94 | ||||
| 2026-03-19 | 13F | Painted Porch Advisors LLC | 0 | -100,00 | 0 | |||||
| 2026-02-14 | 13F | Rockefeller Capital Management L.P. | 518 | -11,75 | 3 | 100,00 | ||||
| 2026-02-17 | 13F | Susquehanna Advisors Group, Inc. | 0 | -100,00 | 0 | |||||
| 2026-02-09 | 13F | Huntington National Bank | 1.000 | 0,00 | 6 | 66,67 | ||||
| 2026-02-11 | 13F | Cedar Mountain Advisors, LLC | 1 | 0,00 | 0 | |||||
| 2025-11-14 | 13F | Toronto Dominion Bank | 0 | -100,00 | 0 | |||||
| 2026-02-13 | 13F | Ingalls & Snyder Llc | 25.200 | 0,00 | 0 | |||||
| 2026-02-17 | 13F | Schonfeld Strategic Advisors LLC | 31.977 | 178 | ||||||
| 2026-02-06 | 13F | Tortoise Investment Management, LLC | 0 | -100,00 | 0 | |||||
| 2026-02-12 | 13F | Commonwealth Equity Services, Llc | 20.263 | -21,50 | 113 | |||||
| 2026-02-13 | 13F | Caitong International Asset Management Co., Ltd | 1.501 | 1.401,00 | 8 | |||||
| 2025-11-14 | 13F | Point72 Asset Management, L.P. | 0 | -100,00 | 0 | |||||
| 2026-02-17 | 13F | Royal Bank Of Canada | 117.844 | -86,11 | 658 | -76,78 | ||||
| 2026-03-12 | 13F/A | Peak6 Llc | Call | 692.300 | 3.863 | |||||
| 2026-02-17 | 13F | Northern Trust Corp | 17.137 | 0,00 | 96 | 66,67 | ||||
| 2026-02-13 | 13F | Banco Santander, S.A. | 11.628 | -75,45 | 65 | -59,49 | ||||
| 2026-01-23 | 13F | Sage Investment Counsel LLC | 0 | -100,00 | 0 | |||||
| 2026-02-18 | 13F | GWM Advisors LLC | 5.584 | 0,00 | 31 | 72,22 | ||||
| 2026-02-13 | 13F | Parkside Financial Bank & Trust | 10 | 0,00 | 0 | |||||
| 2026-02-12 | 13F | Edgewood Management Llc | 50.000 | 0,00 | 279 | 67,07 | ||||
| 2026-01-30 | 13F | Us Bancorp \de\ | 398 | -15,50 | 2 | 100,00 | ||||
| 2026-02-18 | 13F/A | Empowered Funds, LLC | 24.766 | 138 | ||||||
| 2026-01-29 | 13F | UBS Group AG | 289.244 | -69,77 | 1.614 | -49,53 | ||||
| 2026-02-17 | 13F | Bank Of America Corp /de/ | 460.679 | 24,33 | 2.571 | 107,76 | ||||
| 2025-11-03 | 13F | Hollencrest Capital Management | 0 | -100,00 | 0 | |||||
| 2026-02-12 | 13F | Insigneo Advisory Services, Llc | 0 | -100,00 | 0 | |||||
| 2026-02-11 | 13F | Parallel Advisors, LLC | 100 | -81,82 | 1 | -100,00 | ||||
| 2026-01-20 | 13F | Stratos Wealth Advisors, LLC | 13.638 | 0,00 | 76 | 68,89 | ||||
| 2026-02-13 | 13F | Evelyn Partners Investment Management LLP | 300 | 0,00 | 2 | 0,00 | ||||
| 2026-01-27 | 13F | Sterling Investment Counsel, LLC | 28.197 | 2,62 | 157 | 72,53 | ||||
| 2025-11-13 | 13F | VGI Partners Ltd | 0 | -100,00 | 0 | -100,00 | ||||
| 2026-01-20 | 13F | Signaturefd, Llc | 137 | 0,00 | 1 | |||||
| 2026-02-17 | 13F | Orion Resource Partners LP | 0 | -100,00 | 0 | |||||
| 2026-02-18 | 13F | Caitlin John, LLC | 190 | 1 | ||||||
| 2025-11-13 | 13F | Total Investment Management Inc | 0 | -100,00 | 0 | |||||
| 2026-02-12 | 13F | Hrt Financial Lp | 243.644 | 1 | ||||||
| 2026-02-17 | 13F | Nomura Holdings Inc | 0 | -100,00 | 0 | |||||
| 2026-02-02 | 13F | New England Capital Financial Advisors LLC | 50 | 0,00 | 0 | |||||
| 2025-09-29 | NP | LIT - Global X Lithium & Battery Tech ETF This fund is a listed as child fund of Mirae Asset Global Investments Co., Ltd. and if that institution has disclosed ownership in this security, then these positions will not be double counted when calculating total shares and total value | 1.252.967 | 10,25 | 3.326 | 42,38 | ||||
| 2026-02-17 | 13F | J. Goldman & Co LP | Call | 30.000 | 167 | |||||
| 2026-02-17 | 13F | Tudor Investment Corp Et Al | 54.500 | 304 | ||||||
| 2026-02-12 | 13F | Renaissance Technologies Llc | 0 | -100,00 | 0 | |||||
| 2026-02-12 | 13F | Counterpoint Mutual Funds LLC | 0 | -100,00 | 0 | |||||
| 2026-02-11 | 13F | Group One Trading, L.p. | 89.349 | 504,40 | 499 | 916,33 | ||||
| 2025-11-14 | 13F | Larson Financial Group LLC | 0 | -100,00 | 0 | |||||
| 2026-02-13 | 13F | Citigroup Inc | 750 | 0,00 | 4 | 100,00 | ||||
| 2026-02-17 | 13F | Two Sigma Investments, Lp | 497.604 | 155,80 | 2.777 | 327,73 | ||||
| 2026-01-22 | 13F | Quotient Wealth Partners, LLC | 23.500 | 0,00 | 131 | 67,95 | ||||
| 2026-02-12 | 13F | IFC & Insurance Marketing, Inc. | 2.100 | 0 | ||||||
| 2026-02-10 | 13F | Lido Advisors, LLC | 10.583 | 0,00 | 37 | 2,86 | ||||
| 2026-02-13 | 13F | JustInvest LLC | 13.204 | 1,82 | 74 | 69,77 | ||||
| 2026-01-16 | 13F | Legacy Capital Wealth Partners, LLC | 11.279 | 0,00 | 63 | 67,57 | ||||
| 2026-02-13 | 13F | Verition Fund Management LLC | 17.178 | 14,87 | 96 | 93,88 | ||||
| 2026-01-29 | 13F | Nbc Securities, Inc. | 255 | 0,00 | 1 | |||||
| 2026-01-21 | 13F | Newbridge Financial Services Group, Inc. | 1.029 | 0,00 | 6 | 66,67 | ||||
| 2025-11-06 | 13F | Financial Advocates Investment Management | 0 | -100,00 | 0 | |||||
| 2026-01-30 | 13F | Kohmann Bosshard Financial Services, LLC | 100 | 1 | ||||||
| 2026-02-13 | 13F | Pinpoint Asset Management (Singapore) Pte. Ltd. | 3.166 | 18 | ||||||
| 2026-02-17 | 13F | Strive Financial Group ,LLC | 23 | 0 | ||||||
| 2026-02-06 | 13F | GPS Wealth Strategies Group, LLC | 0 | -100,00 | 0 | |||||
| 2026-02-19 | 13F | Invesco Ltd. | 2.028.903 | -13,01 | 11.321 | 45,35 | ||||
| 2025-11-13 | 13F | Sandhill Capital Partners LLC | 0 | -100,00 | 0 | -100,00 | ||||
| 2025-11-14 | 13F | Two Sigma Securities, Llc | 0 | -100,00 | 0 | |||||
| 2026-02-13 | 13F | Brown Advisory Inc | 90.656 | -3,20 | 506 | 61,86 | ||||
| 2026-02-13 | 13F | Missouri Trust & Investment Co | 75 | 0,00 | 0 | |||||
| 2026-02-10 | 13F | CIBC World Markets Inc. | 69.856 | -45,45 | 390 | -8,90 | ||||
| 2026-02-10 | 13F | Quantbot Technologies LP | 62.034 | -68,39 | 346 | -47,18 | ||||
| 2026-01-16 | 13F | FNY Investment Advisers, LLC | 99.158 | 1 | ||||||
| 2026-02-10 | 13F | Envestnet Asset Management Inc | 28.883 | -25,94 | 161 | 23,85 | ||||
| 2025-11-14 | 13F | Scotia Capital Inc. | 0 | -100,00 | 0 | |||||
| 2026-02-02 | 13F | Millstone Evans Group, LLC | 20 | 0,00 | 0 | |||||
| 2026-02-17 | 13F | Old West Investment Management, LLC | 33.089 | 185 | ||||||
| 2026-02-06 | 13F | Global Retirement Partners, LLC | 1.107 | 0,00 | 6 | 100,00 | ||||
| 2026-02-17 | 13F | D. E. Shaw & Co., Inc. | 611.500 | 49,51 | 3.413 | 150,40 | ||||
| 2026-02-17 | 13F | Elequin Capital Lp | 13 | 0 | ||||||
| 2026-01-08 | 13F | Wealth Enhancement Advisory Services, Llc | 345.598 | 1,63 | 2.412 | 39,91 | ||||
| 2026-02-05 | 13F | 1620 Investment Advisors, Inc. | 88 | 0,00 | 0 | |||||
| 2026-02-12 | 13F | Federation des caisses Desjardins du Quebec | 24.620 | -23,08 | 137 | 31,73 | ||||
| 2026-02-13 | 13F | Mariner, LLC | 11.388 | 8,43 | 63 | 80,00 | ||||
| 2025-11-12 | 13F | Transce3nd, LLC | 0 | -100,00 | 0 | |||||
| 2026-02-02 | 13F | Mutual Advisors, LLC | 48.592 | 0,00 | 271 | 36,18 | ||||
| 2026-02-04 | 13F | Ameritas Advisory Services, LLC | 0 | -100,00 | 0 | |||||
| 2026-02-05 | 13F | Tucker Asset Management Llc | 724 | 4 | ||||||
| 2025-11-17 | 13F | Hancock Prospecting Pty Ltd | 0 | -100,00 | 0 | -100,00 | ||||
| 2026-02-10 | 13F | Koss-Olinger Consulting, LLC | 20.999 | -35,97 | 117 | 72,06 | ||||
| 2026-01-26 | 13F | Main Street Group, LTD | 0 | -100,00 | 0 | |||||
| 2026-02-12 | 13F | BlackRock, Inc. | 127.633 | 52,01 | 712 | 154,29 | ||||
| 2026-02-12 | 13F | Hm Payson & Co | 1.980 | 0,00 | 11 | 83,33 | ||||
| 2026-02-17 | 13F | Seldon Capital Lp | 2.148.931 | 18,09 | 11.992 | 97,38 | ||||
| 2026-01-27 | 13F | TD Waterhouse Canada Inc. | 6.995 | 538,81 | 39 | 1.166,67 | ||||
| 2026-02-17 | 13F | Advisory Services Network, LLC | 0 | -100,00 | 0 | |||||
| 2026-01-16 | 13F | Formidable Asset Management, LLC | 315.421 | -8,56 | 1.438 | 52,98 | ||||
| 2026-02-17 | 13F | Cambria Investment Management, L.P. | 24.766 | 138 | ||||||
| 2026-02-10 | 13F | Core Wealth Advisors, Llc | 376 | 2 | ||||||
| 2026-02-06 | 13F | Bare Financial Services, Inc | 190 | 1 | ||||||
| 2026-03-04 | 13F | SHP Wealth Management | 25 | 0 | ||||||
| 2026-02-11 | 13F | LPL Financial LLC | 113.960 | -0,84 | 636 | 65,80 | ||||
| 2025-11-07 | 13F | Atticus Wealth Management, Llc | 0 | -100,00 | 0 | |||||
| 2026-01-13 | 13F | CoreCap Advisors, LLC | 515 | 0,00 | 3 | 100,00 | ||||
| 2026-02-06 | 13F | VSM Wealth Advisory, LLC | 1.000 | 0,00 | 6 | 66,67 | ||||
| 2026-02-13 | 13F | Barclays Plc | 0 | -100,00 | 0 | |||||
| 2026-02-05 | 13F | Allworth Financial LP | 3.430 | 0,00 | 19 | 72,73 | ||||
| 2026-02-13 | 13F | Wells Fargo & Company/mn | 83.597 | -34,62 | 466 | 9,13 | ||||
| 2025-10-31 | 13F | Orion Capital Management LLC | 0 | -100,00 | 0 | |||||
| 2026-02-10 | 13F | Bruce G. Allen Investments, LLC | 185 | 0,00 | 1 | |||||
| 2026-02-03 | 13F | SBI Securities Co., Ltd. | 3.788 | 3,10 | 21 | 75,00 | ||||
| 2026-02-17 | 13F | Jain Global LLC | 36.101 | 201 | ||||||
| 2026-01-29 | 13F | Concord Wealth Partners | 71 | 0,00 | 0 | |||||
| 2026-02-11 | 13F | Jpmorgan Chase & Co | 611.594 | 2.105,69 | 3.413 | 3.608,70 | ||||
| 2026-02-12 | 13F | Jane Street Group, Llc | 440.959 | 12,83 | 2.461 | 88,51 | ||||
| 2025-10-17 | 13F | Perigon Wealth Management, LLC | 0 | -100,00 | 0 | |||||
| 2025-09-29 | NP | ARGT - Global X MSCI Argentina ETF This fund is a listed as child fund of Mirae Asset Global Investments Co., Ltd. and if that institution has disclosed ownership in this security, then these positions will not be double counted when calculating total shares and total value | 2.956.986 | -7,40 | 7.836 | 19,36 | ||||
| 2026-02-17 | 13F | Two Sigma Advisers, Lp | 0 | -100,00 | 0 | |||||
| 2026-02-13 | 13F | Van Eck Associates Corp | 10.251.244 | 6,85 | 57 | 78,13 | ||||
| 2026-01-16 | 13F | Ronald Blue Trust, Inc. | 0 | -100,00 | 0 | |||||
| 2025-09-29 | NP | CCSO - Carbon Collective Climate Solutions U.S. Equity ETF | 5.602 | 0,00 | 15 | 27,27 | ||||
| 2026-02-12 | 13F | Wealthspire Advisors, LLC | 0 | -100,00 | 0 | |||||
| 2026-02-12 | 13F | Steward Partners Investment Advisory, Llc | 400 | 2 | ||||||
| 2026-02-17 | 13F | MIRAE ASSET GLOBAL ETFS HOLDINGS Ltd. | 3.239.522 | -13,69 | 18.083 | 44,32 | ||||
| 2026-02-13 | 13F | Truvestments Capital Llc | 200 | 0,00 | 1 | |||||
| 2026-02-06 | 13F | IFP Advisors, Inc | 16 | 0 | ||||||
| 2026-02-13 | 13F | Quinn Opportunity Partners LLC | 0 | -100,00 | 0 | |||||
| 2026-02-17 | 13F | Millennium Management Llc | 2.200.722 | 441,08 | 12.281 | 804,94 | ||||
| 2026-02-06 | 13F | Leonteq Securities AG | 161 | 1 | ||||||
| 2026-02-17 | 13F | SIH Partners, LLLP | 0 | -100,00 | 0 | -100,00 | ||||
| 2026-01-07 | 13F | Aventura Private Wealth, LLC | 0 | -100,00 | 0 | |||||
| 2026-01-27 | 13F | Gf Fund Management Co. Ltd. | 80.000 | 446 | ||||||
| 2026-02-13 | 13F | MAI Capital Management | 1.875 | 0,00 | 10 | 66,67 | ||||
| 2026-02-23 | 13F | Virtu Financial LLC | 0 | -100,00 | 0 | |||||
| 2026-02-17 | 13F | Raymond James Financial Inc | 16.829 | -18,35 | 94 | 36,76 | ||||
| 2026-02-11 | 13F | Simplex Trading, Llc | 0 | -100,00 | 0 | |||||
| 2026-02-12 | 13F | DRW Securities, LLC | 23.465 | 180 | ||||||
| 2026-02-03 | 13F | McIlrath & Eck, LLC | 1.834 | 0,00 | 10 | 66,67 |