Grundlæggende statistik
| Institutionelle ejere | 149 total, 141 long only, 4 short only, 4 long/short - change of 4,20% MRQ |
| Gennemsnitlig porteføljeallokering | 0.1267 % - change of -26,37% MRQ |
| Institutionelle aktier (lange) | 8.758.550 (ex 13D/G) - change of -2,04MM shares -18,88% MRQ |
| Institutionel værdi (lang) | $ 520.033 USD ($1000) |
Institutionelt ejerskab og aktionærer
SPDR Series Trust - State Street SPDR S&P Insurance ETF (US:KIE) har 149 institutionelle ejere og aktionærer, der har indsendt 13D/G- eller 13F-formularer til Securities Exchange Commission (SEC). Disse institutioner har i alt 8,758,550 aktier. Største aktionærer omfatter Goldman Sachs Group Inc, Shaolin Capital Management LLC, Citigroup Inc, J.Safra Asset Management Corp, Morgan Stanley, Factory Mutual Insurance Co, LPL Financial LLC, Bank Of America Corp /de/, Perbak Capital Partners LLP, and Two Sigma Investments, Lp .
SPDR Series Trust - State Street SPDR S&P Insurance ETF (ARCA:KIE) institutionel ejerskabsstruktur viser aktuelle positioner i virksomheden efter institutioner og fonde, samt seneste ændringer i positionsstørrelse. Større aktionærer kan omfatte individuelle investorer, investeringsforeninger, hedgefonde eller institutioner. Skema 13D angiver, at investoren besidder (eller besidder) mere end 5 % af virksomheden og har til hensigt (eller har til hensigt at) aktivt at forfølge en ændring i forretningsstrategi. Skema 13G indikerer en passiv investering på over 5%.
The share price as of February 27, 2026 is 58,13 / share. Previously, on March 3, 2025, the share price was 60,24 / share. This represents a decline of 3,50% over that period.

Fondens stemningsscore
Fund Sentiment Score (fka Ownership Accumulation Score) finder de aktier, der bliver mest købt af fonde. Det er resultatet af en sofistikeret, multi-faktor kvantitativ model, der identificerer virksomheder med de højeste niveauer af institutionel akkumulering. Scoringsmodellen bruger en kombination af den samlede stigning i oplyste ejere, ændringerne i porteføljeallokeringer i disse ejere og andre målinger. Tallet går fra 0 til 100, hvor højere tal indikerer et højere niveau af akkumulering for sine jævnaldrende, og 50 er gennemsnittet.
Opdateringsfrekvens: Dagligt
Se Ownership Explorer, som giver en liste over højest rangerende virksomheder.
AI+ Ask Fintel’s AI assistant about SPDR Series Trust - State Street SPDR S&P Insurance ETF.
Select a question to share a public post with an AI-crafted answer.
Thinking of good questions…
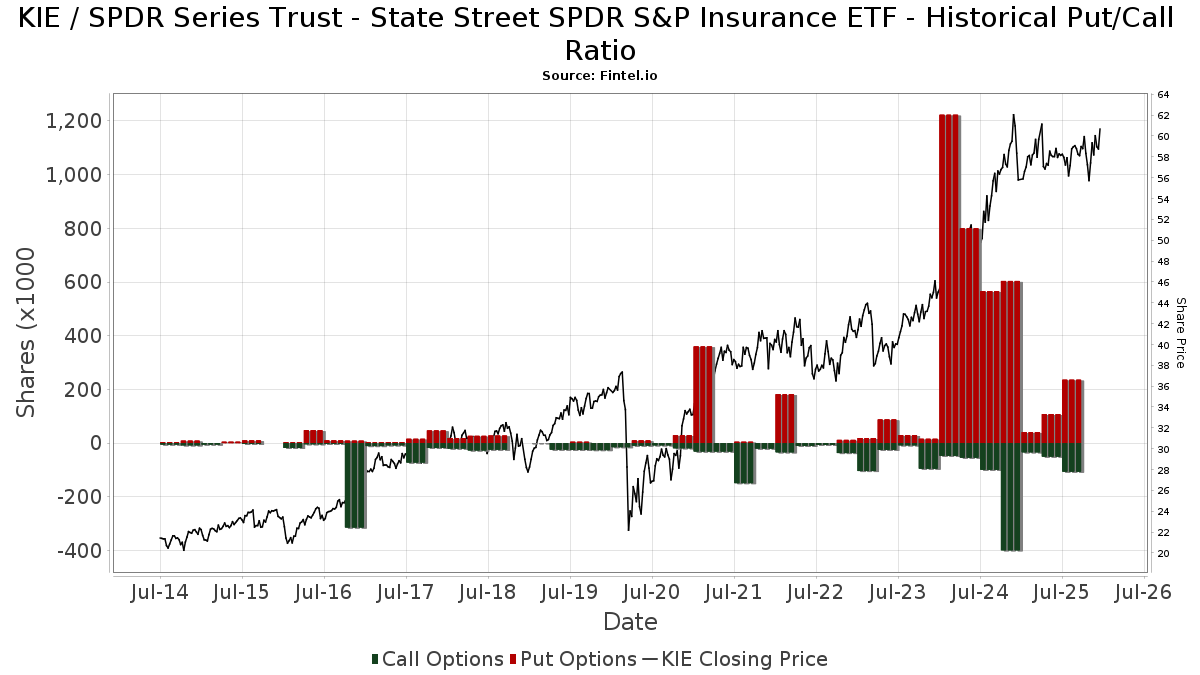
Institutionel Put/Call-forhold
Ud over at indberette standardaktie- og gældsudstedelser skal institutter med mere end 100 mill. aktiver under forvaltning også oplyse deres put- og call-optionsbeholdninger. Da salgsoptioner generelt indikerer negativ stemning, og købsoptioner indikerer positiv stemning, kan vi få en fornemmelse af den overordnede institutionelle stemning ved at plotte forholdet mellem put og kald. Diagrammet til højre viser det historiske put/call-forhold for dette instrument.
Brug af Put/Call Ratio som en indikator for investorernes stemning overvinder en af de vigtigste mangler ved at bruge totalt institutionelt ejerskab, som er, at en betydelig mængde af aktiver under forvaltning investeres passivt for at spore indekser. Passivt forvaltede fonde køber typisk ikke optioner, så indikatoren for put/call-forholdet følger mere nøje følelsen af aktivt forvaltede fonde.
13F og NPORT arkivering
Detaljer om 13F-arkivering er gratis. Detaljer om NP-ansøgninger kræver et premium-medlemskab. Grønne rækker angiver nye positioner. Røde rækker angiver lukkede positioner. Klik på linket ikon for at se den fulde transaktionshistorik.
Opgrader
for at låse premium-data op og eksportere til Excel ![]() .
.
| Fil dato | Kilde | Investor | Type | Gennemsnitlig pris (Øst) |
Aktier | Δ Aktier (%) |
Rapporteret Værdi ($1000) |
Δ Værdi (%) |
Port Alloc (%) |
|
|---|---|---|---|---|---|---|---|---|---|---|
| 2026-02-05 | 13F | Park Square Financial Group, LLC | 0 | -100,00 | 0 | |||||
| 2026-02-17 | 13F | Shaolin Capital Management LLC | Put | 1.250.000 | 75.188 | |||||
| 2026-02-02 | 13F | Cumberland Advisors Inc | 122.910 | -0,63 | 7.393 | 0,76 | ||||
| 2026-02-09 | 13F | Marshall Investment Management, Llc | 0 | -100,00 | 0 | |||||
| 2026-02-12 | 13F | Hollencrest Capital Management | 55 | 0,00 | 3 | 0,00 | ||||
| 2026-02-17 | 13F | Citadel Advisors Llc | Call | 0 | -100,00 | 0 | ||||
| 2026-01-21 | 13F | Sound Income Strategies, LLC | 93 | 0,00 | 5 | 0,00 | ||||
| 2026-01-23 | 13F | Factory Mutual Insurance Co | 605.150 | -1,62 | 36.400 | -0,24 | ||||
| 2025-10-07 | 13F | Salem Investment Counselors Inc | 0 | -100,00 | 0 | |||||
| 2026-02-12 | 13F | Principal Securities, Inc. | 0 | -100,00 | 0 | |||||
| 2026-02-12 | 13F | IFC & Insurance Marketing, Inc. | 2.260 | 0 | ||||||
| 2026-02-10 | 13F | Quantbot Technologies LP | 144 | 9 | ||||||
| 2026-02-14 | 13F | Rockefeller Capital Management L.P. | 10.128 | 12,16 | 609 | 13,83 | ||||
| 2026-02-04 | 13F | Ameritas Advisory Services, LLC | 0 | -100,00 | 0 | |||||
| 2026-02-12 | 13F | BlackRock, Inc. | 3.617 | -11,78 | 218 | -10,70 | ||||
| 2025-11-13 | 13F | Chicago Wealth Management, Inc. | 0 | -100,00 | 0 | |||||
| 2026-02-06 | 13F | IFP Advisors, Inc | 567 | 0,00 | 34 | 3,03 | ||||
| 2026-02-13 | 13F | Ubs Asset Management Americas Inc | 67 | 4 | ||||||
| 2025-10-24 | 13F | Vicus Capital | 0 | -100,00 | 0 | -100,00 | ||||
| 2025-11-12 | 13F | Montag A & Associates Inc | 0 | -100,00 | 0 | |||||
| 2026-02-03 | 13F | Foronjy Financial Llc | 14.957 | 7,31 | 900 | 8,84 | ||||
| 2026-02-10 | 13F/A | Northwestern Mutual Wealth Management Co | 1.019 | -44,74 | 61 | -44,04 | ||||
| 2025-10-31 | 13F | Barrett & Company, Inc. | 0 | -100,00 | 0 | |||||
| 2026-02-13 | 13F/A | Texas Permanent School Fund | 0 | -100,00 | 0 | -100,00 | ||||
| 2026-01-28 | 13F | HB Wealth Management, LLC | 5.760 | 0,00 | 346 | 1,47 | ||||
| 2026-02-09 | 13F | Jefferies Financial Group Inc. | 33.786 | 2.032 | ||||||
| 2026-02-02 | 13F | CX Institutional | 120 | -46,19 | 0 | |||||
| 2026-01-26 | 13F | Private Trust Co Na | 273 | 0,00 | 16 | 0,00 | ||||
| 2025-11-14 | 13F | Strategic Wealth Partners, Ltd. | 372 | 0,00 | 22 | 0,00 | ||||
| 2026-02-13 | 13F | Smartleaf Asset Management LLC | 111 | -67,92 | 7 | -70,00 | ||||
| 2026-02-17 | 13F | D. E. Shaw & Co., Inc. | 212.560 | 1.340,21 | 12.785 | 1.361,14 | ||||
| 2026-02-03 | 13F | International Assets Investment Management, Llc | 89 | 5 | ||||||
| 2026-02-11 | 13F | LPL Financial LLC | 361.980 | -8,06 | 21.773 | -6,77 | ||||
| 2026-01-21 | 13F | Jmac Enterprises Llc | 10.611 | 0,00 | 638 | 1,43 | ||||
| 2026-02-13 | 13F | Arete Wealth Advisors, LLC | 54.449 | 3 | ||||||
| 2025-10-30 | 13F | Investment Management Corp /va/ /adv | 0 | -100,00 | 0 | |||||
| 2026-02-10 | 13F | IFG Advisory, LLC | 0 | -100,00 | 0 | |||||
| 2026-02-17 | 13F | Jain Global LLC | 139.119 | 8.368 | ||||||
| 2025-11-14 | 13F/A | NorthRock Partners, LLC | 0 | -100,00 | 0 | |||||
| 2026-01-21 | 13F | Kaizen Financial Strategies | 7.150 | 0,00 | 430 | 4,62 | ||||
| 2025-11-14 | 13F | 1858 Wealth Management, Llc | 0 | -100,00 | 0 | -100,00 | ||||
| 2026-02-13 | 13F | Arkadios Wealth Advisors | 14.333 | -2,77 | 862 | -1,37 | ||||
| 2026-01-21 | 13F | Jericho Financial, Llp | 0 | -100,00 | 0 | |||||
| 2026-02-17 | 13F | Ameriprise Financial Inc | 63.201 | -2,36 | 3.802 | -1,14 | ||||
| 2026-02-17 | 13F | Cetera Investment Advisers | 16.796 | 3,70 | 1.010 | 5,21 | ||||
| 2026-02-18 | 13F | GWM Advisors LLC | 1.026 | -12,83 | 62 | -11,59 | ||||
| 2026-01-07 | 13F | Central Pacific Bank - Trust Division | 24 | 0,00 | 1 | 0,00 | ||||
| 2026-01-28 | 13F | Provident Wealth Management, LLC | 800 | 0,00 | 48 | 2,13 | ||||
| 2026-02-17 | 13F | Advisor Group Holdings, Inc. | 23.877 | -33,94 | 1.437 | -32,52 | ||||
| 2025-11-25 | 13F | Briaud Financial Planning, Inc | 0 | -100,00 | 0 | |||||
| 2025-11-17 | 13F | FSA Wealth Management LLC | 500 | 0,00 | 30 | 0,00 | ||||
| 2026-02-13 | 13F | Neuberger Berman Group LLC | 12.000 | 0,00 | 722 | 1,41 | ||||
| 2026-02-10 | 13F | Godfrey Financial Associates, Inc. | 104 | 6 | ||||||
| 2026-02-13 | 13F | Stifel Financial Corp | 20.688 | -1,87 | 1.244 | -0,48 | ||||
| 2026-02-11 | 13F | Jpmorgan Chase & Co | 4.505 | -99,68 | 271 | -99,68 | ||||
| 2026-01-30 | 13F | Urban Wealth Management, LLC | 0 | -100,00 | 0 | -100,00 | ||||
| 2026-01-26 | 13F | Cwm, Llc | 1.086 | 1.162,79 | 0 | |||||
| 2025-11-12 | 13F | Ibex Wealth Advisors | 0 | -100,00 | 0 | |||||
| 2026-02-17 | 13F | Advisory Services Network, LLC | 0 | -100,00 | 0 | |||||
| 2026-02-11 | 13F | O'shaughnessy Asset Management, Llc | 248 | 0,00 | 15 | 0,00 | ||||
| 2026-02-17 | 13F | Balyasny Asset Management Llc | Put | 77.500 | 4.662 | |||||
| 2026-01-26 | 13F | Merit Financial Group, LLC | 3.622 | -57,96 | 218 | -57,53 | ||||
| 2026-01-23 | 13F | Farther Finance Advisors, LLC | 411 | 705,88 | 25 | 700,00 | ||||
| 2026-02-17 | 13F | Perennial Investment Advisors, LLC | 3.700 | 0,00 | 223 | 1,37 | ||||
| 2026-02-17 | 13F | Royal Bank Of Canada | 73.540 | 69,72 | 4.424 | 72,14 | ||||
| 2026-01-20 | 13F | Toth Financial Advisory Corp | 12.257 | 0,13 | 737 | 1,52 | ||||
| 2026-02-13 | 13F | National Bank Of Canada /fi/ | 458 | 11,17 | 28 | 12,50 | ||||
| 2026-02-13 | 13F | Blue Jean Financial Llc | 12.466 | 750 | ||||||
| 2026-02-18 | 13F | Garton & Associates Financial Advisors LLC | 195 | 12 | ||||||
| 2025-11-13 | 13F | Mackenzie Financial Corp | 0 | -100,00 | 0 | |||||
| 2026-02-12 | 13F | Jane Street Group, Llc | Call | 6.300 | 379 | |||||
| 2025-11-14 | 13F | Imprint Wealth LLC | 0 | -100,00 | 0 | |||||
| 2026-02-12 | 13F | Jane Street Group, Llc | Put | 6.300 | 379 | |||||
| 2026-02-13 | 13F | Mml Investors Services, Llc | 78.275 | 1,79 | 4.708 | 3,22 | ||||
| 2026-02-04 | 13F | Fourth Dimension Wealth, LLC | 403 | 0,00 | 24 | 4,35 | ||||
| 2025-11-10 | 13F | Choate Investment Advisors | 0 | -100,00 | 0 | |||||
| 2026-02-17 | 13F | Susquehanna International Group, Llp | Put | 126.200 | -0,55 | 7.591 | 0,84 | |||
| 2026-02-17 | 13F | Susquehanna International Group, Llp | Call | 163.900 | 60,69 | 9.859 | 62,94 | |||
| 2026-02-17 | 13F | Bank Of America Corp /de/ | Put | 0 | -100,00 | 0 | ||||
| 2026-01-30 | 13F | Activest Wealth Management | 612 | 0,00 | 37 | 0,00 | ||||
| 2026-02-17 | 13F | Susquehanna International Group, Llp | 9.107 | 142,08 | 548 | 145,29 | ||||
| 2026-01-06 | 13F | Fulcrum Equity Management | 0 | -100,00 | 0 | |||||
| 2026-02-17 | 13F | Jones Financial Companies Lllp | 9.010 | -1,16 | 542 | 0,37 | ||||
| 2026-01-09 | 13F | First Heartland Consultants, Inc. | 6.394 | -4,48 | 385 | -3,27 | ||||
| 2026-01-06 | 13F | Nelson, Van Denburg & Campbell Wealth Management Group, LLC | 6.409 | 0,52 | 385 | 1,85 | ||||
| 2026-02-17 | 13F | Balyasny Asset Management Llc | 184.674 | 11.108 | ||||||
| 2026-02-05 | 13F | Allworth Financial LP | 1.042 | 1.728,07 | 63 | 1.966,67 | ||||
| 2025-11-10 | 13F | Chase Investment Counsel Corp | 0 | -100,00 | 0 | |||||
| 2026-02-17 | 13F | Qube Research & Technologies Ltd | 230.474 | 154.580,54 | 13.863 | 173.187,50 | ||||
| 2026-02-12 | 13F | DRW Securities, LLC | 124.042 | 1.271,84 | 7.461 | 1.291,98 | ||||
| 2026-01-23 | 13F | DHJJ Financial Advisors, Ltd. | 6 | 0,00 | 0 | |||||
| 2026-01-29 | 13F | UBS Group AG | 248.383 | 12,70 | 14.940 | 14,28 | ||||
| 2026-02-12 | 13F | Jane Street Group, Llc | 4.150 | 250 | ||||||
| 2026-02-17 | 13F | Two Sigma Investments, Lp | 281.500 | -45,42 | 16.932 | -44,66 | ||||
| 2026-02-05 | 13F | AlphaCore Capital LLC | 1.535 | 103,58 | 92 | 109,09 | ||||
| 2026-02-05 | 13F | Sherman Asset Management, Inc. | 0 | -100,00 | 0 | |||||
| 2026-02-17 | 13F | Trexquant Investment LP | 5.433 | 22,23 | 327 | 23,95 | ||||
| 2026-01-26 | 13F | AE Wealth Management LLC | 501 | -80,74 | 30 | -80,52 | ||||
| 2026-01-05 | 13F | Rosenberg Matthew Hamilton | 167 | 0,00 | 10 | 11,11 | ||||
| 2026-02-17 | 13F | Css Llc/il | Put | 20.000 | 1.203 | |||||
| 2026-01-23 | 13F | Fifth Third Securities, Inc. | 7.454 | -23,75 | 448 | -22,63 | ||||
| 2026-02-13 | 13F | Wells Fargo & Company/mn | 76.913 | -2,61 | 4.626 | -1,24 | ||||
| 2026-02-12 | 13F | Commonwealth Equity Services, Llc | 13.999 | -15,35 | 842 | |||||
| 2026-01-14 | 13F | Eastern Bank | 2.075 | 0,00 | 125 | 0,81 | ||||
| 2026-01-20 | 13F | AdvisorNet Financial, Inc | 1.113 | 0,54 | 67 | 1,54 | ||||
| 2026-02-17 | 13F | Capital Planning Advisors, LLC | 0 | -100,00 | 0 | |||||
| 2025-11-05 | 13F | SPC Financial, Inc. | 0 | -100,00 | 0 | |||||
| 2026-01-29 | 13F | Kestra Private Wealth Services, Llc | 11.001 | 6,22 | 662 | 7,65 | ||||
| 2025-11-12 | 13F | MGB Wealth Management, LLC | 0 | -100,00 | 0 | -100,00 | ||||
| 2026-02-09 | 13F | Huntington National Bank | 1 | 0,00 | 0 | |||||
| 2026-02-11 | 13F | Manchester Capital Management LLC | 3.300 | 198 | ||||||
| 2025-11-12 | 13F | Transce3nd, LLC | 0 | -100,00 | 0 | |||||
| 2026-02-12 | 13F | Federation des caisses Desjardins du Quebec | 788 | 75,89 | 47 | 80,77 | ||||
| 2026-01-13 | 13F | CoreCap Advisors, LLC | 3.415 | 9,95 | 205 | 11,41 | ||||
| 2026-01-30 | 13F | Us Bancorp \de\ | 2.079 | -3,44 | 125 | -1,57 | ||||
| 2026-02-09 | 13F | Kingsview Wealth Management, LLC | 259.489 | -6,38 | 15.608 | -5,07 | ||||
| 2026-02-10 | 13F | Lido Advisors, LLC | 77.711 | -1,33 | 4.610 | -1,33 | ||||
| 2026-02-13 | 13F | Change Path, LLC | 4.430 | 3,89 | 266 | 5,56 | ||||
| 2026-02-17 | 13F | Russell Investments Group, Ltd. | 397 | 0,00 | 24 | 0,00 | ||||
| 2026-01-28 | 13F | WPG Advisers, LLC | 900 | 0,00 | 54 | 1,89 | ||||
| 2026-01-30 | 13F | Citizens Financial Group Inc/ri | 0 | -100,00 | 0 | |||||
| 2025-11-17 | 13F | Kestra Investment Management, LLC | 0 | -100,00 | 0 | -100,00 | ||||
| 2026-02-13 | 13F | Flow Traders U.s. Llc | 0 | -100,00 | 0 | |||||
| 2026-01-26 | 13F | Key Capital Management, INC | 176 | 11 | ||||||
| 2026-02-13 | 13F | Barclays Plc | 1.592 | 96 | ||||||
| 2025-11-14 | 13F | Walleye Capital LLC | 0 | -100,00 | 0 | |||||
| 2026-01-13 | 13F | Triangle Securities Wealth Management | 76.553 | -2,18 | 4.605 | -0,82 | ||||
| 2026-01-29 | 13F | Nbc Securities, Inc. | 200 | 0,00 | 12 | 9,09 | ||||
| 2025-11-14 | 13F | Hilltop Holdings Inc. | 0 | -100,00 | 0 | -100,00 | ||||
| 2026-02-12 | 13F | Hrt Financial Lp | 0 | -100,00 | 0 | |||||
| 2026-02-17 | 13F | Tudor Investment Corp Et Al | Put | 20.000 | 1.203 | |||||
| 2026-01-23 | 13F | Assetmark, Inc | 290 | 17 | ||||||
| 2026-02-03 | 13F | Orion Capital Management LLC | 176 | 0,57 | 11 | 0,00 | ||||
| 2025-11-13 | 13F | Total Investment Management Inc | 0 | -100,00 | 0 | |||||
| 2026-01-26 | 13F | Main Street Group, LTD | 0 | -100,00 | 0 | |||||
| 2026-02-13 | 13F | Citigroup Inc | 927.695 | -21,52 | 55.801 | -20,43 | ||||
| 2026-02-11 | 13F | J.Safra Asset Management Corp | 719.781 | 3,33 | 43.295 | 4,77 | ||||
| 2025-11-07 | 13F | Amica Retiree Medical Trust | 2.762 | -24,49 | 0 | |||||
| 2026-02-12 | 13F | CIBC Private Wealth Group, LLC | 78 | 0,00 | 5 | 0,00 | ||||
| 2026-02-17 | 13F | Pinnacle Family Advisors, LLC | 5.300 | 319 | ||||||
| 2026-02-13 | 13F | Kestra Advisory Services, LLC | 0 | -100,00 | 0 | |||||
| 2026-02-13 | 13F | Zinnia Wealth Advisory, LLC | 7.849 | 472 | ||||||
| 2025-11-05 | 13F | Waterloo Capital, L.P. | 0 | -100,00 | 0 | |||||
| 2026-01-20 | 13F | Global Trust Asset Management, LLC | 0 | -100,00 | 0 | -100,00 | ||||
| 2026-02-10 | 13F | Rothschild Investment Llc | 5.550 | 0,00 | 334 | 1,22 | ||||
| 2026-02-17 | 13F | Millennium Management Llc | 251.650 | 15.137 | ||||||
| 2025-11-14 | 13F | Skopos Labs, Inc. | 0 | -100,00 | 0 | |||||
| 2026-01-29 | 13F | Comerica Bank | 4.079 | 2,46 | 245 | 3,81 | ||||
| 2026-02-17 | 13F | Raymond James Financial Inc | 53.784 | -14,31 | 3.235 | -13,11 | ||||
| 2026-02-17 | 13F | Perbak Capital Partners LLP | 292.505 | 53,84 | 17.594 | 55,99 | ||||
| 2026-02-13 | 13F | Morgan Stanley | 700.455 | -53,09 | 42.132 | -52,44 | ||||
| 2025-11-19 | 13F | Captrust Financial Advisors | 0 | -100,00 | 0 | |||||
| 2025-11-14 | 13F | Fort Point Capital Partners LLC | 0 | -100,00 | 0 | |||||
| 2026-02-17 | 13F | Fmr Llc | 14.466 | 7,43 | 870 | 9,02 | ||||
| 2026-01-21 | 13F | Crews Bank & Trust | 1.635 | 2,83 | 98 | 4,26 | ||||
| 2025-11-06 | 13F | Cookson Peirce & Co Inc | 0 | -100,00 | 0 | |||||
| 2026-02-11 | 13F | Curio Wealth, Llc | 100 | 6 | ||||||
| 2025-11-14 | 13F | Brevan Howard Capital Management LP | 0 | -100,00 | 0 | |||||
| 2025-12-09 | 13F/A | Tudor Investment Corp Et Al | 0 | -100,00 | 0 | |||||
| 2025-10-22 | 13F | West Paces Advisors Inc. | 0 | -100,00 | 0 | |||||
| 2025-11-14 | 13F | Guardian Wealth Advisors, Llc / Nc | 0 | -100,00 | 0 | -100,00 | ||||
| 2026-02-10 | 13F | Envestnet Asset Management Inc | 34.741 | -16,29 | 2.090 | -15,15 | ||||
| 2026-02-05 | 13F | Cambridge Investment Research Advisors, Inc. | 6.855 | 2,60 | 0 | |||||
| 2025-11-13 | 13F | Private Advisor Group, LLC | 0 | -100,00 | 0 | |||||
| 2026-01-14 | 13F | Spire Wealth Management | 19.794 | 0,00 | 1.191 | 1,36 | ||||
| 2026-02-02 | 13F | Ellis Investment Partners, LLC | 27.851 | 0,21 | 1.675 | 1,64 | ||||
| 2026-02-17 | 13F | Running Point Capital Advisors, LLC | 3.621 | 0,00 | 218 | 1,40 | ||||
| 2026-02-06 | 13F | Pnc Financial Services Group, Inc. | 4.078 | 3,03 | 245 | 4,70 | ||||
| 2026-02-13 | 13F | Y-Intercept (Hong Kong) Ltd | 8.689 | 523 | ||||||
| 2025-11-07 | 13F | HighTower Advisors, LLC | 0 | -100,00 | 0 | -100,00 | ||||
| 2026-02-13 | 13F | Luminist Capital LLC | 28 | 0,00 | 2 | 0,00 | ||||
| 2025-11-03 | 13F | Truist Financial Corp | 0 | -100,00 | 0 | |||||
| 2026-02-06 | 13F | Csenge Advisory Group | 0 | -100,00 | 0 | |||||
| 2026-02-17 | 13F | Bank Of America Corp /de/ | 326.826 | -19,59 | 19.659 | -18,47 | ||||
| 2025-10-17 | 13F | Perigon Wealth Management, LLC | 0 | -100,00 | 0 | |||||
| 2026-01-20 | 13F | Thurston, Springer, Miller, Herd & Titak, Inc. | 258 | 16 | ||||||
| 2026-02-12 | 13F | Bank Of Montreal /can/ | 13.085 | 432,56 | 787 | 442,76 | ||||
| 2026-02-13 | 13F | Gts Securities Llc | 10.088 | 607 | ||||||
| 2026-01-21 | 13F | Flagship Harbor Advisors, Llc | 250 | 15 | ||||||
| 2026-01-28 | 13F | Kingswood Wealth Advisors, Llc | 3.452 | 208 | ||||||
| 2025-11-12 | 13F | Headlands Technologies LLC | 0 | -100,00 | 0 | |||||
| 2025-11-14 | 13F | Integrity Alliance, Llc. | 0 | -100,00 | 0 | -100,00 | ||||
| 2026-02-13 | 13F | Macquarie Group Ltd | 0 | -100,00 | 0 | |||||
| 2025-11-14 | 13F | Navis Wealth Advisors, LLC | 0 | -100,00 | 0 | |||||
| 2026-01-05 | 13F | GoalVest Advisory LLC | 261 | -50,19 | 16 | -51,61 | ||||
| 2025-11-05 | 13F | Bessemer Group Inc | 0 | -100,00 | 0 | |||||
| 2026-02-10 | 13F | Amica Mutual Insurance Co | 28.059 | 0,00 | 2 | 0,00 | ||||
| 2026-01-29 | 13F | Segment Wealth Management, LLC | 4.460 | 0,00 | 268 | 1,52 | ||||
| 2026-02-12 | 13F | Concorde Asset Management, LLC | 0 | -100,00 | 0 | |||||
| 2026-01-14 | 13F | Nova Wealth Management, Inc. | 2.387 | -6,76 | 144 | -5,30 | ||||
| 2026-01-26 | 13F | PFG Investments, LLC | 5.650 | -2,06 | 340 | -0,88 | ||||
| 2026-02-09 | 13F | Cary Street Partners Financial Llc | 6.043 | 0,00 | 363 | 1,40 | ||||
| 2026-02-06 | 13F | GPS Wealth Strategies Group, LLC | 0 | -100,00 | 0 | |||||
| 2026-02-17 | 13F | Citadel Advisors Llc | Put | 271.100 | 1.533,13 | 16.307 | 1.557,11 | |||
| 2026-02-10 | 13F | Goldman Sachs Group Inc | 1.486.296 | 9,06 | 89.401 | 10,58 | ||||
| 2026-02-17 | 13F | Citadel Advisors Llc | 15.885 | -64,00 | 955 | -63,51 | ||||
| 2026-02-17 | 13F | Equitable Holdings, Inc. | 3.887 | 234 | ||||||
| 2026-02-18 | 13F | EP Wealth Advisors, Inc. | 6.516 | -12,14 | 392 | -11,74 | ||||
| 2026-02-12 | 13F | Renaissance Technologies Llc | 0 | -100,00 | 0 | |||||
| 2026-02-06 | 13F | Global Retirement Partners, LLC | 17.863 | -3,24 | 1.074 | -1,92 | ||||
| 2026-02-13 | 13F | Silicon Valley Capital Partners | 614 | 0,49 | 37 | 0,00 | ||||
| 2026-02-09 | 13F | Harbour Investments, Inc. | 396 | 24 | ||||||
| 2026-02-11 | 13F | Janney Montgomery Scott LLC | 15.312 | -0,20 | 1 | |||||
| 2026-02-13 | 13F | MAI Capital Management | 602 | 144,72 | 36 | 157,14 | ||||
| 2025-10-28 | 13F | Fischer Investment Strategies, Llc | 0 | -100,00 | 0 | |||||
| 2026-02-17 | 13F | Jump Financial, LLC | 8.978 | -90,68 | 540 | -90,55 | ||||
| 2026-02-17 | 13F | Two Sigma Securities, Llc | 13.962 | 840 | ||||||
| 2025-11-14 | 13F | Wolverine Trading, Llc | Put | 7.900 | 38,60 | 466 | 37,98 | |||
| 2026-02-17 | 13F | Tower Research Capital LLC (TRC) | 25.325 | -47,98 | 1.523 | -47,25 | ||||
| 2026-01-08 | 13F | Wealth Enhancement Advisory Services, Llc | 4.714 | -25,38 | 283 | -25,33 | ||||
| 2026-02-12 | 13F | FineMark National Bank & Trust | 3.379 | 203 | ||||||
| 2026-02-17 | 13F/A | North Capital, Inc. | 0 | -100,00 | 0 | |||||
| 2025-09-03 | 13F | Q3 Asset Management | 0 | -100,00 | 0 | |||||
| 2026-01-07 | 13F | Harbor Investment Advisory, Llc | 43 | 3 | ||||||
| 2026-01-30 | 13F | Wealthfront Advisers Llc | 7.121 | -3,99 | 428 | -2,51 | ||||
| 2026-02-12 | 13F | Steward Partners Investment Advisory, Llc | 3.738 | 20,81 | 225 | 22,40 | ||||
| 2026-02-13 | 13F | Aptus Capital Advisors, LLC | 100 | 0,00 | 6 | 20,00 | ||||
| 2026-02-13 | 13F | Golden State Wealth Management, LLC | 0 | -100,00 | 0 | |||||
| 2026-01-30 | 13F | North Star Investment Management Corp. | 100 | 0,00 | 6 | 20,00 | ||||
| 2026-02-06 | 13F | Larson Financial Group LLC | 5 | 0,00 | 0 | |||||
| 2026-02-13 | 13F | Marshall Wace, Llp | 55.867 | 3.360 | ||||||
| 2026-02-17 | 13F | Blair William & Co/il | 4.329 | -18,77 | 260 | -17,72 |