Grundlæggende statistik
| Institutionelle ejere | 121 total, 121 long only, 0 short only, 0 long/short - change of -6,87% MRQ |
| Gennemsnitlig porteføljeallokering | 0.2328 % - change of 6,54% MRQ |
| Institutionelle aktier (lange) | 2.606.226 (ex 13D/G) - change of -0,18MM shares -6,46% MRQ |
| Institutionel værdi (lang) | $ 354.857 USD ($1000) |
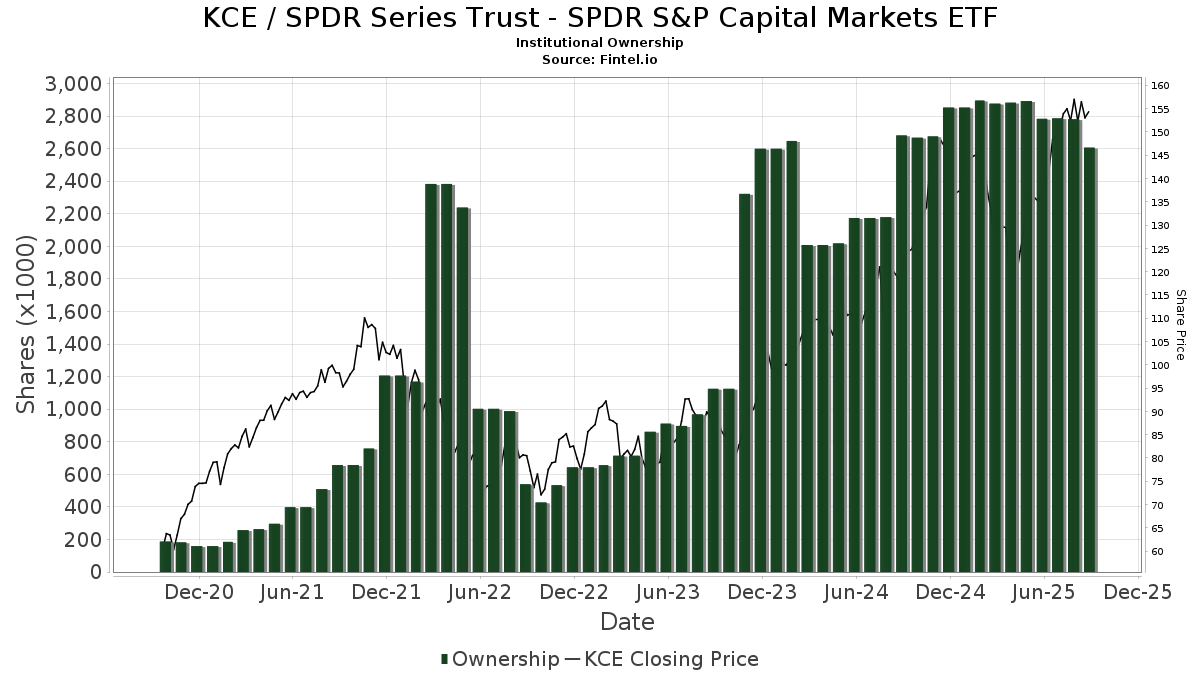
Institutionelt ejerskab og aktionærer
SPDR Series Trust - SPDR S&P Capital Markets ETF (US:KCE) har 121 institutionelle ejere og aktionærer, der har indsendt 13D/G- eller 13F-formularer til Securities Exchange Commission (SEC). Disse institutioner har i alt 2,606,226 aktier. Største aktionærer omfatter Bank Of America Corp /de/, Meitav Dash Investments Ltd, Morgan Stanley, Kranot Hishtalmut Le Morim Ve Gananot Havera Menahelet LTD, LPL Financial LLC, 360 Financial, Inc., UBS Group AG, Thrivent Financial For Lutherans, Grimes & Company, Inc., and Fisher Asset Management, LLC .
SPDR Series Trust - SPDR S&P Capital Markets ETF (ARCA:KCE) institutionel ejerskabsstruktur viser aktuelle positioner i virksomheden efter institutioner og fonde, samt seneste ændringer i positionsstørrelse. Større aktionærer kan omfatte individuelle investorer, investeringsforeninger, hedgefonde eller institutioner. Skema 13D angiver, at investoren besidder (eller besidder) mere end 5 % af virksomheden og har til hensigt (eller har til hensigt at) aktivt at forfølge en ændring i forretningsstrategi. Skema 13G indikerer en passiv investering på over 5%.
The share price as of September 18, 2025 is 157,38 / share. Previously, on September 19, 2024, the share price was 126,01 / share. This represents an increase of 24,89% over that period.
Fondens stemningsscore
Fund Sentiment Score (fka Ownership Accumulation Score) finder de aktier, der bliver mest købt af fonde. Det er resultatet af en sofistikeret, multi-faktor kvantitativ model, der identificerer virksomheder med de højeste niveauer af institutionel akkumulering. Scoringsmodellen bruger en kombination af den samlede stigning i oplyste ejere, ændringerne i porteføljeallokeringer i disse ejere og andre målinger. Tallet går fra 0 til 100, hvor højere tal indikerer et højere niveau af akkumulering for sine jævnaldrende, og 50 er gennemsnittet.
Opdateringsfrekvens: Dagligt
Se Ownership Explorer, som giver en liste over højest rangerende virksomheder.
AI+ Ask Fintel’s AI assistant about SPDR Series Trust - SPDR S&P Capital Markets ETF.
Thinking of good questions…
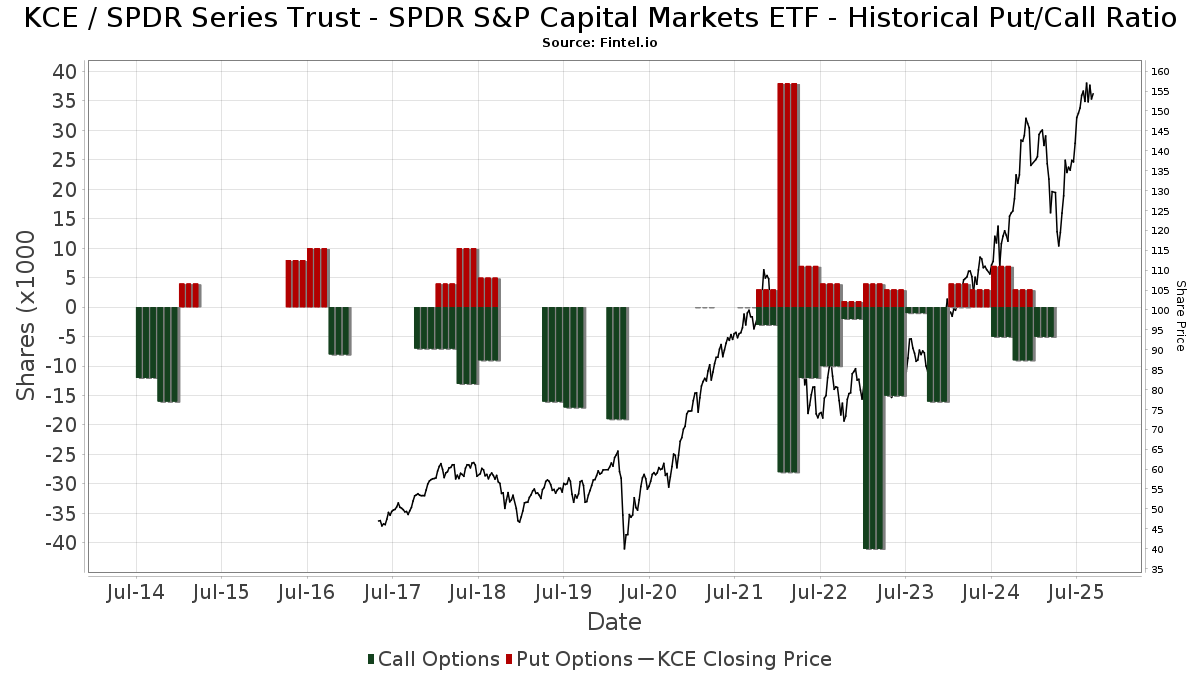
Institutionel Put/Call-forhold
Ud over at indberette standardaktie- og gældsudstedelser skal institutter med mere end 100 mill. aktiver under forvaltning også oplyse deres put- og call-optionsbeholdninger. Da salgsoptioner generelt indikerer negativ stemning, og købsoptioner indikerer positiv stemning, kan vi få en fornemmelse af den overordnede institutionelle stemning ved at plotte forholdet mellem put og kald. Diagrammet til højre viser det historiske put/call-forhold for dette instrument.
Brug af Put/Call Ratio som en indikator for investorernes stemning overvinder en af de vigtigste mangler ved at bruge totalt institutionelt ejerskab, som er, at en betydelig mængde af aktiver under forvaltning investeres passivt for at spore indekser. Passivt forvaltede fonde køber typisk ikke optioner, så indikatoren for put/call-forholdet følger mere nøje følelsen af aktivt forvaltede fonde.
13F og NPORT arkivering
Detaljer om 13F-arkivering er gratis. Detaljer om NP-ansøgninger kræver et premium-medlemskab. Grønne rækker angiver nye positioner. Røde rækker angiver lukkede positioner. Klik på linket ikon for at se den fulde transaktionshistorik.
Opgrader
for at låse premium-data op og eksportere til Excel ![]() .
.
| Fil dato | Kilde | Investor | Type | Gennemsnitlig pris (Øst) |
Aktier | Δ Aktier (%) |
Rapporteret Værdi ($1000) |
Δ Værdi (%) |
Port Alloc (%) |
|
|---|---|---|---|---|---|---|---|---|---|---|
| 2025-05-12 | 13F | Independent Advisor Alliance | 0 | -100,00 | 0 | |||||
| 2025-08-14 | 13F | Mariner, LLC | 17.127 | -20,61 | 2.482 | -8,78 | ||||
| 2025-05-12 | 13F | Jpmorgan Chase & Co | 0 | -100,00 | 0 | |||||
| 2025-07-16 | 13F | TigerOak Management, L.L.C. | 28.340 | -1,31 | 4.107 | 13,39 | ||||
| 2025-08-12 | 13F | CIBC Private Wealth Group, LLC | 1.754 | 0,34 | 254 | 34,39 | ||||
| 2025-08-14 | 13F | Susquehanna International Group, Llp | Call | 0 | -100,00 | 0 | ||||
| 2025-08-07 | 13F | Blackston Financial Advisory Group, LLC | 1.688 | -7,51 | 245 | 6,09 | ||||
| 2025-07-02 | 13F | Central Pacific Bank - Trust Division | 18 | 0,00 | 3 | 0,00 | ||||
| 2025-07-22 | 13F | IMC-Chicago, LLC | 21.878 | -57,51 | 3.171 | -51,20 | ||||
| 2025-07-25 | 13F | Lion Street Advisors, LLC | 1.494 | 217 | ||||||
| 2025-08-12 | 13F | Steward Partners Investment Advisory, Llc | 2.832 | -46,31 | 410 | -38,35 | ||||
| 2025-07-02 | 13F | HBW Advisory Services LLC | 3.189 | -2,18 | 462 | 12,41 | ||||
| 2025-07-30 | 13F | Cavalier Investments, LLC | 26.328 | 0,00 | 3.816 | 14,88 | ||||
| 2025-08-19 | 13F | Asset Dedication, LLC | 85 | 0,00 | 12 | 20,00 | ||||
| 2025-08-19 | 13F | Advisory Services Network, LLC | 0 | -100,00 | 0 | |||||
| 2025-08-12 | 13F | Park Square Financial Group, LLC | 48 | 0,00 | 7 | 0,00 | ||||
| 2025-08-14 | 13F | UBS Group AG | 99.817 | -2,68 | 14.466 | 11,79 | ||||
| 2025-07-24 | 13F | Blair William & Co/il | 399 | -5,90 | 58 | 7,55 | ||||
| 2025-07-22 | 13F | Merit Financial Group, LLC | 16.436 | -63,75 | 2.382 | -58,35 | ||||
| 2025-08-18 | 13F | Hollencrest Capital Management | 5 | 0,00 | 1 | |||||
| 2025-07-30 | NP | ENDW - Cambria Endowment Style ETF | 17 | 2 | ||||||
| 2025-08-14 | 13F | Qube Research & Technologies Ltd | 349 | 226,17 | 51 | 284,62 | ||||
| 2025-08-01 | 13F | Envestnet Asset Management Inc | 19.813 | -0,53 | 2.871 | 14,25 | ||||
| 2025-08-14 | 13F | CoreCap Advisors, LLC | 13 | 0,00 | 2 | 0,00 | ||||
| 2025-08-06 | 13F | Commonwealth Equity Services, Llc | 3.557 | -36,85 | 1 | |||||
| 2025-08-08 | 13F | Good Life Advisors, LLC | 0 | -100,00 | 0 | |||||
| 2025-08-13 | 13F | Walleye Capital LLC | 0 | -100,00 | 0 | |||||
| 2025-08-07 | 13F | Aspen Wealth Strategies, LLC | 14.026 | 12,78 | 2.033 | 29,51 | ||||
| 2025-04-09 | 13F | Kaizen Financial Strategies | 0 | -100,00 | 0 | |||||
| 2025-08-14 | 13F | Jane Street Group, Llc | 8.609 | -44,74 | 1.248 | -36,54 | ||||
| 2025-05-12 | 13F | Founders Financial Securities Llc | 0 | -100,00 | 0 | |||||
| 2025-08-13 | 13F | Royal Fund Management, LLC | 49.817 | 2,59 | 7.235 | 17,41 | ||||
| 2025-09-04 | 13F/A | Advisor Group Holdings, Inc. | 8.806 | -2,60 | 1.265 | 10,87 | ||||
| 2025-07-31 | 13F | Kranot Hishtalmut Le Morim Tichoniim Havera Menahelet LTD | 47.687 | 0,00 | 6.915 | 15,00 | ||||
| 2025-08-14 | 13F | Stifel Financial Corp | 11.824 | 6,85 | 1.714 | 22,71 | ||||
| 2025-08-12 | 13F | Gladstone Institutional Advisory LLC | 5.897 | -1,01 | 855 | 13,72 | ||||
| 2025-08-14 | 13F | Susquehanna International Group, Llp | 12.765 | 19,17 | 1.850 | 36,94 | ||||
| 2025-07-18 | 13F | Vicus Capital | 25.039 | 8,90 | 3.629 | 25,06 | ||||
| 2025-08-14 | 13F | Wells Fargo & Company/mn | 0 | -100,00 | 0 | -100,00 | ||||
| 2025-08-15 | 13F | Provenance Wealth Advisors, LLC | 225 | 0,00 | 33 | 14,29 | ||||
| 2025-08-11 | 13F | Tidemark, LLC | 1.521 | -0,52 | 220 | 14,58 | ||||
| 2025-08-11 | 13F | Principal Securities, Inc. | 210 | 180,00 | 30 | 200,00 | ||||
| 2025-07-17 | 13F | Janney Montgomery Scott LLC | 5.654 | -13,45 | 1 | |||||
| 2025-08-12 | 13F | Proequities, Inc. | 0 | 0 | ||||||
| 2025-08-11 | 13F | HighTower Advisors, LLC | 24.583 | 0,02 | 3.563 | 14,90 | ||||
| 2025-08-26 | 13F/A | Thrivent Financial For Lutherans | 99.019 | 14 | ||||||
| 2025-07-21 | 13F | Ameritas Advisory Services, LLC | 11 | 2 | ||||||
| 2025-08-14 | 13F | Fort Point Capital Partners LLC | 9.359 | 1,99 | 1.356 | 17,20 | ||||
| 2025-08-15 | 13F | Equitable Holdings, Inc. | 1.400 | -53,83 | 203 | -47,12 | ||||
| 2025-08-05 | 13F | Simplex Trading, Llc | 0 | -100,00 | 0 | |||||
| 2025-08-26 | NP | LCR - Leuthold Core ETF | 4.103 | 2,42 | 595 | 17,62 | ||||
| 2025-08-08 | 13F | Avantax Advisory Services, Inc. | 4.614 | 669 | ||||||
| 2025-07-31 | 13F | Orion Capital Management LLC | 76 | 1,33 | 11 | 11,11 | ||||
| 2025-08-04 | 13F | Arkadios Wealth Advisors | 5.115 | 0,00 | 741 | 14,88 | ||||
| 2025-08-11 | 13F | Brown Brothers Harriman & Co | 488 | 0,00 | 71 | 14,75 | ||||
| 2025-08-14 | 13F | D. E. Shaw & Co., Inc. | 3.311 | 0,00 | 480 | 14,87 | ||||
| 2025-05-15 | 13F | Federation des caisses Desjardins du Quebec | 0 | -100,00 | 0 | |||||
| 2025-08-14 | 13F | Bank Of America Corp /de/ | 604.363 | -15,61 | 87.590 | -3,06 | ||||
| 2025-04-17 | 13F | Highline Wealth Partners Llc | 0 | -100,00 | 0 | -100,00 | ||||
| 2025-08-12 | 13F | Global Retirement Partners, LLC | 16 | 6,67 | 2 | 0,00 | ||||
| 2025-07-28 | NP | AGOX - Adaptive Growth Opportunities ETF | 26.328 | 0,00 | 3.556 | -2,50 | ||||
| 2025-08-12 | 13F | BlackRock, Inc. | 11 | 2 | ||||||
| 2025-05-30 | NP | ERNZ - TrueShares Active Yield ETF | 1.347 | 170 | ||||||
| 2025-08-04 | 13F | Whalen Wealth Management Inc. | 0 | -100,00 | 0 | |||||
| 2025-08-14 | 13F | Comerica Bank | 250 | 25,00 | 36 | 44,00 | ||||
| 2025-08-05 | 13F | Advisors Preferred, LLC | 0 | -100,00 | 0 | |||||
| 2025-08-06 | 13F | AE Wealth Management LLC | 572 | -0,17 | 83 | 13,89 | ||||
| 2025-08-13 | 13F | Leuthold Group, Llc | 4.402 | 2,42 | 638 | 17,53 | ||||
| 2025-05-01 | 13F | Coastal Investment Advisors, Inc. | 0 | -100,00 | 0 | |||||
| 2025-08-14 | 13F | DHK Financial Advisors, Inc. | 10.093 | 0,42 | 1.463 | 15,30 | ||||
| 2025-07-23 | 13F | Meitav Dash Investments Ltd | 262.315 | 0,01 | 38.017 | 14,88 | ||||
| 2025-07-29 | 13F | Stephens Inc /ar/ | 5.538 | -0,23 | 803 | 14,57 | ||||
| 2025-08-14 | 13F | Goldman Sachs Group Inc | 4.237 | 103,02 | 614 | 133,46 | ||||
| 2025-07-10 | 13F | Global Financial Private Client, LLC | 8.126 | -0,05 | 1.178 | 14,83 | ||||
| 2025-07-17 | 13F | City Holding Co | 45 | 0,00 | 7 | 20,00 | ||||
| 2025-07-28 | 13F | Harbour Investments, Inc. | 51 | 0,00 | 7 | 16,67 | ||||
| 2025-08-15 | 13F | Kestra Advisory Services, LLC | 7.182 | 0,79 | 1.041 | 15,68 | ||||
| 2025-08-08 | 13F | Pnc Financial Services Group, Inc. | 3.004 | -4,85 | 435 | 9,30 | ||||
| 2025-08-13 | 13F | Baker Avenue Asset Management, LP | 29.859 | 4,21 | 4.327 | 19,70 | ||||
| 2025-04-11 | 13F | IAM Advisory, LLC | 0 | -100,00 | 0 | -100,00 | ||||
| 2025-07-10 | 13F | HF Advisory Group, LLC | 2.706 | 0,89 | 392 | 15,98 | ||||
| 2025-05-01 | 13F | Fulcrum Equity Management | 0 | -100,00 | 0 | |||||
| 2025-08-13 | 13F | Flow Traders U.s. Llc | 0 | -100,00 | 0 | |||||
| 2025-08-15 | 13F | Tower Research Capital LLC (TRC) | 4.673 | -63,82 | 677 | -58,44 | ||||
| 2025-08-14 | 13F | Royal Bank Of Canada | 11.366 | 200,21 | 1.648 | 245,49 | ||||
| 2025-08-04 | 13F | Assetmark, Inc | 769 | -68,21 | 111 | -63,61 | ||||
| 2025-08-14 | 13F | Citadel Advisors Llc | Call | 0 | -100,00 | 0 | ||||
| 2025-08-14 | 13F | Citadel Advisors Llc | Put | 0 | -100,00 | 0 | ||||
| 2025-08-01 | 13F | Ferguson Shapiro LLC | 4.855 | -13,38 | 704 | -0,57 | ||||
| 2025-07-30 | 13F | Nottingham Advisors, Inc. | 44.118 | 0,42 | 6.394 | 15,33 | ||||
| 2025-04-30 | 13F | Stratos Wealth Advisors, LLC | 0 | -100,00 | 0 | -100,00 | ||||
| 2025-08-12 | 13F | Franklin Resources Inc | 112 | 16 | ||||||
| 2025-05-15 | 13F | Two Sigma Investments, Lp | 0 | -100,00 | 0 | |||||
| 2025-08-14 | 13F | Money Concepts Capital Corp | 9.421 | -4,04 | 1.365 | 10,26 | ||||
| 2025-05-08 | NP | QALTX - Quantified Alternative Investment Fund Investor Class Shares | 417 | -68,39 | 53 | -71,27 | ||||
| 2025-04-14 | 13F | Courier Capital Llc | 0 | -100,00 | 0 | |||||
| 2025-05-12 | 13F | AMJ Financial Wealth Management | 0 | -100,00 | 0 | |||||
| 2025-08-04 | 13F | IFG Advisory, LLC | 0 | -100,00 | 0 | |||||
| 2025-07-25 | 13F | Community Bank, N.A. | 20.638 | 5,62 | 2.991 | 21,34 | ||||
| 2025-07-07 | 13F | Nova Wealth Management, Inc. | 1.595 | 13,60 | 231 | 30,51 | ||||
| 2025-08-12 | 13F | O'shaughnessy Asset Management, Llc | 28 | -37,78 | 4 | -20,00 | ||||
| 2025-07-10 | 13F | Peoples Bank/KS | 0 | -100,00 | 0 | |||||
| 2025-07-14 | 13F | Masso Torrence Wealth Management Inc. | 24.442 | -4,62 | 3.542 | 9,56 | ||||
| 2025-08-13 | 13F | Colonial Trust Co / SC | 41 | 0,00 | 6 | 0,00 | ||||
| 2025-07-23 | 13F | Fluent Financial, LLC | 20.292 | 2.941 | ||||||
| 2025-05-08 | 13F | Geneos Wealth Management Inc. | 0 | -100,00 | 0 | |||||
| 2025-08-06 | 13F | Legacy Wealth Managment, LLC/ID | 77 | 0,00 | 11 | 22,22 | ||||
| 2025-07-30 | 13F | WESPAC Advisors SoCal, LLC | 11.910 | -1,72 | 1.726 | 12,88 | ||||
| 2025-08-05 | 13F | Provident Co of the Employees of the Hebrew University LTD | 27.651 | 0,00 | 4.010 | 15,00 | ||||
| 2025-07-21 | 13F | Mirae Asset Global Investments Co., Ltd. | 1.000 | 145 | ||||||
| 2025-08-06 | 13F | 360 Financial, Inc. | 102.569 | 4,27 | 14.865 | 19,77 | ||||
| 2025-07-11 | 13F | Spence Asset Management | 16.901 | 2,65 | 2 | 0,00 | ||||
| 2025-08-06 | 13F | Legacy Investment Solutions, LLC | 77 | 0,00 | 11 | 0,00 | ||||
| 2025-07-25 | 13F | Atria Wealth Solutions, Inc. | 0 | -100,00 | 0 | |||||
| 2025-07-28 | 13F | Rosenberg Matthew Hamilton | 0 | -100,00 | 0 | |||||
| 2025-08-14 | 13F | GWM Advisors LLC | 2.099 | -4,24 | 304 | 10,14 | ||||
| 2025-08-01 | 13F | Delta Investment Management, LLC | 2.052 | -17,29 | 297 | -5,11 | ||||
| 2025-08-06 | 13F/A | Headland Capital, LLC | 2.616 | -8,31 | 379 | 5,57 | ||||
| 2025-08-14 | 13F | Fmr Llc | 1.516 | 5,72 | 220 | 21,67 | ||||
| 2025-07-22 | 13F | Accel Wealth Management | 13.408 | 10,86 | 1.943 | 27,41 | ||||
| 2025-07-22 | 13F | Miracle Mile Advisors, LLC | 0 | -100,00 | 0 | |||||
| 2025-07-31 | 13F | Cambridge Investment Research Advisors, Inc. | 7.321 | -18,05 | 1 | 0,00 | ||||
| 2025-08-06 | 13F | Csenge Advisory Group | 9.783 | 2,69 | 1.321 | 18,58 | ||||
| 2025-08-13 | 13F | Northwestern Mutual Wealth Management Co | 1.704 | 6,70 | 247 | 22,89 | ||||
| 2025-07-08 | 13F | Parallel Advisors, LLC | 174 | -7,45 | 25 | 8,70 | ||||
| 2025-07-29 | 13F | Private Trust Co Na | 850 | -20,41 | 123 | -8,21 | ||||
| 2025-07-17 | 13F | Global Trust Asset Management, LLC | 0 | -100,00 | 0 | |||||
| 2025-05-15 | 13F | Hrt Financial Lp | 0 | -100,00 | 0 | |||||
| 2025-08-05 | 13F | Bank Of Montreal /can/ | 615 | 0,00 | 89 | 15,58 | ||||
| 2025-07-23 | 13F | Foresight Capital Management Advisors, Inc. | 0 | -100,00 | 0 | |||||
| 2025-08-15 | 13F | Morgan Stanley | 225.991 | -23,21 | 32.753 | -11,80 | ||||
| 2025-08-05 | 13F | Tsfg, Llc | 45 | 0,00 | 0 | |||||
| 2025-08-14 | 13F | EP Wealth Advisors, Inc. | 1.191 | 0,00 | 173 | 14,67 | ||||
| 2025-05-02 | 13F | Fortis Group Advisors, LLC | 0 | -100,00 | 0 | |||||
| 2025-08-11 | 13F | Private Advisor Group, LLC | 4.924 | -5,58 | 714 | 8,36 | ||||
| 2025-04-21 | 13F | Trivant Custom Portfolio Group, LLC | 0 | -100,00 | 0 | |||||
| 2025-05-06 | 13F | Proficio Capital Partners LLC | 0 | -100,00 | 0 | -100,00 | ||||
| 2025-07-15 | 13F | Main Street Group, LTD | 145 | 0,00 | 21 | 16,67 | ||||
| 2025-07-17 | 13F | Independence Bank of Kentucky | 25 | 0,00 | 4 | 0,00 | ||||
| 2025-08-04 | 13F | Spire Wealth Management | 0 | -100,00 | 0 | |||||
| 2025-08-14 | 13F | Citadel Advisors Llc | 7.731 | 29,43 | 1.120 | 48,74 | ||||
| 2025-08-26 | 13F | Claris Financial LLC | 0 | -100,00 | 0 | |||||
| 2025-08-14 | 13F | Mml Investors Services, Llc | 22.478 | -2,22 | 3 | 50,00 | ||||
| 2025-04-29 | 13F | Quattro Financial Advisors Llc | 0 | -100,00 | 0 | |||||
| 2025-08-14 | 13F | MGB Wealth Management, LLC | 1.097 | 0,00 | 159 | 14,49 | ||||
| 2025-07-08 | 13F | Nbc Securities, Inc. | 0 | -100,00 | 0 | |||||
| 2025-08-14 | 13F | Sunbelt Securities, Inc. | 53 | 0,00 | 7 | 16,67 | ||||
| 2025-07-11 | 13F | Farther Finance Advisors, LLC | 22 | -53,19 | 3 | -40,00 | ||||
| 2025-07-15 | 13F | MCF Advisors LLC | 173 | 0,00 | 25 | 19,05 | ||||
| 2025-08-13 | 13F | Custom Index Systems, Llc | 2.016 | -55,38 | 292 | -48,77 | ||||
| 2025-08-12 | 13F | Coldstream Capital Management Inc | 0 | -100,00 | 0 | |||||
| 2025-08-14 | 13F | Raymond James Financial Inc | 23.258 | -12,88 | 3.371 | 0,06 | ||||
| 2025-07-31 | 13F | Oppenheimer & Co Inc | 11.507 | 3,73 | 1.668 | 19,16 | ||||
| 2025-07-15 | 13F | Cranbrook Wealth Management, LLC | 20 | 0,00 | 3 | 0,00 | ||||
| 2025-07-31 | 13F | Kranot Hishtalmut Le Morim Ve Gananot Havera Menahelet LTD | 138.163 | 0,00 | 20.036 | 15,00 | ||||
| 2025-07-31 | 13F | Wealthfront Advisers Llc | 4.203 | 2,54 | 609 | 17,79 | ||||
| 2025-08-08 | 13F | Larson Financial Group LLC | 358 | -3,76 | 52 | 10,87 | ||||
| 2025-08-08 | 13F | Gts Securities Llc | 14.397 | 2.087 | ||||||
| 2025-08-14 | 13F | Barometer Capital Management Inc. | 900 | 130 | ||||||
| 2025-08-12 | 13F | LPL Financial LLC | 131.811 | -12,79 | 19.103 | 0,18 | ||||
| 2025-08-08 | 13F | Cetera Investment Advisers | 5.593 | -2,59 | 811 | 11,88 | ||||
| 2025-07-22 | 13F | Grimes & Company, Inc. | 53.775 | 7.794 | ||||||
| 2025-07-15 | 13F | Financial Management Professionals, Inc. | 0 | -100,00 | 0 | |||||
| 2025-08-13 | 13F | Fisher Asset Management, LLC | 51.469 | -21,61 | 7.459 | -9,96 |