Grundlæggende statistik
| Institutionelle ejere | 241 total, 238 long only, 0 short only, 3 long/short - change of 0,83% MRQ |
| Gennemsnitlig porteføljeallokering | 0.3389 % - change of 27,24% MRQ |
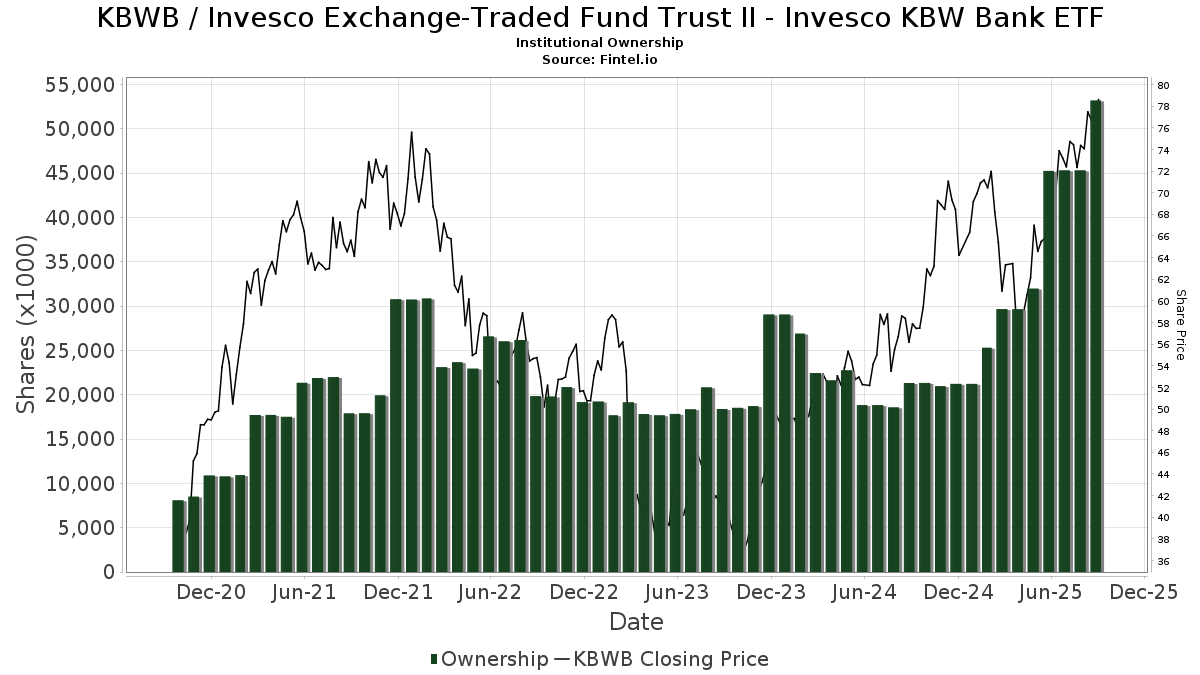
| Institutionelle aktier (lange) | 53.187.480 (ex 13D/G) - change of 7,94MM shares 17,54% MRQ |
| Institutionel værdi (lang) | $ 2.759.730 USD ($1000) |
Institutionelt ejerskab og aktionærer
Invesco Exchange-Traded Fund Trust II - Invesco KBW Bank ETF (US:KBWB) har 241 institutionelle ejere og aktionærer, der har indsendt 13D/G- eller 13F-formularer til Securities Exchange Commission (SEC). Disse institutioner har i alt 53,187,480 aktier. Største aktionærer omfatter Bank Of America Corp /de/, Migdal Insurance & Financial Holdings Ltd., Clal Insurance Enterprises Holdings Ltd, Jpmorgan Chase & Co, Menora Mivtachim Holdings Ltd., Fisher Asset Management, LLC, Goldman Sachs Group Inc, Harel Insurance Investments & Financial Services Ltd., Wharton Business Group, LLC, and Morgan Stanley .
Invesco Exchange-Traded Fund Trust II - Invesco KBW Bank ETF (NasdaqGM:KBWB) institutionel ejerskabsstruktur viser aktuelle positioner i virksomheden efter institutioner og fonde, samt seneste ændringer i positionsstørrelse. Større aktionærer kan omfatte individuelle investorer, investeringsforeninger, hedgefonde eller institutioner. Skema 13D angiver, at investoren besidder (eller besidder) mere end 5 % af virksomheden og har til hensigt (eller har til hensigt at) aktivt at forfølge en ændring i forretningsstrategi. Skema 13G indikerer en passiv investering på over 5%.
The share price as of September 11, 2025 is 78,03 / share. Previously, on September 12, 2024, the share price was 56,05 / share. This represents an increase of 39,21% over that period.
Fondens stemningsscore
Fund Sentiment Score (fka Ownership Accumulation Score) finder de aktier, der bliver mest købt af fonde. Det er resultatet af en sofistikeret, multi-faktor kvantitativ model, der identificerer virksomheder med de højeste niveauer af institutionel akkumulering. Scoringsmodellen bruger en kombination af den samlede stigning i oplyste ejere, ændringerne i porteføljeallokeringer i disse ejere og andre målinger. Tallet går fra 0 til 100, hvor højere tal indikerer et højere niveau af akkumulering for sine jævnaldrende, og 50 er gennemsnittet.
Opdateringsfrekvens: Dagligt
Se Ownership Explorer, som giver en liste over højest rangerende virksomheder.
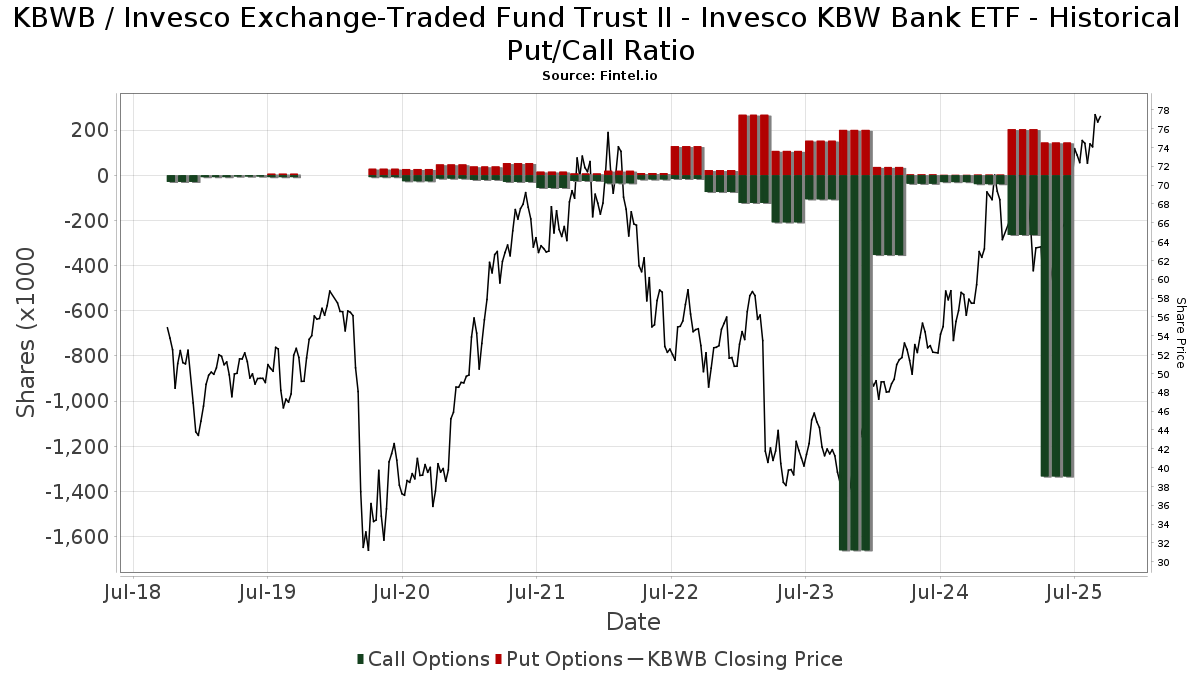
Institutionel Put/Call-forhold
Ud over at indberette standardaktie- og gældsudstedelser skal institutter med mere end 100 mill. aktiver under forvaltning også oplyse deres put- og call-optionsbeholdninger. Da salgsoptioner generelt indikerer negativ stemning, og købsoptioner indikerer positiv stemning, kan vi få en fornemmelse af den overordnede institutionelle stemning ved at plotte forholdet mellem put og kald. Diagrammet til højre viser det historiske put/call-forhold for dette instrument.
Brug af Put/Call Ratio som en indikator for investorernes stemning overvinder en af de vigtigste mangler ved at bruge totalt institutionelt ejerskab, som er, at en betydelig mængde af aktiver under forvaltning investeres passivt for at spore indekser. Passivt forvaltede fonde køber typisk ikke optioner, så indikatoren for put/call-forholdet følger mere nøje følelsen af aktivt forvaltede fonde.
13F og NPORT arkivering
Detaljer om 13F-arkivering er gratis. Detaljer om NP-ansøgninger kræver et premium-medlemskab. Grønne rækker angiver nye positioner. Røde rækker angiver lukkede positioner. Klik på linket ikon for at se den fulde transaktionshistorik.
Opgrader
for at låse premium-data op og eksportere til Excel ![]() .
.
| Fil dato | Kilde | Investor | Type | Gennemsnitlig pris (Øst) |
Aktier | Δ Aktier (%) |
Rapporteret Værdi ($1000) |
Δ Værdi (%) |
Port Alloc (%) |
|
|---|---|---|---|---|---|---|---|---|---|---|
| 2025-07-17 | 13F | Janney Montgomery Scott LLC | 14.086 | 2,09 | 1 | |||||
| 2025-07-24 | 13F | Blair William & Co/il | 433 | -98,65 | 31 | -98,46 | ||||
| 2025-08-06 | 13F | Hallmark Capital Management Inc | 253.642 | 15,30 | 18.166 | 31,55 | ||||
| 2025-07-16 | 13F | Magnus Financial Group LLC | 20.428 | 14,91 | 1.463 | 31,21 | ||||
| 2025-08-13 | 13F | Baird Financial Group, Inc. | 0 | -100,00 | 0 | |||||
| 2025-08-14 | 13F | Federation des caisses Desjardins du Quebec | 16.087 | -2,92 | 1.152 | 10,77 | ||||
| 2025-08-14 | 13F | Tudor Investment Corp Et Al | 30.170 | 817,58 | 2.161 | 948,54 | ||||
| 2025-07-14 | 13F | AdvisorNet Financial, Inc | 13.339 | -1,28 | 955 | 12,62 | ||||
| 2025-07-21 | 13F | Ameritas Advisory Services, LLC | 1.193 | 85 | ||||||
| 2025-08-04 | 13F | Creative Financial Designs Inc /adv | 46 | 0,00 | 3 | 50,00 | ||||
| 2025-07-24 | NP | HASAX - Horizon Active Asset Allocation Fund Advisor Class | 349.309 | 5,47 | 22.918 | -0,58 | ||||
| 2025-08-12 | 13F | Change Path, LLC | 10.043 | 12,17 | 719 | 28,16 | ||||
| 2025-08-14 | 13F | Gotham Asset Management, LLC | 10.000 | 0,00 | 716 | 14,19 | ||||
| 2025-08-12 | 13F | Franklin Resources Inc | 7.506 | 538 | ||||||
| 2025-08-26 | NP | LCR - Leuthold Core ETF | 8.561 | 2,64 | 613 | 17,21 | ||||
| 2025-07-28 | 13F | Harbour Investments, Inc. | 250 | -6,02 | 18 | 6,25 | ||||
| 2025-08-14 | 13F | Two Sigma Securities, Llc | 0 | -100,00 | 0 | |||||
| 2025-08-08 | 13F | WP Advisors, LLC | 93.352 | 0,95 | 6.686 | 15,18 | ||||
| 2025-08-12 | 13F | Quadcap Wealth Management, LLC | 54.782 | -0,66 | 3.923 | 13,35 | ||||
| 2025-05-15 | 13F | Glenmede Trust Co Na | 4.890 | 0,00 | 307 | -4,08 | ||||
| 2025-08-14 | 13F | Broadleaf Partners, LLC | 4.841 | 0,00 | 347 | 14,19 | ||||
| 2025-07-23 | 13F | Meitav Dash Investments Ltd | 40.455 | 60,66 | 2.897 | 83,35 | ||||
| 2025-08-15 | 13F | Morgan Stanley | 1.109.116 | 7,65 | 79.435 | 22,83 | ||||
| 2025-05-05 | 13F | Montag A & Associates Inc | 0 | -100,00 | 0 | |||||
| 2025-08-13 | 13F | Quadrature Capital Ltd | 0 | -100,00 | 0 | |||||
| 2025-08-13 | 13F | Sanibel Captiva Trust Company, Inc. | 5.120 | 0,00 | 367 | 14,02 | ||||
| 2025-05-15 | 13F | CAPROCK Group, Inc. | 3.831 | 5,07 | 240 | 0,84 | ||||
| 2025-08-14 | 13F | UBS Group AG | 343.850 | 17,58 | 24.627 | 34,16 | ||||
| 2025-08-12 | 13F | Financial Advocates Investment Management | 0 | -100,00 | 0 | |||||
| 2025-08-14 | 13F | Ieq Capital, Llc | 4.954 | 55,10 | 355 | 77,00 | ||||
| 2025-08-14 | 13F | UBS Group AG | Call | 268.100 | 19.201 | |||||
| 2025-08-13 | 13F | Advocacy Wealth Management Services, LLC | 38.543 | -17,17 | 2.760 | -5,48 | ||||
| 2025-08-14 | 13F | Fosun International Ltd | 0 | -100,00 | 0 | |||||
| 2025-07-10 | 13F | Rockland Trust Co | 15.335 | -7,54 | 1.098 | 5,48 | ||||
| 2025-08-14 | 13F | Comerica Bank | 1.755 | 47,60 | 126 | 68,92 | ||||
| 2025-08-13 | 13F | Collar Capital Management, LLC | 2.969 | 213 | ||||||
| 2025-08-14 | 13F | Aragon Global Management, LP | 0 | -100,00 | 0 | |||||
| 2025-07-30 | 13F | WESPAC Advisors SoCal, LLC | 18.716 | -2,16 | 1.340 | 11,67 | ||||
| 2025-04-22 | 13F | Synergy Financial Management, LLC | 0 | -100,00 | 0 | |||||
| 2025-07-24 | 13F | Mainstay Capital Management Llc /adv | 15.126 | -8,20 | 1.083 | 4,74 | ||||
| 2025-07-30 | 13F | Axecap Investments, LLC | 0 | -100,00 | 0 | |||||
| 2025-08-12 | 13F | Aviso Financial Inc. | 98 | 7 | ||||||
| 2025-08-14 | 13F | Pentwater Capital Management LP | Put | 0 | -100,00 | 0 | ||||
| 2025-07-21 | 13F | Mirae Asset Global Investments Co., Ltd. | 12.388 | 887 | ||||||
| 2025-08-04 | 13F | Hantz Financial Services, Inc. | 66 | 0 | ||||||
| 2025-08-14 | 13F | Ulysses Management LLC | 0 | -100,00 | 0 | -100,00 | ||||
| 2025-08-19 | 13F | Delos Wealth Advisors, LLC | 31.291 | -8,03 | 2.241 | 4,96 | ||||
| 2025-08-13 | 13F | Twin Peaks Wealth Advisors, LLC | 100 | 7 | ||||||
| 2025-08-14 | 13F | Quantinno Capital Management LP | 41.976 | 2,79 | 3.006 | 17,28 | ||||
| 2025-07-08 | 13F | Webster Bank, N. A. | 861 | 0,00 | 62 | 12,96 | ||||
| 2025-08-13 | 13F | Cerity Partners LLC | 5.213 | 2,64 | 373 | 17,30 | ||||
| 2025-08-13 | 13F | Flow Traders U.s. Llc | 5.612 | -73,64 | 0 | -100,00 | ||||
| 2025-08-08 | 13F | Capital Investment Advisory Services, LLC | 0 | -100,00 | 0 | |||||
| 2025-08-13 | 13F | Capital Analysts, Inc. | 54 | -25,00 | 0 | |||||
| 2025-07-11 | 13F | Farther Finance Advisors, LLC | 1.243 | -83,80 | 89 | -81,38 | ||||
| 2025-05-16 | 13F | Laidlaw Wealth Management LLC | 0 | -100,00 | 0 | |||||
| 2025-08-13 | 13F | M&t Bank Corp | 5.000 | 0,00 | 358 | 14,38 | ||||
| 2025-07-18 | 13F | PFG Investments, LLC | 3.860 | 0,00 | 276 | 14,05 | ||||
| 2025-08-04 | 13F | Atria Investments Llc | 3.531 | -49,82 | 253 | -42,86 | ||||
| 2025-08-08 | 13F | Hartland & Co., LLC | 372 | 0,27 | 27 | 13,04 | ||||
| 2025-08-11 | 13F | Tidemark, LLC | 194 | 0,00 | 14 | 8,33 | ||||
| 2025-08-13 | 13F | Congress Wealth Management LLC / DE / | 692.760 | -27,52 | 49.616 | -17,31 | ||||
| 2025-07-24 | 13F | Stonebridge Financial Group, LLC | 0 | -100,00 | 0 | |||||
| 2025-08-14 | 13F | Wharton Business Group, LLC | 1.914.019 | 6,56 | 137 | 21,43 | ||||
| 2025-08-07 | 13F | Investment Management Corp /va/ /adv | 12.927 | 2,25 | 926 | 16,65 | ||||
| 2025-05-14 | 13F | Joseph P. Lucia & Associates, LLC | 0 | -100,00 | 0 | |||||
| 2025-07-24 | 13F | IFP Advisors, Inc | 132 | 9 | ||||||
| 2025-08-12 | 13F | Jpmorgan Chase & Co | 3.503.711 | 117,74 | 250.936 | 148,44 | ||||
| 2025-08-12 | 13F | Global Retirement Partners, LLC | 11.391 | -3,65 | 816 | 5,57 | ||||
| 2025-04-21 | 13F | Nelson, Van Denburg & Campbell Wealth Management Group, LLC | 0 | -100,00 | 0 | |||||
| 2025-07-03 | 13F | City Center Advisors, LLC | 7.777 | 1,79 | 557 | 16,28 | ||||
| 2025-05-05 | 13F | J.w. Cole Advisors, Inc. | 0 | -100,00 | 0 | -100,00 | ||||
| 2025-08-04 | 13F | One Day In July LLC | 7.112 | -15,33 | 509 | -3,42 | ||||
| 2025-08-13 | 13F | Custom Index Systems, Llc | 4.127 | 0,27 | 296 | 14,34 | ||||
| 2025-08-14 | 13F | BTG Pactual Asset Management US LLC | 1.150 | 82 | ||||||
| 2025-08-08 | 13F | Altfest L J & Co Inc | 169.626 | 3.328,17 | 12.149 | 3.818,71 | ||||
| 2025-08-12 | 13F | XTX Topco Ltd | 9.806 | 702 | ||||||
| 2025-07-28 | 13F | WealthPlan Investment Management, LLC | 3.176 | 227 | ||||||
| 2025-08-14 | 13F | Nan Shan Life Insurance Co., Ltd. | 99.650 | 0,00 | 7.137 | 14,08 | ||||
| 2025-08-14 | 13F | Guardian Wealth Advisors, Llc / Nc | 0 | -100,00 | 0 | |||||
| 2025-08-14 | 13F | Jain Global LLC | 14.842 | 1.063 | ||||||
| 2025-08-08 | 13F | Pnc Financial Services Group, Inc. | 2.213 | -7,29 | 158 | 6,04 | ||||
| 2025-08-13 | 13F | Jones Financial Companies Lllp | 5.256 | 29,62 | 374 | 48,61 | ||||
| 2025-05-14 | 13F | CI Private Wealth, LLC | 0 | -100,00 | 0 | -100,00 | ||||
| 2025-07-22 | 13F | SOL Capital Management CO | 283.134 | -0,33 | 20 | 17,65 | ||||
| 2025-08-14 | 13F | Royal Bank Of Canada | 753.504 | 59,98 | 53.967 | 82,54 | ||||
| 2025-08-13 | 13F | Leuthold Group, Llc | 9.210 | 2,76 | 660 | 17,26 | ||||
| 2025-07-29 | 13F | Stephens Inc /ar/ | 82.050 | -0,04 | 5.876 | 14,05 | ||||
| 2025-08-11 | 13F | Citigroup Inc | 744.956 | 600,70 | 53.354 | 699,54 | ||||
| 2025-07-17 | 13F | Sound Income Strategies, LLC | 161 | 0,62 | 12 | 10,00 | ||||
| 2025-07-28 | 13F | BRYN MAWR TRUST Co | 4.997 | -2,84 | 358 | 10,87 | ||||
| 2025-08-14 | 13F | Wells Fargo & Company/mn | 417.804 | 2,23 | 29.923 | 16,64 | ||||
| 2025-08-11 | 13F | TD Waterhouse Canada Inc. | 3.419 | 3.156,19 | 249 | 4.033,33 | ||||
| 2025-08-13 | 13F | Quantbot Technologies LP | 0 | -100,00 | 0 | |||||
| 2025-08-14 | 13F | Ulysses Management LLC | Call | 25.000 | 1.790 | |||||
| 2025-05-06 | 13F | Bank Julius Baer & Co. Ltd, Zurich | 0 | -100,00 | 0 | |||||
| 2025-07-25 | 13F | Hobbs Group Advisors, LLC | 0 | -100,00 | 0 | |||||
| 2025-08-04 | 13F | FRG Family Wealth Advisors LLC | 2.800 | 201 | ||||||
| 2025-07-02 | 13F | Central Pacific Bank - Trust Division | 52.890 | 87,06 | 3.788 | 113,47 | ||||
| 2025-08-18 | 13F/A | National Bank Of Canada /fi/ | 204 | 0,00 | 15 | 16,67 | ||||
| 2025-07-24 | 13F | Robertson Stephens Wealth Management, LLC | 11.689 | 16,61 | 837 | 33,07 | ||||
| 2025-07-18 | 13F | Trust Co Of Vermont | 302 | 0,00 | 22 | 16,67 | ||||
| 2025-08-08 | 13F | Larson Financial Group LLC | 10 | 0,00 | 1 | |||||
| 2025-08-14 | 13F | Jane Street Group, Llc | Put | 36.400 | 2.607 | |||||
| 2025-08-14 | 13F | CoreCap Advisors, LLC | 122 | 5,17 | 9 | 14,29 | ||||
| 2025-07-30 | NP | ENDW - Cambria Endowment Style ETF | 57 | 4 | ||||||
| 2025-08-14 | 13F | Jane Street Group, Llc | Call | 121.100 | 8.673 | |||||
| 2025-08-14 | 13F | Boston Private Wealth Llc | 0 | -100,00 | 0 | |||||
| 2025-05-15 | 13F | D. E. Shaw & Co., Inc. | 0 | -100,00 | 0 | |||||
| 2025-08-07 | 13F/A | Curat Global, LLC | 200 | 0,00 | 14 | 16,67 | ||||
| 2025-08-08 | 13F | Foundations Investment Advisors, LLC | 204.669 | 4,84 | 14.658 | 19,62 | ||||
| 2025-08-14 | 13F | Menora Mivtachim Holdings Ltd. | 3.085.450 | 107,36 | 220.980 | 136,59 | ||||
| 2025-08-15 | 13F | Equitable Holdings, Inc. | 8.780 | 9,82 | 629 | 25,35 | ||||
| 2025-07-25 | 13F | Cwm, Llc | 3.255 | -2,66 | 0 | |||||
| 2025-04-29 | 13F | Hm Payson & Co | 1.156 | 0,00 | 73 | -4,00 | ||||
| 2025-08-11 | 13F | Advisor Resource Council | 9.433 | -80,83 | 676 | -72,97 | ||||
| 2025-08-04 | 13F | Spire Wealth Management | 613 | -78,05 | 44 | -75,43 | ||||
| 2025-08-05 | 13F | Fourth Dimension Wealth, LLC | 100 | 0,00 | 7 | 16,67 | ||||
| 2025-08-14 | 13F | Summit Trail Advisors, Llc | 473.162 | -29,69 | 33.888 | -19,78 | ||||
| 2025-07-15 | 13F | DSG Capital Advisors, LLC | 0 | -100,00 | 0 | |||||
| 2025-08-12 | 13F | Proequities, Inc. | 0 | 0 | ||||||
| 2025-04-15 | 13F | Thompson Investment Management, Inc. | 0 | -100,00 | 0 | |||||
| 2025-08-14 | 13F | McIlrath & Eck, LLC | 300 | 21 | ||||||
| 2025-08-13 | 13F | Tranquilli Financial Advisor LLC | 6.117 | 29,46 | 438 | 47,97 | ||||
| 2025-08-13 | 13F | Helix Partners Management LP | 35.000 | 2.507 | ||||||
| 2025-07-29 | 13F | Private Trust Co Na | 413 | -39,71 | 30 | -30,95 | ||||
| 2025-08-11 | 13F | Private Advisor Group, LLC | 26.585 | -2,13 | 1.904 | 11,74 | ||||
| 2025-07-29 | 13F | Koshinski Asset Management, Inc. | 8.444 | 0,00 | 605 | 13,96 | ||||
| 2025-04-11 | 13F | Permanent Capital Management, LP | 9.756 | 612 | ||||||
| 2025-08-12 | 13F | Laurel Wealth Advisors LLC | 5.372 | 5.272,00 | 0 | -100,00 | ||||
| 2025-08-12 | 13F | Fairscale Capital, LLC | 4.042 | 1,51 | 297 | 19,28 | ||||
| 2025-08-13 | 13F | Walleye Capital LLC | 0 | -100,00 | 0 | |||||
| 2025-08-07 | 13F | Addison Advisors LLC | 1.655 | -2,99 | 119 | 10,28 | ||||
| 2025-06-30 | NP | Two Roads Shared Trust - Anfield U.S. Equity Sector Rotation ETF | 59.105 | 3.578 | ||||||
| 2025-08-18 | NP | JAMEX - Jamestown Equity Fund | 12.165 | 0,00 | 871 | 14,15 | ||||
| 2025-08-05 | 13F | Harel Insurance Investments & Financial Services Ltd. | 2.272.620 | 0,00 | 163 | 14,08 | ||||
| 2025-08-14 | 13F | Quantitative Investment Management, LLC | 15.418 | -50,95 | 1 | 0,00 | ||||
| 2025-08-12 | 13F | Edmond De Rothschild Holding S.a. | 153.800 | 1,96 | 11.015 | 16,34 | ||||
| 2025-07-16 | 13F | PFS Partners, LLC | 95 | -11,21 | 7 | 0,00 | ||||
| 2025-08-13 | 13F | Barclays Plc | 0 | -100,00 | 0 | |||||
| 2025-08-15 | 13F | Tower Research Capital LLC (TRC) | 2.233 | -96,60 | 160 | -96,14 | ||||
| 2025-08-14 | 13F | Raymond James Financial Inc | 134.838 | -4,91 | 9.657 | 8,49 | ||||
| 2025-08-07 | 13F | David R. Rahn & Associates Inc. | 0 | -100,00 | 0 | |||||
| 2025-07-18 | 13F | Truist Financial Corp | 16.681 | -2,24 | 1.195 | 11,48 | ||||
| 2025-08-07 | 13F | Resources Investment Advisors, LLC. | 4.815 | -18,83 | 345 | -7,53 | ||||
| 2025-08-14 | 13F | Bnp Paribas Arbitrage, Sa | 319.770 | -31,60 | 22.902 | -21,96 | ||||
| 2025-08-14 | 13F | Sunbelt Securities, Inc. | 1.775 | 4,35 | 116 | 8,49 | ||||
| 2025-08-04 | 13F | Assetmark, Inc | 326 | 23 | ||||||
| 2025-05-14 | 13F | Van Hulzen Asset Management, LLC | 0 | -100,00 | 0 | |||||
| 2025-08-05 | 13F | Simplex Trading, Llc | 13.094 | -45,07 | 1 | -100,00 | ||||
| 2025-07-25 | 13F | Hazlett, Burt & Watson, Inc. | 26.959 | 16,92 | 2 | 0,00 | ||||
| 2025-08-11 | 13F | One Capital Management, LLC | 0 | -100,00 | 0 | |||||
| 2025-07-08 | 13F | Juncture Wealth Strategies, Llc | 28.572 | 106,88 | 2.046 | 136,26 | ||||
| 2025-05-06 | 13F | Y-Intercept (Hong Kong) Ltd | 0 | -100,00 | 0 | |||||
| 2025-07-30 | 13F | Blume Capital Management, Inc. | 400 | 0,00 | 29 | 12,00 | ||||
| 2025-07-30 | 13F | Strategic Blueprint, LLC | 0 | -100,00 | 0 | |||||
| 2025-08-12 | 13F | BlackRock, Inc. | 493 | 35 | ||||||
| 2025-08-14 | 13F | Aqr Capital Management Llc | 3.658 | 262 | ||||||
| 2025-07-31 | 13F | GLOBALT Investments LLC / GA | 8.709 | -10,42 | 624 | 2,13 | ||||
| 2025-05-20 | 13F/A | Colony Group, LLC | 0 | -100,00 | 0 | -100,00 | ||||
| 2025-08-06 | 13F | Founders Financial Securities Llc | 30.586 | 34,84 | 2.191 | 60,20 | ||||
| 2025-07-24 | 13F | Ronald Blue Trust, Inc. | 340 | 38,78 | 24 | 60,00 | ||||
| 2025-05-12 | 13F | Nomura Asset Management Co Ltd | 0 | -100,00 | 0 | |||||
| 2025-08-01 | 13F | Logan Capital Management Inc | 17 | 0,00 | 1 | 0,00 | ||||
| 2025-08-14 | 13F | Family Management Corp | 10.817 | 0,00 | 775 | 14,16 | ||||
| 2025-08-19 | 13F | Newbridge Financial Services Group, Inc. | 100 | -25,93 | 7 | -12,50 | ||||
| 2025-08-06 | 13F | Commonwealth Equity Services, Llc | 40.215 | -0,73 | 3 | 0,00 | ||||
| 2025-08-12 | 13F | Nemes Rush Group LLC | 119 | 8 | ||||||
| 2025-07-31 | 13F | Pinnacle Wealth Management Group, Inc. | 34.978 | 5,93 | 2.505 | 20,90 | ||||
| 2025-08-14 | 13F | FIL Ltd | 196.021 | 214,72 | 14.127 | 261,40 | ||||
| 2025-08-13 | 13F | Philadelphia Trust Co | 10.000 | 0,00 | 1 | |||||
| 2025-08-12 | 13F | Jefferies Financial Group Inc. | 7.850 | -71,49 | 562 | -67,48 | ||||
| 2025-08-14 | 13F | Integrated Wealth Concepts LLC | 4.847 | -5,24 | 347 | 8,10 | ||||
| 2025-08-13 | 13F | Renaissance Technologies Llc | 54.600 | 3.910 | ||||||
| 2025-08-14 | 13F | Temasek Holdings (Private) Ltd | 0 | -100,00 | 0 | |||||
| 2025-05-27 | NP | XNAV - FundX Aggressive ETF | 34.681 | 0,00 | 2.177 | -3,97 | ||||
| 2025-07-10 | 13F | Piscataqua Savings Bank | 180 | 0,00 | 13 | 9,09 | ||||
| 2025-07-18 | 13F | Parsons Capital Management Inc/ri | 14.291 | 0,00 | 1.024 | 14,05 | ||||
| 2025-07-15 | 13F | MCF Advisors LLC | 375 | 0,54 | 27 | 13,04 | ||||
| 2025-08-14 | 13F | Murphy & Mullick Capital Management Corp | 85 | 0,00 | 6 | 20,00 | ||||
| 2025-08-14 | 13F | GWM Advisors LLC | 6.546 | 63,94 | 469 | 87,20 | ||||
| 2025-08-15 | 13F | Provenance Wealth Advisors, LLC | 0 | -100,00 | 0 | -100,00 | ||||
| 2025-07-30 | 13F | Whittier Trust Co Of Nevada Inc | 400 | -8,26 | 29 | 3,70 | ||||
| 2025-08-08 | 13F | Itau Unibanco Holding S.A. | 9.000 | -88,07 | 645 | 16.000,00 | ||||
| 2025-07-31 | 13F | Oppenheimer & Co Inc | 8.932 | 640 | ||||||
| 2025-08-05 | 13F | Bank of New York Mellon Corp | 110.795 | 21,41 | 7.935 | 38,53 | ||||
| 2025-08-14 | 13F | Group One Trading, L.p. | 4.649 | 583,68 | 333 | 690,48 | ||||
| 2025-04-21 | 13F | PSI Advisors, LLC | 0 | -100,00 | 0 | |||||
| 2025-08-14 | 13F | Citadel Advisors Llc | 253.076 | 35,45 | 18.125 | 54,56 | ||||
| 2025-08-04 | 13F | Ledyard National Bank | 269.215 | -4,03 | 19.281 | 9,50 | ||||
| 2025-08-14 | 13F | Citadel Advisors Llc | Put | 35.200 | 58,56 | 2.521 | 80,98 | |||
| 2025-07-17 | 13F | Fifth Third Securities, Inc. | 3.332 | -7,42 | 239 | 5,78 | ||||
| 2025-08-07 | 13F | Allworth Financial LP | 400 | 59,36 | 29 | 86,67 | ||||
| 2025-08-14 | 13F | Citadel Advisors Llc | Call | 81.800 | 245,15 | 5.859 | 293,95 | |||
| 2025-08-11 | 13F | Lowe Brockenbrough & Co Inc | 108.413 | -1,72 | 7.765 | 12,13 | ||||
| 2025-08-13 | 13F | Fisher Asset Management, LLC | 2.991.470 | 14,54 | 214.249 | 30,69 | ||||
| 2025-08-14 | 13F | First International Bank of Israel Ltd. | 62.000 | 4.440 | ||||||
| 2025-07-21 | 13F | Barrett & Company, Inc. | 8 | 0,00 | 1 | |||||
| 2025-07-28 | 13F | Duncker Streett & Co Inc | 14 | 0,00 | 1 | |||||
| 2025-07-29 | 13F | Dumont & Blake Investment Advisors Llc | 11.793 | -0,74 | 845 | 13,29 | ||||
| 2025-08-13 | 13F | Rsm Us Wealth Management Llc | 3.039 | 218 | ||||||
| 2025-08-14 | 13F | Headlands Technologies LLC | 0 | -100,00 | 0 | -100,00 | ||||
| 2025-08-14 | 13F | Goldman Sachs Group Inc | 2.940.662 | 31,28 | 210.610 | 49,79 | ||||
| 2025-08-14 | 13F | Transamerica Financial Advisors, Inc. | 36.323 | -22,49 | 2.601 | 129.950,00 | ||||
| 2025-08-04 | 13F | Migdal Insurance & Financial Holdings Ltd. | 5.595.000 | 64,80 | 401 | 87,79 | ||||
| 2025-08-14 | 13F | Qube Research & Technologies Ltd | 0 | -100,00 | 0 | |||||
| 2025-08-12 | 13F | Steward Partners Investment Advisory, Llc | 10.085 | -0,36 | 722 | 13,70 | ||||
| 2025-05-15 | 13F | Alliancebernstein L.p. | 0 | -100,00 | 0 | -100,00 | ||||
| 2025-08-12 | 13F | Argent Trust Co | 3.700 | 0,00 | 265 | 13,79 | ||||
| 2025-07-22 | 13F | Wealthcare Advisory Partners LLC | 77.465 | -1,22 | 5.548 | 12,72 | ||||
| 2025-05-19 | 13F | Heck Capital Advisors, LLC | 0 | 0 | ||||||
| 2025-08-14 | 13F | Hrt Financial Lp | 22.162 | 2 | ||||||
| 2025-08-13 | 13F | Northwestern Mutual Wealth Management Co | 6.927 | -0,66 | 496 | 13,50 | ||||
| 2025-08-14 | 13F | Mariner, LLC | 5.559 | 13,87 | 398 | 30,07 | ||||
| 2025-07-14 | 13F | Masso Torrence Wealth Management Inc. | 27.103 | -3,46 | 1.941 | 10,16 | ||||
| 2025-08-06 | 13F | Prospera Financial Services Inc | 0 | -100,00 | 0 | |||||
| 2025-08-13 | 13F | Russell Investments Group, Ltd. | 23 | 0,00 | 2 | 0,00 | ||||
| 2025-08-12 | 13F | MAI Capital Management | 22 | -75,28 | 2 | -80,00 | ||||
| 2025-08-14 | 13F | LM Advisors LLC | 4.000 | 0,00 | 0 | |||||
| 2025-08-14 | 13F | Fiduciary Trust Co | 926.093 | 7,37 | 66.327 | 22,51 | ||||
| 2025-08-11 | 13F | Brown Brothers Harriman & Co | 25 | -73,40 | 2 | -80,00 | ||||
| 2025-08-07 | 13F | Guardian Partners Inc. | 608.586 | 839,16 | 44.542 | 1.068,47 | ||||
| 2025-08-12 | 13F | Clal Insurance Enterprises Holdings Ltd | 4.370.000 | 23,27 | 313 | 40,54 | ||||
| 2025-08-14 | 13F/A | Skopos Labs, Inc. | 66 | 5 | ||||||
| 2025-04-15 | 13F | Integrated Advisors Network LLC | 0 | -100,00 | 0 | |||||
| 2025-08-13 | 13F | Schroder Investment Management Group | 322.906 | 22.965 | ||||||
| 2025-07-15 | 13F | Mather Group, Llc. | 0 | -100,00 | 0 | |||||
| 2025-07-22 | 13F | Gemmer Asset Management LLC | 0 | -100,00 | 0 | |||||
| 2025-05-19 | 13F/A | Jane Street Group, Llc | 0 | -100,00 | 0 | -100,00 | ||||
| 2025-07-15 | 13F | Fifth Third Bancorp | 431 | 31 | ||||||
| 2025-07-25 | 13F | Envestnet Portfolio Solutions, Inc. | 55.166 | 133,22 | 3.951 | 166,17 | ||||
| 2025-08-14 | 13F | Stifel Financial Corp | 8.295 | 0,00 | 594 | 14,23 | ||||
| 2025-07-31 | 13F | Cambridge Investment Research Advisors, Inc. | 23.713 | -7,87 | 2 | 0,00 | ||||
| 2025-08-14 | 13F | Susquehanna International Group, Llp | 5.055 | -88,06 | 362 | -86,37 | ||||
| 2025-08-13 | 13F | Shepherd Financial Partners LLC | 4.765 | 341 | ||||||
| 2025-08-14 | 13F | Susquehanna International Group, Llp | Call | 222.400 | 107,27 | 15.928 | 136,50 | |||
| 2025-08-14 | 13F | Susquehanna International Group, Llp | Put | 73.500 | -11,02 | 5.264 | 1,54 | |||
| 2025-07-29 | 13F | Mattson Financial Services, LLC | 0 | -100,00 | 0 | |||||
| 2025-08-12 | 13F | LPL Financial LLC | 411.120 | 6,84 | 29.444 | 21,91 | ||||
| 2025-08-14 | 13F | Ameriprise Financial Inc | 68.227 | -42,49 | 4.881 | -34,48 | ||||
| 2025-07-11 | 13F | Grove Bank & Trust | 140 | 10 | ||||||
| 2025-08-12 | 13F | Park Square Financial Group, LLC | 940 | -1,88 | 67 | 11,67 | ||||
| 2025-07-18 | 13F | Consolidated Portfolio Review Corp | 2.834 | 203 | ||||||
| 2025-07-14 | 13F | Farmers & Merchants Investments Inc | 819 | 0,00 | 59 | 13,73 | ||||
| 2025-07-22 | 13F | Miracle Mile Advisors, LLC | 7.879 | 20,68 | 564 | 37,90 | ||||
| 2025-07-29 | 13F | Chicago Partners Investment Group LLC | 3.446 | 258 | ||||||
| 2025-08-05 | 13F | Bank Of Montreal /can/ | 6.600 | 0,00 | 473 | 14,01 | ||||
| 2025-08-06 | 13F | First Horizon Advisors, Inc. | 89 | 32,84 | 6 | 50,00 | ||||
| 2025-08-05 | 13F | Key FInancial Inc | 141 | 642,11 | 10 | 900,00 | ||||
| 2025-08-14 | 13F | Cubist Systematic Strategies, LLC | 32.876 | -72,58 | 2.355 | -68,72 | ||||
| 2025-08-14 | 13F | Atomi Financial Group, Inc. | 4.185 | -25,65 | 300 | -15,30 | ||||
| 2025-07-18 | 13F | TruNorth Capital Management, LLC | 114 | 0,00 | 8 | 14,29 | ||||
| 2025-08-14 | 13F | Synovus Financial Corp | 53.686 | -0,20 | 3.847 | 13,92 | ||||
| 2025-08-15 | 13F | Captrust Financial Advisors | 34.781 | -0,35 | 2.491 | 13,74 | ||||
| 2025-07-29 | 13F | Activest Wealth Management | 0 | 0 | ||||||
| 2025-08-08 | 13F | ProVise Management Group, LLC | 43.033 | -4,46 | 3.082 | 9,02 | ||||
| 2025-08-14 | 13F | Boothbay Fund Management, Llc | Call | 177.700 | 33,01 | 12.727 | 51,75 | |||
| 2025-08-08 | 13F | Good Life Advisors, LLC | 42.435 | -32,06 | 3.039 | -22,47 | ||||
| 2025-09-04 | 13F/A | Advisor Group Holdings, Inc. | 39.709 | -8,69 | 2.844 | 4,21 | ||||
| 2025-08-11 | 13F | Aptus Capital Advisors, LLC | 12 | -62,50 | 1 | -100,00 | ||||
| 2025-07-10 | 13F | Rfg Holdings, Inc. | 197.378 | -1,63 | 14.136 | 12,23 | ||||
| 2025-07-09 | 13F | Finley Financial, LLC | 2.250 | 0,00 | 161 | 18,38 | ||||
| 2025-07-24 | 13F | Us Bancorp \de\ | 2.783 | 18,32 | 199 | 35,37 | ||||
| 2025-08-14 | 13F | Lazard Asset Management Llc | 0 | -100,00 | 0 | |||||
| 2025-08-14 | 13F | Two Sigma Investments, Lp | 44.600 | 3.194 | ||||||
| 2025-08-08 | 13F | Principal Financial Group Inc | 54.986 | -23,43 | 3.938 | -12,62 | ||||
| 2025-08-11 | 13F | Y.D. More Investments Ltd | 810 | 0,00 | 58 | 16,00 | ||||
| 2025-08-13 | 13F | EverSource Wealth Advisors, LLC | 0 | -100,00 | 0 | |||||
| 2025-07-30 | 13F | Cullen/frost Bankers, Inc. | 39 | 0,00 | 3 | 0,00 | ||||
| 2025-08-06 | 13F | Csenge Advisory Group | 107.014 | -0,51 | 7.021 | 15,00 | ||||
| 2025-08-12 | 13F | O'shaughnessy Asset Management, Llc | 952 | 0,11 | 68 | 15,25 | ||||
| 2025-08-06 | 13F | Golden State Wealth Management, LLC | 154 | 0,00 | 11 | 22,22 | ||||
| 2025-08-14 | 13F | Ssi Investment Management Llc | 124.746 | 95,08 | 8.934 | 122,63 | ||||
| 2025-07-01 | 13F | Harbor Investment Advisory, Llc | 0 | -100,00 | 0 | |||||
| 2025-05-14 | 13F | Huntington National Bank | 14 | -7,14 | ||||||
| 2025-08-08 | 13F | Cetera Investment Advisers | 143.009 | 5,32 | 10.242 | 20,18 | ||||
| 2025-08-11 | 13F | HighTower Advisors, LLC | 28.001 | -1,98 | 2.005 | 11,82 | ||||
| 2025-08-08 | 13F | SG Americas Securities, LLC | 0 | -100,00 | 0 | |||||
| 2025-08-14 | 13F | Fmr Llc | 3.334 | 22,44 | 240 | 41,18 | ||||
| 2025-07-03 | 13F | First Hawaiian Bank | 0 | -100,00 | 0 | -100,00 | ||||
| 2025-07-15 | 13F | Attessa Capital LLC | 0 | -100,00 | 0 | |||||
| 2025-08-11 | 13F | Anfield Capital Management, LLC | 59.495 | -1,29 | 4.261 | 12,64 | ||||
| 2025-08-14 | 13F | Horizon Investments, LLC | 457.451 | 19,85 | 32.763 | 36,75 | ||||
| 2025-08-01 | 13F | Clark Asset Management, LLC | 6.501 | 0,57 | 466 | 14,81 | ||||
| 2025-08-14 | 13F | Glenmede Investment Management, LP | 4.890 | 350 | ||||||
| 2025-07-09 | 13F | Sapient Capital Llc | 3.422 | 0,00 | 245 | 14,49 | ||||
| 2025-07-21 | 13F | Quattro Financial Advisors Llc | 42.307 | -6,32 | 3.030 | 6,92 | ||||
| 2025-07-22 | 13F | Bank Hapoalim Bm | 7.270 | 12,73 | 1 | |||||
| 2025-08-05 | 13F | Access Investment Management LLC | 60 | 0,00 | 4 | 33,33 | ||||
| 2025-08-13 | 13F | Green Harvest Asset Management LLC | 49.132 | 16,61 | 3.519 | 33,06 | ||||
| 2025-08-13 | 13F | StoneX Group Inc. | 9.982 | -8,08 | 715 | 4,85 | ||||
| 2025-07-22 | 13F | Beacon Financial Advisory LLC | 13.869 | -2,08 | 993 | 11,70 | ||||
| 2025-07-18 | 13F | Tanager Wealth Management LLP | 6.057 | 0,00 | 434 | 13,95 | ||||
| 2025-08-08 | 13F | Gts Securities Llc | 97.156 | 281,57 | 6.958 | 335,42 | ||||
| 2025-08-14 | 13F | Avanda Investment Management Pte. Ltd. | Call | 437.500 | 31.334 | |||||
| 2025-07-16 | 13F | American National Bank | 62 | 4 | ||||||
| 2025-08-06 | 13F | AE Wealth Management LLC | 459 | 214,38 | 33 | 255,56 | ||||
| 2025-08-08 | 13F | Accredited Investors Inc. | 3.545 | 0,03 | 254 | 13,96 | ||||
| 2025-08-14 | 13F | Bank Of America Corp /de/ | 12.830.652 | -1,52 | 918.931 | 12,36 | ||||
| 2025-07-25 | 13F | Atria Wealth Solutions, Inc. | 0 | -100,00 | 0 | |||||
| 2025-08-14 | 13F/A | Rockefeller Capital Management L.P. | 20.831 | 27,03 | 1.492 | 44,90 | ||||
| 2025-08-01 | 13F | Envestnet Asset Management Inc | 240.411 | 64,08 | 17.218 | 87,21 | ||||
| 2025-07-25 | 13F | Astoria Portfolio Advisors LLC. | 5.351 | 399 | ||||||
| 2025-08-14 | 13F | Banco BTG Pactual S.A. | 120.000 | -9,50 | 8.594 | 3,26 | ||||
| 2025-07-14 | 13F | U.S. Capital Wealth Advisors, LLC | 16.540 | 0,01 | 1.185 | 14,07 | ||||
| 2025-05-15 | 13F | Marshall Wace, Llp | 0 | -100,00 | 0 | -100,00 |