Grundlæggende statistik
| Institutionelle ejere | 119 total, 119 long only, 0 short only, 0 long/short - change of 2,56% MRQ |
| Gennemsnitlig porteføljeallokering | 0.3729 % - change of 29,37% MRQ |
| Institutionelle aktier (lange) | 6.759.200 (ex 13D/G) - change of 0,49MM shares 7,86% MRQ |
| Institutionel værdi (lang) | $ 501.322 USD ($1000) |
Institutionelt ejerskab og aktionærer
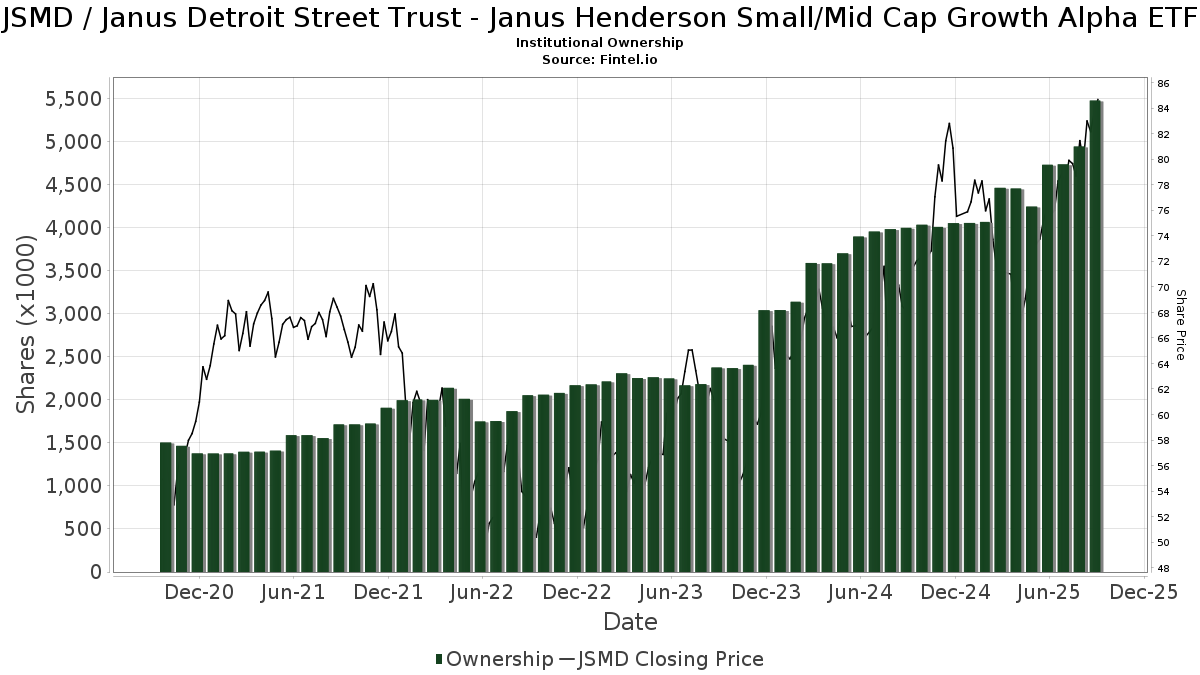
Janus Detroit Street Trust - Janus Henderson Small/Mid Cap Growth Alpha ETF (US:JSMD) har 119 institutionelle ejere og aktionærer, der har indsendt 13D/G- eller 13F-formularer til Securities Exchange Commission (SEC). Disse institutioner har i alt 6,759,200 aktier. Største aktionærer omfatter LPL Financial LLC, Bank Of America Corp /de/, Morgan Stanley, Mars Jewett Financial Group, Inc., Leelyn Smith, LLC, Royal Bank Of Canada, Cambridge Investment Research Advisors, Inc., Raymond James Financial Inc, Resonant Capital Advisors, LLC, and Envestnet Asset Management Inc .
Janus Detroit Street Trust - Janus Henderson Small/Mid Cap Growth Alpha ETF (NasdaqGM:JSMD) institutionel ejerskabsstruktur viser aktuelle positioner i virksomheden efter institutioner og fonde, samt seneste ændringer i positionsstørrelse. Større aktionærer kan omfatte individuelle investorer, investeringsforeninger, hedgefonde eller institutioner. Skema 13D angiver, at investoren besidder (eller besidder) mere end 5 % af virksomheden og har til hensigt (eller har til hensigt at) aktivt at forfølge en ændring i forretningsstrategi. Skema 13G indikerer en passiv investering på over 5%.
The share price as of March 18, 2026 is 78,65 / share. Previously, on March 19, 2025, the share price was 71,18 / share. This represents an increase of 10,49% over that period.
Fondens stemningsscore
Fund Sentiment Score (fka Ownership Accumulation Score) finder de aktier, der bliver mest købt af fonde. Det er resultatet af en sofistikeret, multi-faktor kvantitativ model, der identificerer virksomheder med de højeste niveauer af institutionel akkumulering. Scoringsmodellen bruger en kombination af den samlede stigning i oplyste ejere, ændringerne i porteføljeallokeringer i disse ejere og andre målinger. Tallet går fra 0 til 100, hvor højere tal indikerer et højere niveau af akkumulering for sine jævnaldrende, og 50 er gennemsnittet.
Opdateringsfrekvens: Dagligt
Se Ownership Explorer, som giver en liste over højest rangerende virksomheder.
AI+ Ask Fintel’s AI assistant about Janus Detroit Street Trust - Janus Henderson Small/Mid Cap Growth Alpha ETF.
Select a question to share a public post with an AI-crafted answer.
Thinking of good questions…
Institutionel Put/Call-forhold
Ud over at indberette standardaktie- og gældsudstedelser skal institutter med mere end 100 mill. aktiver under forvaltning også oplyse deres put- og call-optionsbeholdninger. Da salgsoptioner generelt indikerer negativ stemning, og købsoptioner indikerer positiv stemning, kan vi få en fornemmelse af den overordnede institutionelle stemning ved at plotte forholdet mellem put og kald. Diagrammet til højre viser det historiske put/call-forhold for dette instrument.
Brug af Put/Call Ratio som en indikator for investorernes stemning overvinder en af de vigtigste mangler ved at bruge totalt institutionelt ejerskab, som er, at en betydelig mængde af aktiver under forvaltning investeres passivt for at spore indekser. Passivt forvaltede fonde køber typisk ikke optioner, så indikatoren for put/call-forholdet følger mere nøje følelsen af aktivt forvaltede fonde.
13F og NPORT arkivering
Detaljer om 13F-arkivering er gratis. Detaljer om NP-ansøgninger kræver et premium-medlemskab. Grønne rækker angiver nye positioner. Røde rækker angiver lukkede positioner. Klik på linket ikon for at se den fulde transaktionshistorik.
Opgrader
for at låse premium-data op og eksportere til Excel ![]() .
.
| Fil dato | Kilde | Investor | Type | Gennemsnitlig pris (Øst) |
Aktier | Δ Aktier (%) |
Rapporteret Værdi ($1000) |
Δ Værdi (%) |
Port Alloc (%) |
|
|---|---|---|---|---|---|---|---|---|---|---|
| 2026-01-16 | 13F | Worth Financial Advisory Group, LLC | 61.716 | 2,95 | 5.034 | 0,42 | ||||
| 2026-02-02 | 13F | Mcdonald Partners Llc | 10.028 | -73,18 | 818 | -66,32 | ||||
| 2026-01-23 | 13F | Farther Finance Advisors, LLC | 2.813 | -5,92 | 229 | -8,40 | ||||
| 2026-02-10 | 13F | IAG Wealth Partners, LLC | 28.093 | -7,36 | 2.291 | -9,63 | ||||
| 2026-02-18 | 13F | GWM Advisors LLC | 4.658 | -0,49 | 380 | -3,07 | ||||
| 2026-02-03 | 13F | We Are One Seven, LLC | 11.403 | 8,74 | 930 | 6,16 | ||||
| 2026-02-02 | 13F | Allegheny Financial Group LTD | 7.022 | 573 | ||||||
| 2026-01-28 | 13F | Leelyn Smith, LLC | 361.445 | 0,60 | 29.479 | -1,87 | ||||
| 2026-01-29 | 13F | Ashton Thomas Private Wealth, LLC | 11.174 | 4,68 | 911 | 2,13 | ||||
| 2026-02-17 | 13F | Cetera Investment Advisers | 46.577 | 2,61 | 3.799 | 0,08 | ||||
| 2026-02-05 | 13F | Thrivent Financial For Lutherans | 201.148 | 8,85 | 16 | 6,67 | ||||
| 2026-02-11 | 13F | Janney Montgomery Scott LLC | 70.728 | 15,24 | 6 | 0,00 | ||||
| 2026-02-03 | 13F | Bokf, Na | 535 | 0,00 | 44 | -2,27 | ||||
| 2026-01-07 | 13F | Stonebridge Wealth Management, LLC | 15.266 | 1.245 | ||||||
| 2026-02-17 | 13F | IHT Wealth Management, LLC | 11.111 | -1,31 | 906 | -3,72 | ||||
| 2026-02-13 | 13F | Stifel Financial Corp | 196.346 | 3,84 | 16.014 | 1,29 | ||||
| 2026-01-05 | 13F | Park Avenue Securities Llc | 11.796 | 4,81 | 1 | |||||
| 2026-01-20 | 13F | Stratos Wealth Partners, LTD. | 10.093 | 11,21 | 823 | 8,58 | ||||
| 2026-02-17 | 13F | Clark Capital Management Group, Inc. | 94.946 | 6,10 | 7.744 | 3,49 | ||||
| 2026-02-13 | 13F | Balanced Rock Investment Advisor | 7.534 | 15,98 | 614 | 13,08 | ||||
| 2026-02-09 | 13F | Kingsview Wealth Management, LLC | 14.750 | 1,35 | 1.203 | -1,07 | ||||
| 2026-02-17 | 13F | Evergreen Wealth Solutions, LLC | 65.749 | 5.362 | ||||||
| 2026-01-14 | 13F | Redhawk Wealth Advisors, Inc. | 2.543 | 207 | ||||||
| 2026-01-23 | 13F | McCarthy & Cox | 0 | -100,00 | 0 | |||||
| 2026-01-30 | 13F | Arlington Trust Co LLC | 370 | 0,00 | 30 | 0,00 | ||||
| 2026-02-02 | 13F | CENTRAL TRUST Co | 23.947 | 12,33 | 1.953 | 9,60 | ||||
| 2026-01-27 | 13F | PFG Advisors | 10.246 | 51,82 | 836 | 48,05 | ||||
| 2026-02-12 | 13F | Burke & Herbert Bank & Trust Co | 5.659 | 85,00 | 462 | 80,78 | ||||
| 2026-02-10 | 13F | Peapack Gladstone Financial Corp | 47.806 | 52,13 | 4 | 50,00 | ||||
| 2026-02-12 | 13F | Commonwealth Equity Services, Llc | 63.299 | 15,44 | 5.163 | 128.950,00 | ||||
| 2026-02-17 | 13F | Advisory Services Network, LLC | 6.669 | -80,52 | 544 | -81,03 | ||||
| 2026-01-20 | 13F | Blue Rock Wealth Management LLC | 57.063 | -3,60 | 4.654 | -5,96 | ||||
| 2026-02-17 | 13F | LaSalle St. Investment Advisors, LLC | 3.122 | 12,38 | 0 | |||||
| 2026-01-29 | 13F | Sanctuary Advisors, LLC | 5.876 | 0,02 | 479 | -2,44 | ||||
| 2026-02-04 | 13F | Ameritas Advisory Services, LLC | 0 | -100,00 | 0 | |||||
| 2026-02-11 | 13F | Capital Analysts, Inc. | 446 | 0,00 | 0 | |||||
| 2026-01-29 | 13F | Kestra Private Wealth Services, Llc | 7.714 | 629 | ||||||
| 2026-02-03 | 13F | International Assets Investment Management, Llc | 2.250 | 184 | ||||||
| 2026-01-21 | 13F | Capital Advisors, Ltd. LLC | 1.702 | 0,00 | 0 | |||||
| 2026-02-05 | 13F | Cambridge Investment Research Advisors, Inc. | 295.447 | -0,77 | 24 | 0,00 | ||||
| 2026-01-29 | 13F | Golden State Equity Partners | 4.534 | 370 | ||||||
| 2026-02-03 | 13F | NewEdge Wealth, LLC | 13.284 | -1,37 | 1.083 | -4,83 | ||||
| 2026-02-17 | 13F | Royal Bank Of Canada | 336.738 | 12,16 | 27.464 | 9,41 | ||||
| 2026-02-13 | 13F | Graney & King, LLC | 5.352 | -2,85 | 437 | -5,22 | ||||
| 2026-01-20 | 13F | Thurston, Springer, Miller, Herd & Titak, Inc. | 12.284 | 967,25 | 1.002 | 942,71 | ||||
| 2026-02-09 | 13F | Huntington National Bank | 20 | -48,72 | ||||||
| 2026-02-13 | 13F | Mml Investors Services, Llc | 4.757 | 29,55 | 388 | 26,80 | ||||
| 2026-01-21 | 13F/A | Main Line Retirement Advisors, LLC | 3.531 | 0,14 | 288 | -2,38 | ||||
| 2026-02-13 | 13F | Greenline Wealth Management LLC | 230 | 19 | ||||||
| 2026-02-17 | 13F | Fmr Llc | 2.354 | 89,53 | 192 | 85,44 | ||||
| 2026-02-17 | 13F | Signature Equity Partners, LLC | 24 | 2 | ||||||
| 2026-01-28 | 13F | Geneos Wealth Management Inc. | 85 | 0,00 | 7 | -14,29 | ||||
| 2026-01-22 | 13F | Pinnacle Bancorp, Inc. | 54 | -16,92 | 4 | -20,00 | ||||
| 2026-02-02 | 13F | Cornerstone Planning Group LLC | 16 | 0,00 | 1 | 0,00 | ||||
| 2026-02-14 | 13F | Rockefeller Capital Management L.P. | 249 | 49,10 | 20 | 53,85 | ||||
| 2026-02-06 | 13F | IFP Advisors, Inc | 651 | 0,00 | 53 | -1,85 | ||||
| 2026-02-10 | 13F | Goldman Sachs Group Inc | 10.599 | 0,00 | 864 | -2,48 | ||||
| 2026-02-13 | 13F | Mariner, LLC | 68.333 | 2,71 | 5.573 | 0,20 | ||||
| 2026-02-13 | 13F | Aptus Capital Advisors, LLC | 2.969 | 0,00 | 242 | -2,42 | ||||
| 2026-02-12 | 13F | Steward Partners Investment Advisory, Llc | 317 | 9,69 | 26 | 4,17 | ||||
| 2026-02-04 | 13F | Pensionmark Financial Group, Llc | 0 | -100,00 | 0 | |||||
| 2025-11-13 | 13F | Bank Of Montreal /can/ | 0 | -100,00 | 0 | -100,00 | ||||
| 2026-01-06 | 13F | Investors Research Corp | 7.991 | -11,00 | 652 | -13,20 | ||||
| 2026-01-21 | 13F | Sound Income Strategies, LLC | 150 | 13 | ||||||
| 2026-02-12 | 13F | Symphony Financial Services, Inc. | 45.640 | 3.722 | ||||||
| 2026-01-23 | 13F | Assetmark, Inc | 370 | 7,87 | 30 | 7,14 | ||||
| 2026-01-13 | 13F | Norden Group Llc | 0 | -100,00 | 0 | |||||
| 2026-02-13 | 13F | Blue Jean Financial Llc | 17.621 | 1.437 | ||||||
| 2026-02-17 | 13F | Susquehanna International Group, Llp | 3.085 | -82,00 | 252 | -82,47 | ||||
| 2026-02-12 | 13F | Wealthspire Advisors, LLC | 24.720 | -2,45 | 2.016 | -4,82 | ||||
| 2026-02-12 | 13F | Jane Street Group, Llc | 20.342 | 29,83 | 1.659 | 26,64 | ||||
| 2026-02-17 | 13F | Raymond James Financial Inc | 275.976 | 25,61 | 22.509 | 22,53 | ||||
| 2026-01-30 | 13F | Sigma Planning Corp | 3.913 | 319 | ||||||
| 2025-11-12 | 13F | Comprehensive Financial Planning, Inc./PA | 0 | -100,00 | 0 | |||||
| 2026-02-17 | 13F | Private Advisor Group, LLC | 76.933 | -4,24 | 6.275 | -6,60 | ||||
| 2026-02-13 | 13F | Golden State Wealth Management, LLC | 3.125 | -29,98 | 255 | -31,90 | ||||
| 2026-01-15 | 13F | SILVER OAK SECURITIES, Inc | 9.933 | 10,87 | 822 | 9,61 | ||||
| 2026-01-22 | 13F | Systelligence, LLC | 0 | -100,00 | 0 | |||||
| 2026-02-06 | 13F | Global Retirement Partners, LLC | 1.150 | 27,78 | 94 | 24,00 | ||||
| 2026-02-17 | 13F | Guardian Wealth Advisors, Llc / Nc | 2.969 | 0,00 | 242 | -2,42 | ||||
| 2026-01-30 | 13F | Us Bancorp \de\ | 1.691 | 0,00 | 138 | -2,84 | ||||
| 2026-02-13 | 13F | Kestra Advisory Services, LLC | 0 | -100,00 | 0 | |||||
| 2026-01-23 | 13F | Smith, Moore & Co. | 0 | -100,00 | 0 | |||||
| 2026-02-17 | 13F | Citadel Advisors Llc | 6.081 | 496 | ||||||
| 2026-02-17 | 13F | Wiley Bros.-aintree Capital, Llc | 169.645 | 83,80 | 13.707 | 75,92 | ||||
| 2026-01-26 | 13F | Pursuit Wealth Management LLC | 15.928 | 1.299 | ||||||
| 2026-02-11 | 13F | LPL Financial LLC | 776.705 | 4,37 | 63.348 | 1,80 | ||||
| 2026-02-12 | 13F | Principal Securities, Inc. | 22.239 | 9,23 | 1.814 | 6,52 | ||||
| 2026-01-27 | 13F | Wealthspan Partners, Llc | 3.813 | -2,56 | 311 | -5,20 | ||||
| 2026-01-29 | 13F | Comerica Bank | 7.497 | -24,22 | 611 | -26,12 | ||||
| 2026-01-29 | 13F | UBS Group AG | 64.818 | 4,32 | 5.287 | 1,75 | ||||
| 2026-02-06 | 13F | Creative Financial Designs Inc /adv | 1.943 | -13,37 | 159 | -15,51 | ||||
| 2026-02-17 | 13F | Advisor Group Holdings, Inc. | 100.293 | 53,83 | 8.181 | 50,20 | ||||
| 2026-01-29 | 13F | D.a. Davidson & Co. | 40.079 | 304,59 | 3.269 | 294,69 | ||||
| 2026-01-26 | 13F | Private Trust Co Na | 589 | -29,71 | 48 | -31,43 | ||||
| 2026-01-16 | 13F | Trust Co Of Vermont | 725 | 59 | ||||||
| 2026-02-17 | 13F | Gladstone Institutional Advisory LLC | 16.909 | -5,69 | 1.379 | -8,01 | ||||
| 2026-02-11 | 13F | Rise Advisors, LLC | 183.473 | 9,63 | 14.964 | 6,94 | ||||
| 2026-02-03 | 13F | AssuredPartners Investment Advisors, LLC | 21.631 | 492,14 | 1.764 | 478,36 | ||||
| 2026-02-06 | 13F | Flaharty Asset Management, LLC | 82.890 | 6.761 | ||||||
| 2026-02-13 | 13F | Altus Wealth Group LLC | 8.450 | 1,66 | 689 | -0,86 | ||||
| 2026-01-30 | 13F | Bogart Wealth, LLC | 155 | 0,00 | 13 | 0,00 | ||||
| 2026-02-11 | 13F | Jpmorgan Chase & Co | 844 | -90,67 | 69 | -91,01 | ||||
| 2026-02-17 | 13F | Gotham Asset Management, LLC | 0 | -100,00 | 0 | |||||
| 2026-01-26 | 13F | AE Wealth Management LLC | 38 | -73,61 | 3 | -75,00 | ||||
| 2026-02-06 | 13F | HighTower Advisors, LLC | 9.892 | 3,97 | 807 | 1,38 | ||||
| 2026-02-17 | 13F | Ameriprise Financial Inc | 70.479 | -53,07 | 5.739 | -54,29 | ||||
| 2026-02-13 | 13F | Wells Fargo & Company/mn | 1 | 0,00 | 0 | |||||
| 2026-02-05 | 13F | Allworth Financial LP | 0 | -100,00 | 0 | |||||
| 2026-02-09 | 13F | Harbour Investments, Inc. | 672 | -70,04 | 55 | -71,12 | ||||
| 2026-02-12 | 13F | Triumph Capital Management | 700 | 0,00 | 57 | -1,72 | ||||
| 2026-02-05 | 13F | Cornerstone Wealth Management, LLC | 2.507 | 0,00 | 205 | -2,39 | ||||
| 2026-01-14 | 13F | Moisand Fitzgerald Tamayo, LLC | 37 | 0,00 | 3 | 0,00 | ||||
| 2026-01-29 | 13F | Horizon Advisory Services, Inc. | 7.014 | 9,30 | 572 | 6,72 | ||||
| 2026-01-06 | 13F | Unique Wealth, Llc | 3.255 | 265 | ||||||
| 2025-09-26 | NP | Northern Lights Fund Trust - PFG Janus Henderson(R) Balanced Strategy Class R Shares | 109.929 | -6,45 | 8.715 | 7,31 | ||||
| 2026-02-17 | 13F | Mars Jewett Financial Group, Inc. | 380.103 | 32.923 | ||||||
| 2026-01-14 | 13F | Nova Wealth Management, Inc. | 12.762 | 123,42 | 1.041 | 118,03 | ||||
| 2026-02-11 | 13F | Liberty Square Wealth Partners Llc | 2.690 | 0,67 | 219 | -1,79 | ||||
| 2026-02-17 | 13F | Bank Of America Corp /de/ | 646.266 | -4,25 | 52.709 | -6,60 | ||||
| 2026-01-08 | 13F | Wealth Enhancement Advisory Services, Llc | 38.250 | -18,72 | 3.248 | -16,09 | ||||
| 2026-01-20 | 13F | Trust Co Of Toledo Na /oh/ | 173 | 0,00 | 14 | 0,00 | ||||
| 2026-02-17 | 13F | Jones Financial Companies Lllp | 0 | -100,00 | 0 | |||||
| 2026-02-13 | 13F | Morgan Stanley | 626.786 | -12,18 | 51.121 | -14,34 | ||||
| 2026-01-20 | 13F | Independence Bank of Kentucky | 369 | 0,00 | 30 | 0,00 | ||||
| 2026-01-29 | 13F | Resonant Capital Advisors, LLC | 241.490 | 2,91 | 19.696 | 0,30 | ||||
| 2026-02-10 | 13F/A | Northwestern Mutual Wealth Management Co | 27.148 | -2,70 | 2.214 | -5,06 | ||||
| 2026-02-10 | 13F | IFG Advisory, LLC | 2.471 | 202 | ||||||
| 2026-01-09 | 13F | Breakwater Capital Group | 34.626 | 9,08 | 2.824 | 6,41 | ||||
| 2026-02-10 | 13F | Envestnet Asset Management Inc | 239.765 | 6,50 | 19.555 | 3,89 | ||||
| 2026-02-13 | 13F | Arkadios Wealth Advisors | 6.785 | -0,60 | 553 | -2,98 | ||||
| 2025-09-26 | NP | PFTSX - PFG Tactical Income Strategy Fund Class R Shares | 29.225 | -6,70 | 2.317 | 7,02 |