Grundlæggende statistik
| Institutionelle ejere | 123 total, 123 long only, 0 short only, 0 long/short - change of 3,36% MRQ |
| Gennemsnitlig porteføljeallokering | 0.2922 % - change of 0,37% MRQ |
| Institutionelle aktier (lange) | 11.410.746 (ex 13D/G) - change of 0,06MM shares 0,50% MRQ |
| Institutionel værdi (lang) | $ 807.801 USD ($1000) |
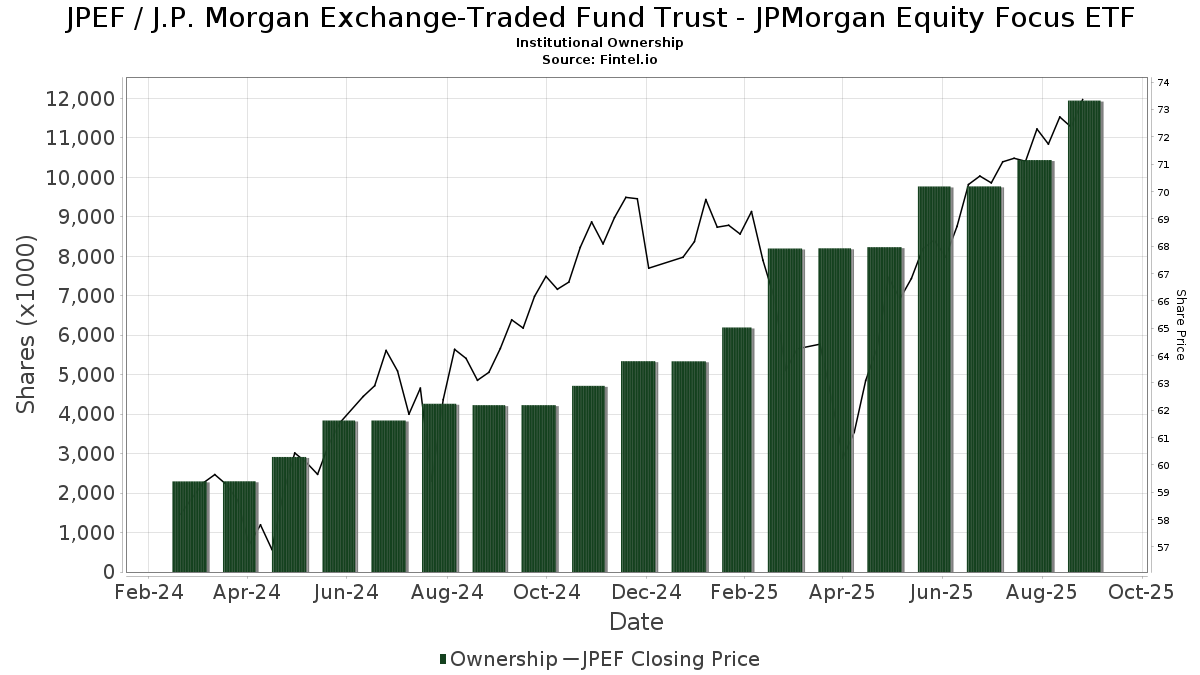
Institutionelt ejerskab og aktionærer
J.P. Morgan Exchange-Traded Fund Trust - JPMorgan Equity Focus ETF (US:JPEF) har 123 institutionelle ejere og aktionærer, der har indsendt 13D/G- eller 13F-formularer til Securities Exchange Commission (SEC). Disse institutioner har i alt 11,410,746 aktier. Største aktionærer omfatter Raymond James Financial Inc, LPL Financial LLC, Mml Investors Services, Llc, Cetera Investment Advisers, Commonwealth Equity Services, Llc, Advisor Group Holdings, Inc., Beaumont Financial Advisors, LLC, Jones Financial Companies Lllp, Balance Wealth, LLC, and Leverty Financial Group, LLC .
J.P. Morgan Exchange-Traded Fund Trust - JPMorgan Equity Focus ETF (NasdaqGM:JPEF) institutionel ejerskabsstruktur viser aktuelle positioner i virksomheden efter institutioner og fonde, samt seneste ændringer i positionsstørrelse. Større aktionærer kan omfatte individuelle investorer, investeringsforeninger, hedgefonde eller institutioner. Skema 13D angiver, at investoren besidder (eller besidder) mere end 5 % af virksomheden og har til hensigt (eller har til hensigt at) aktivt at forfølge en ændring i forretningsstrategi. Skema 13G indikerer en passiv investering på over 5%.
The share price as of March 6, 2026 is 74,28 / share. Previously, on March 10, 2025, the share price was 63,64 / share. This represents an increase of 16,72% over that period.
Fondens stemningsscore
Fund Sentiment Score (fka Ownership Accumulation Score) finder de aktier, der bliver mest købt af fonde. Det er resultatet af en sofistikeret, multi-faktor kvantitativ model, der identificerer virksomheder med de højeste niveauer af institutionel akkumulering. Scoringsmodellen bruger en kombination af den samlede stigning i oplyste ejere, ændringerne i porteføljeallokeringer i disse ejere og andre målinger. Tallet går fra 0 til 100, hvor højere tal indikerer et højere niveau af akkumulering for sine jævnaldrende, og 50 er gennemsnittet.
Opdateringsfrekvens: Dagligt
Se Ownership Explorer, som giver en liste over højest rangerende virksomheder.
AI+ Ask Fintel’s AI assistant about J.P. Morgan Exchange-Traded Fund Trust - JPMorgan Equity Focus ETF.
Select a question to share a public post with an AI-crafted answer.
Thinking of good questions…
Institutionel Put/Call-forhold
Ud over at indberette standardaktie- og gældsudstedelser skal institutter med mere end 100 mill. aktiver under forvaltning også oplyse deres put- og call-optionsbeholdninger. Da salgsoptioner generelt indikerer negativ stemning, og købsoptioner indikerer positiv stemning, kan vi få en fornemmelse af den overordnede institutionelle stemning ved at plotte forholdet mellem put og kald. Diagrammet til højre viser det historiske put/call-forhold for dette instrument.
Brug af Put/Call Ratio som en indikator for investorernes stemning overvinder en af de vigtigste mangler ved at bruge totalt institutionelt ejerskab, som er, at en betydelig mængde af aktiver under forvaltning investeres passivt for at spore indekser. Passivt forvaltede fonde køber typisk ikke optioner, så indikatoren for put/call-forholdet følger mere nøje følelsen af aktivt forvaltede fonde.
13F og NPORT arkivering
Detaljer om 13F-arkivering er gratis. Detaljer om NP-ansøgninger kræver et premium-medlemskab. Grønne rækker angiver nye positioner. Røde rækker angiver lukkede positioner. Klik på linket ikon for at se den fulde transaktionshistorik.
Opgrader
for at låse premium-data op og eksportere til Excel ![]() .
.
| Fil dato | Kilde | Investor | Type | Gennemsnitlig pris (Øst) |
Aktier | Δ Aktier (%) |
Rapporteret Værdi ($1000) |
Δ Værdi (%) |
Port Alloc (%) |
|
|---|---|---|---|---|---|---|---|---|---|---|
| 2026-02-09 | 13F | Kingsview Wealth Management, LLC | 34.199 | -3,82 | 2.554 | -3,04 | ||||
| 2026-02-10 | 13F | Goldman Sachs Group Inc | 0 | -100,00 | 0 | |||||
| 2026-02-10 | 13F | 3Chopt Investment Partners, LLC | 1.885 | 0,43 | 141 | 0,72 | ||||
| 2026-02-04 | 13F | Empire Life Investments Inc. | 44.279 | -36,47 | 3.307 | -35,96 | ||||
| 2026-01-14 | 13F | Wealthcare Advisory Partners LLC | 3.830 | -10,93 | 286 | -10,06 | ||||
| 2026-02-11 | 13F | Flagship Wealth Advisors, Llc | 37.738 | 0,31 | 2.819 | 1,11 | ||||
| 2026-02-13 | 13F | Wells Fargo & Company/mn | 31.659 | 5.698,35 | 2.365 | 5.810,00 | ||||
| 2026-02-17 | 13F | Bank Of America Corp /de/ | 1.721 | 760,50 | 129 | 814,29 | ||||
| 2026-02-17 | 13F | Qube Research & Technologies Ltd | 933 | 28,87 | 70 | 30,19 | ||||
| 2026-02-05 | 13F | AlphaCore Capital LLC | 143.956 | 10.752 | ||||||
| 2025-11-14 | 13F | Fort Point Capital Partners LLC | 0 | -100,00 | 0 | |||||
| 2026-01-20 | 13F | Stratos Wealth Partners, LTD. | 319.251 | 2,63 | 23.844 | 3,46 | ||||
| 2026-02-11 | 13F | Janney Montgomery Scott LLC | 241.963 | -19,11 | 18 | -18,18 | ||||
| 2026-02-13 | 13F | Mariner, LLC | 4.139 | 3,17 | 309 | 4,04 | ||||
| 2026-02-10 | 13F | Root Financial Partners, LLC | 879 | 470,78 | 66 | 490,91 | ||||
| 2026-02-13 | 13F | Stifel Financial Corp | 38.271 | -2,05 | 2.858 | -1,24 | ||||
| 2026-02-12 | 13F | Principal Securities, Inc. | 0 | -100,00 | 0 | |||||
| 2026-02-09 | 13F | Cary Street Partner Investment Advisory Llc | 24 | 0,00 | 2 | 0,00 | ||||
| 2026-01-26 | 13F | AE Wealth Management LLC | 114 | 70,15 | 9 | 100,00 | ||||
| 2026-02-09 | 13F | Harbour Investments, Inc. | 3.639 | -5,99 | 272 | -5,24 | ||||
| 2026-02-10 | 13F | Thoroughbred Financial Services, Llc | 38.689 | -7,72 | 3 | -33,33 | ||||
| 2026-02-10 | 13F | Carnegie Lake Advisors LLC | 2.850 | -10,38 | 213 | -9,79 | ||||
| 2026-02-17 | 13F | Cetera Investment Advisers | 551.670 | 2,06 | 41.203 | 2,88 | ||||
| 2026-02-13 | 13F | Vienna Asset Management LLC | 5.631 | 71,36 | 421 | 72,84 | ||||
| 2026-02-02 | 13F | Truist Financial Corp | 32.644 | -29,17 | 2.438 | -28,59 | ||||
| 2026-02-04 | 13F | Pensionmark Financial Group, Llc | 13.217 | 0,70 | 987 | 1,54 | ||||
| 2026-01-23 | 13F | Farther Finance Advisors, LLC | 26.553 | 12,55 | 1.983 | 13,51 | ||||
| 2026-01-29 | 13F | Concurrent Investment Advisors, LLC | 9.613 | 31,38 | 718 | 32,29 | ||||
| 2026-02-17 | 13F | Captrust Financial Advisors | 0 | -100,00 | 0 | |||||
| 2026-02-10 | 13F | Hazlett, Burt & Watson, Inc. | 116 | -28,40 | 0 | |||||
| 2026-02-06 | 13F | Csenge Advisory Group | 7.309 | -6,31 | 546 | -5,55 | ||||
| 2026-02-05 | 13F | Cambridge Investment Research Advisors, Inc. | 63.019 | 26,81 | 5 | 33,33 | ||||
| 2026-01-14 | 13F | Southland Equity Partners LLC | 14.555 | 33,21 | 1.087 | 34,36 | ||||
| 2026-02-13 | 13F | Kestra Advisory Services, LLC | 0 | -100,00 | 0 | |||||
| 2026-02-10 | 13F | Essex Financial Services, Inc. | 4.973 | 0,00 | 371 | 0,82 | ||||
| 2026-02-12 | 13F | Steward Partners Investment Advisory, Llc | 30.619 | 10,38 | 2.287 | 11,24 | ||||
| 2026-02-17 | 13F | Integrity Wealth Advisors, Inc. | 8.441 | -54,13 | 630 | -53,78 | ||||
| 2026-01-21 | 13F | MBL Wealth, LLC | 75.575 | 2,96 | 5.644 | 3,79 | ||||
| 2026-02-06 | 13F | Ignite Planners, LLC | 22.814 | -1,51 | 1.725 | 0,47 | ||||
| 2026-02-06 | 13F | IFP Advisors, Inc | 49.871 | 0,24 | 3.725 | 1,03 | ||||
| 2026-01-05 | 13F | GoalVest Advisory LLC | 3.299 | 246 | ||||||
| 2026-02-10 | 13F | Bridge Generations Wealth Management Llc | 13 | 0,00 | 1 | |||||
| 2026-01-26 | 13F | Cwm, Llc | 700 | 0,00 | 0 | |||||
| 2026-01-27 | 13F | Lodestar Private Asset Management Llc | 4.366 | -3,39 | 326 | -2,40 | ||||
| 2026-01-20 | 13F | Investment Planning Advisors, Inc. | 63.724 | 3,87 | 4.759 | 4,71 | ||||
| 2025-10-27 | 13F | Smith Shellnut Wilson Llc /adv | 3.442 | 255 | ||||||
| 2026-01-20 | 13F | Coastal Investment Advisors, Inc. | 203 | 822,73 | 15 | 1.400,00 | ||||
| 2026-02-10 | 13F | CIBC World Markets Inc. | 2.874 | 215 | ||||||
| 2026-02-12 | 13F | Commonwealth Equity Services, Llc | 530.018 | -4,12 | 39.585 | 98.862,50 | ||||
| 2026-02-12 | 13F | Jane Street Group, Llc | 0 | -100,00 | 0 | |||||
| 2025-11-14 | 13F | WNY Asset Management, LLC | 4.520 | -25,65 | 335 | -21,60 | ||||
| 2026-01-28 | 13F | Gentry Private Wealth, Llc | 3.299 | 0,00 | 246 | 0,82 | ||||
| 2026-02-17 | 13F | Advisor Group Holdings, Inc. | 519.190 | -4,33 | 38.781 | -1,82 | ||||
| 2026-02-05 | 13F | Thrivent Financial For Lutherans | 220.287 | 16 | ||||||
| 2026-01-22 | 13F | Pinnacle Bancorp, Inc. | 270 | 0,00 | 20 | 0,00 | ||||
| 2026-02-13 | 13F | Resources Investment Advisors, LLC. | 8.093 | 1,06 | 604 | 1,85 | ||||
| 2026-02-13 | 13F | Level Four Advisory Services, Llc | 119.713 | 1,61 | 8.941 | 2,43 | ||||
| 2026-02-17 | 13F | Tower Research Capital LLC (TRC) | 391 | -94,18 | 29 | -94,16 | ||||
| 2026-01-27 | 13F | Novem Group | 181.327 | -0,50 | 13.543 | 0,30 | ||||
| 2026-02-12 | 13F | StoneX Group Inc. | 3.302 | 247 | ||||||
| 2026-01-28 | 13F | Cora Capital Advisors Llc | 14.777 | 44,89 | 1.104 | 46,09 | ||||
| 2026-02-13 | 13F | Resources Management Corp /ct/ /adv | 4.357 | 0,00 | 0 | |||||
| 2026-02-17 | 13F | Modern Wealth Management, LLC | 8.674 | 25,58 | 648 | 26,61 | ||||
| 2026-02-12 | 13F | Johnson Financial Group, Inc. | 56 | 0,00 | 4 | 0,00 | ||||
| 2026-02-02 | 13F | Fifth Third Bancorp | 473 | 0,00 | 35 | 0,00 | ||||
| 2026-01-29 | 13F | St Germain D J Co Inc | 0 | -100,00 | 0 | |||||
| 2026-01-13 | 13F | Parsons Capital Management Inc/ri | 4.469 | 6,46 | 334 | 7,07 | ||||
| 2026-02-13 | 13F | Kayne Anderson Rudnick Investment Management Llc | 714 | 0,00 | 53 | 1,92 | ||||
| 2026-02-13 | 13F | Morgan Stanley | 4.605 | 2,58 | 344 | 3,31 | ||||
| 2026-01-12 | 13F | DAVENPORT & Co LLC | 88.240 | 8,35 | 6.590 | 9,23 | ||||
| 2026-02-05 | 13F | Atlas Private Wealth Advisors | 5.987 | 23,52 | 447 | 24,51 | ||||
| 2025-11-06 | 13F | BridgePort Financial Solutions, LLC | 0 | -100,00 | 0 | |||||
| 2026-02-09 | 13F | Cary Street Partners Financial Llc | 54.738 | -17,59 | 4.088 | -16,93 | ||||
| 2026-01-21 | 13F | Capital Advisors Wealth Management, LLC | 10.928 | 4,05 | 816 | 4,88 | ||||
| 2026-01-29 | 13F | Comerica Bank | 1.869 | 0,00 | 140 | 0,72 | ||||
| 2026-02-03 | 13F | SFG Wealth Management, LLC. | 36.366 | -35,02 | 2.716 | -34,49 | ||||
| 2026-02-11 | 13F | LPL Financial LLC | 1.203.838 | 1,95 | 89.911 | 2,77 | ||||
| 2026-02-06 | 13F | Advisory Alpha, LLC | 3.729 | 4,42 | 279 | 4,91 | ||||
| 2026-02-17 | 13F | Herold Advisors, Inc. | 17.908 | 9,92 | 1.337 | 10,77 | ||||
| 2026-01-27 | 13F | 5T Wealth, LLC | 13.415 | 38,34 | 1.002 | 39,42 | ||||
| 2026-02-13 | 13F | Financial Network Wealth Advisors LLC | 502 | 0,00 | 37 | 0,00 | ||||
| 2026-02-13 | 13F | Mml Investors Services, Llc | 872.986 | -2,55 | 65.201 | -1,76 | ||||
| 2026-01-29 | 13F | D.a. Davidson & Co. | 61.332 | 2,56 | 4.581 | 3,39 | ||||
| 2026-02-03 | 13F | International Assets Investment Management, Llc | 1.797 | 134 | ||||||
| 2026-02-17 | 13F | Snowden Capital Advisors LLC | 7.864 | -2,06 | 587 | -1,18 | ||||
| 2026-01-28 | 13F | Kingswood Wealth Advisors, Llc | 3.216 | -25,02 | 240 | -24,29 | ||||
| 2026-02-17 | 13F | Equitable Holdings, Inc. | 36.535 | -4,51 | 2.729 | -3,74 | ||||
| 2026-02-17 | 13F | Susquehanna International Group, Llp | 21.365 | 158,88 | 1.596 | 161,05 | ||||
| 2026-02-04 | 13F | MONECO Advisors, LLC | 232.019 | 3,68 | 17.329 | 4,52 | ||||
| 2026-01-29 | 13F | Kestra Private Wealth Services, Llc | 4.655 | 9,17 | 348 | 10,16 | ||||
| 2026-01-21 | 13F | Capital Advisors, Ltd. LLC | 15.294 | -6,13 | 1 | 0,00 | ||||
| 2026-02-17 | 13F | Fmr Llc | 41 | 0,00 | 3 | 0,00 | ||||
| 2026-01-26 | 13F | Private Trust Co Na | 1.714 | 0,00 | 128 | 1,59 | ||||
| 2026-02-17 | 13F | Mercer Global Advisors Inc /adv | 7.383 | 0,71 | 551 | 1,47 | ||||
| 2026-02-12 | 13F | Brinker Capital Investments, LLC | 5.431 | 406 | ||||||
| 2026-01-30 | 13F | Us Bancorp \de\ | 804 | 0,63 | 60 | 1,69 | ||||
| 2026-02-17 | 13F | Advisory Services Network, LLC | 0 | -100,00 | 0 | |||||
| 2026-02-17 | 13F | Private Advisor Group, LLC | 10.280 | 1,39 | 768 | 2,13 | ||||
| 2026-01-22 | 13F | Castle Wealth Management Llc | 69.038 | -5,07 | 5.156 | -4,31 | ||||
| 2026-01-21 | 13F | Balance Wealth, LLC | 363.655 | 5,69 | 27.160 | 6,54 | ||||
| 2026-01-16 | 13F | Morangie Management LLC | 15.020 | 0,00 | 1.122 | 0,81 | ||||
| 2026-01-23 | 13F | Fifth Third Securities, Inc. | 43.639 | -19,88 | 3.259 | -19,23 | ||||
| 2026-01-08 | 13F | Wealth Enhancement Advisory Services, Llc | 4.197 | -41,45 | 316 | -40,60 | ||||
| 2026-02-17 | 13F | Raymond James Financial Inc | 2.219.880 | 1,96 | 165.796 | 2,78 | ||||
| 2026-02-13 | 13F | Denver Wealth Management, Inc. | 4.883 | 0,00 | 365 | 0,83 | ||||
| 2026-02-10 | 13F/A | Northwestern Mutual Wealth Management Co | 93.254 | 19,31 | 6.965 | 20,28 | ||||
| 2026-01-23 | 13F | Northland Securities, Inc. | 3.392 | 253 | ||||||
| 2026-02-11 | 13F | Jpmorgan Chase & Co | 79.092 | 11,03 | 5.907 | 11,94 | ||||
| 2026-01-09 | 13F | Leverty Financial Group, LLC | 322.105 | 0,35 | 24.057 | 1,18 | ||||
| 2026-01-26 | 13F | Prosperity Financial Group, Inc. | 12.865 | -3,91 | 961 | -3,13 | ||||
| 2026-02-09 | 13F | HBK Sorce Advisory LLC | 2.818 | 213 | ||||||
| 2026-02-13 | 13F | Brown Advisory Inc | 4.248 | 0,00 | 317 | 0,96 | ||||
| 2026-02-17 | 13F | United Capital Financial Advisers, Llc | 10.134 | 756 | ||||||
| 2026-02-17 | 13F | Jones Financial Companies Lllp | 512.759 | 9,66 | 38.296 | 10,65 | ||||
| 2026-02-10 | 13F | Envestnet Asset Management Inc | 113.630 | -1,21 | 8.487 | -0,42 | ||||
| 2026-02-11 | 13F | Capital Analysts, Inc. | 9.478 | 282,33 | 1 | |||||
| 2026-02-17 | 13F | Citadel Advisors Llc | 9.235 | 58,54 | 690 | 59,86 | ||||
| 2026-02-17 | 13F | D L Carlson Investment Group Inc | 34.220 | 8,76 | 2.556 | 9,61 | ||||
| 2025-11-05 | 13F | SPC Financial, Inc. | 142.141 | 11,38 | 10.531 | 17,66 | ||||
| 2026-02-03 | 13F | Crestwood Advisors Group LLC | 83.606 | 52,09 | 6.244 | 53,34 | ||||
| 2025-11-18 | 13F | Apexium Financial, Lp | 10.134 | 751 | ||||||
| 2026-02-17 | 13F | Royal Bank Of Canada | 232.478 | 7,84 | 17.363 | 8,71 | ||||
| 2026-01-16 | 13F | Beaumont Financial Advisors, LLC | 513.115 | -1,31 | 38.323 | -0,52 | ||||
| 2026-01-06 | 13F | First Citizens Financial Corp | 17.443 | 10,66 | 1.303 | 11,57 | ||||
| 2026-02-13 | 13F | Cozad Asset Management Inc | 140.740 | -0,11 | 10.511 | 0,70 | ||||
| 2026-02-17 | 13F | Ameriprise Financial Inc | 5.224 | 390 | ||||||
| 2026-02-02 | 13F | Mutual Advisors, LLC | 36.126 | 9,57 | 2.698 | 9,67 | ||||
| 2026-01-27 | 13F | Godsey & Gibb Associates | 773 | 58 | ||||||
| 2026-02-06 | 13F | Global Retirement Partners, LLC | 872 | -16,63 | 65 | -15,58 | ||||
| 2026-01-29 | 13F | UBS Group AG | 2.089 | -62,33 | 156 | -61,95 | ||||
| 2026-02-17 | 13F | NCP Inc. | 4.154 | 310 | ||||||
| 2026-01-16 | 13F | DiNuzzo Private Wealth, Inc. | 278 | 0,00 | 21 | 0,00 |