Grundlæggende statistik
| Institutionelle ejere | 273 total, 273 long only, 0 short only, 0 long/short - change of 1,11% MRQ |
| Gennemsnitlig porteføljeallokering | 0.0821 % - change of -21,31% MRQ |
| Institutionelle aktier (lange) | 32.347.736 (ex 13D/G) - change of 0,35MM shares 1,10% MRQ |
| Institutionel værdi (lang) | $ 2.749.629 USD ($1000) |
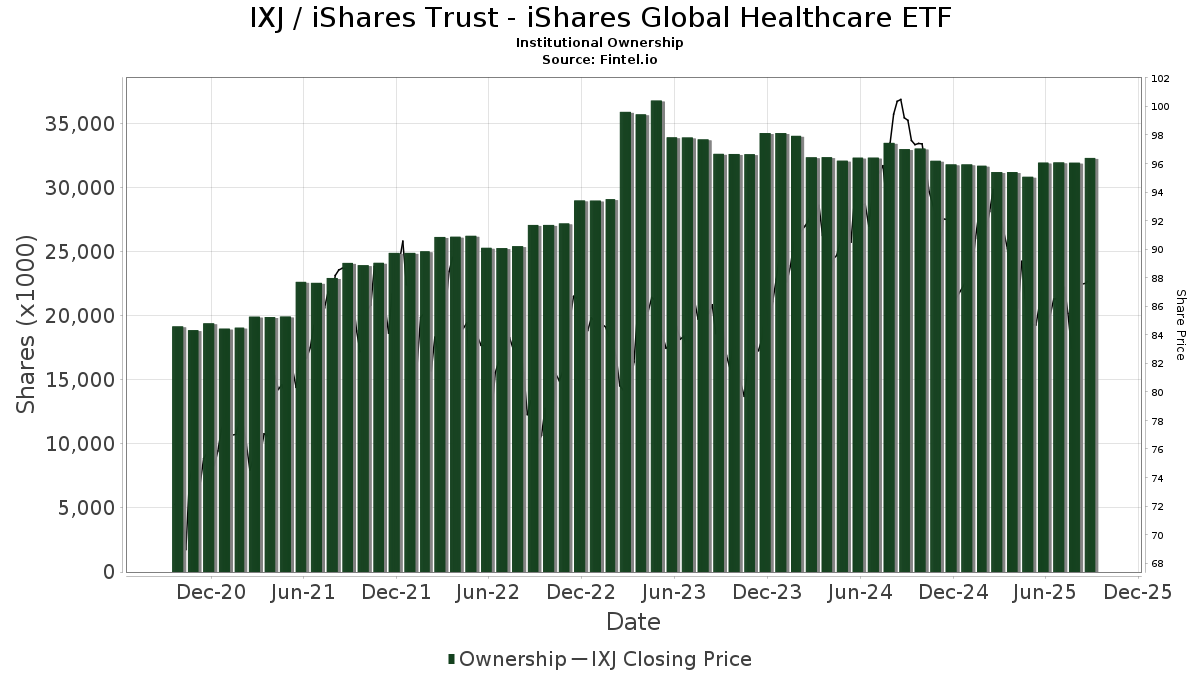
Institutionelt ejerskab og aktionærer
iShares Trust - iShares Global Healthcare ETF (US:IXJ) har 273 institutionelle ejere og aktionærer, der har indsendt 13D/G- eller 13F-formularer til Securities Exchange Commission (SEC). Disse institutioner har i alt 32,347,736 aktier. Største aktionærer omfatter BlackRock, Inc., Fisher Asset Management, LLC, Bank Of America Corp /de/, Richard Bernstein Advisors LLC, Phoenix Holdings Ltd., Ameriprise Financial Inc, Jpmorgan Chase & Co, Morgan Stanley, Federation des caisses Desjardins du Quebec, and Royal Bank Of Canada .
iShares Trust - iShares Global Healthcare ETF (ARCA:IXJ) institutionel ejerskabsstruktur viser aktuelle positioner i virksomheden efter institutioner og fonde, samt seneste ændringer i positionsstørrelse. Større aktionærer kan omfatte individuelle investorer, investeringsforeninger, hedgefonde eller institutioner. Skema 13D angiver, at investoren besidder (eller besidder) mere end 5 % af virksomheden og har til hensigt (eller har til hensigt at) aktivt at forfølge en ændring i forretningsstrategi. Skema 13G indikerer en passiv investering på over 5%.
The share price as of September 12, 2025 is 88,15 / share. Previously, on September 13, 2024, the share price was 99,66 / share. This represents a decline of 11,55% over that period.
Fondens stemningsscore
Fund Sentiment Score (fka Ownership Accumulation Score) finder de aktier, der bliver mest købt af fonde. Det er resultatet af en sofistikeret, multi-faktor kvantitativ model, der identificerer virksomheder med de højeste niveauer af institutionel akkumulering. Scoringsmodellen bruger en kombination af den samlede stigning i oplyste ejere, ændringerne i porteføljeallokeringer i disse ejere og andre målinger. Tallet går fra 0 til 100, hvor højere tal indikerer et højere niveau af akkumulering for sine jævnaldrende, og 50 er gennemsnittet.
Opdateringsfrekvens: Dagligt
Se Ownership Explorer, som giver en liste over højest rangerende virksomheder.
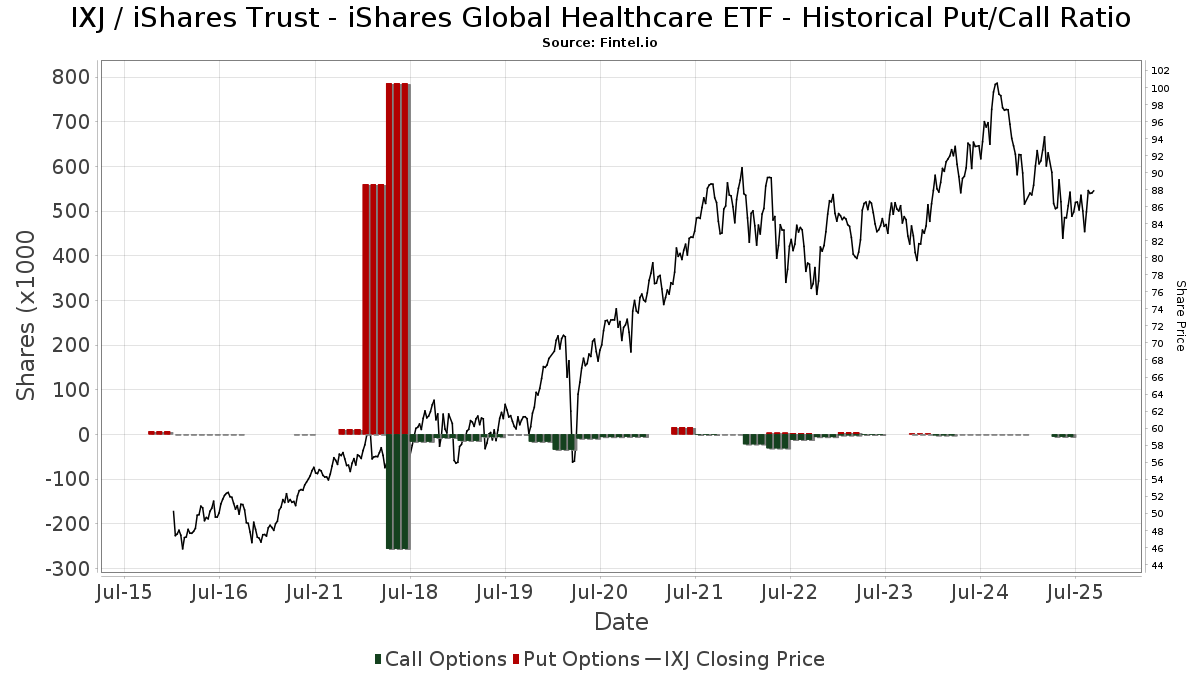
Institutionel Put/Call-forhold
Ud over at indberette standardaktie- og gældsudstedelser skal institutter med mere end 100 mill. aktiver under forvaltning også oplyse deres put- og call-optionsbeholdninger. Da salgsoptioner generelt indikerer negativ stemning, og købsoptioner indikerer positiv stemning, kan vi få en fornemmelse af den overordnede institutionelle stemning ved at plotte forholdet mellem put og kald. Diagrammet til højre viser det historiske put/call-forhold for dette instrument.
Brug af Put/Call Ratio som en indikator for investorernes stemning overvinder en af de vigtigste mangler ved at bruge totalt institutionelt ejerskab, som er, at en betydelig mængde af aktiver under forvaltning investeres passivt for at spore indekser. Passivt forvaltede fonde køber typisk ikke optioner, så indikatoren for put/call-forholdet følger mere nøje følelsen af aktivt forvaltede fonde.
13D/G-arkivering
Vi præsenterer 13D/G ansøgninger separat fra 13F ansøgninger på grund af den forskellige behandling af SEC. 13D/G-ansøgninger kan indgives af grupper af investorer (med én ledende), hvorimod 13F-ansøgninger ikke kan. Dette resulterer i situationer, hvor en investor kan indsende en 13D/G, der rapporterer én værdi for de samlede aktier (der repræsenterer alle de aktier, der ejes af investorgruppen), men derefter indsender en 13F, der rapporterer en anden værdi for de samlede aktier (der udelukkende repræsenterer deres egne) ejendomsret). Det betyder, at aktieejerskab af 13D/G-arkiver og 13F-arkiveringer ofte ikke er direkte sammenlignelige, så vi præsenterer dem separat.
Bemærk: Fra den 16. maj 2021 viser vi ikke længere ejere, der ikke har indsendt en 13D/G inden for det seneste år. Tidligere viste vi den fulde historie af 13D/G-arkiver. Generelt skal enheder, der er forpligtet til at indgive 13D/G-ansøgninger, indgive mindst årligt, før de indsender en afsluttende ansøgning. Dog forlader fonde nogle gange positioner uden at indsende en afsluttende ansøgning (dvs. de afvikler), så visning af den fulde historie resulterede nogle gange i forvirring om det nuværende ejerskab. For at undgå forvirring viser vi nu kun 'aktuelle' ejere - det vil sige - ejere, der har anmeldt inden for det seneste år.
Upgrade to unlock premium data.
| Fil dato | Form | Investor | Forrige Aktier |
Seneste Aktier |
Δ Aktier (Procent) |
Ejendomsret (Procent) |
Δ Ejerskab (Procent) |
|
|---|---|---|---|---|---|---|---|---|
| 2025-04-17 | BlackRock, Inc. | 10,000,920 | 9,755,630 | -2.45 | 22.50 | -5.86 | ||
| 2025-02-07 | BlackRock Portfolio Management LLC | 4,239,124 | 10.10 |
13F og NPORT arkivering
Detaljer om 13F-arkivering er gratis. Detaljer om NP-ansøgninger kræver et premium-medlemskab. Grønne rækker angiver nye positioner. Røde rækker angiver lukkede positioner. Klik på linket ikon for at se den fulde transaktionshistorik.
Opgrader
for at låse premium-data op og eksportere til Excel ![]() .
.
| Fil dato | Kilde | Investor | Type | Gennemsnitlig pris (Øst) |
Aktier | Δ Aktier (%) |
Rapporteret Værdi ($1000) |
Δ Værdi (%) |
Port Alloc (%) |
|
|---|---|---|---|---|---|---|---|---|---|---|
| 2025-08-05 | 13F | Huntington National Bank | 94 | 1.450,00 | ||||||
| 2025-07-22 | 13F | Beacon Financial Advisory LLC | 2.790 | -27,61 | 240 | -31,62 | ||||
| 2025-08-14 | 13F | Wharton Business Group, LLC | 2.396 | 0,00 | 0 | |||||
| 2025-08-07 | 13F | Allworth Financial LP | 739 | 1.747,50 | 64 | 2.000,00 | ||||
| 2025-08-14 | 13F | Ameriprise Financial Inc | 915.169 | 5.522,47 | 78.789 | 5.209,23 | ||||
| 2025-08-14 | 13F | D. E. Shaw & Co., Inc. | 3.860 | 332 | ||||||
| 2025-08-15 | 13F | Captrust Financial Advisors | 12.948 | 1,01 | 1.115 | -4,70 | ||||
| 2025-06-03 | 13F | Invst, LLC | 15.958 | 1.455 | ||||||
| 2025-08-04 | 13F | Creative Financial Designs Inc /adv | 0 | -100,00 | 0 | |||||
| 2025-08-13 | 13F | Russell Investments Group, Ltd. | 231 | -11,83 | 20 | -17,39 | ||||
| 2025-08-19 | 13F | Advisory Services Network, LLC | 8.756 | 7,03 | 727 | -2,55 | ||||
| 2025-08-06 | 13F | Golden State Wealth Management, LLC | 44 | 0,00 | 4 | -25,00 | ||||
| 2025-08-08 | 13F | Kingsview Wealth Management, LLC | 4.846 | 0,02 | 417 | -5,44 | ||||
| 2025-08-11 | 13F | Strategic Wealth Partners, Ltd. | 421 | 36 | ||||||
| 2025-08-12 | 13F | Gladstone Institutional Advisory LLC | 5.437 | -0,11 | 468 | -5,65 | ||||
| 2025-08-13 | 13F | Cary Street Partners Financial Llc | 0 | -100,00 | 0 | |||||
| 2025-05-14 | 13F | Pilgrim Partners Asia Pte Ltd | 0 | -100,00 | 0 | |||||
| 2025-07-16 | 13F | Signaturefd, Llc | 39 | 8,33 | 3 | 0,00 | ||||
| 2025-08-12 | 13F | Fca Corp /tx | 53.935 | 1,36 | 4.643 | -4,31 | ||||
| 2025-08-14 | 13F | Mariner, LLC | 5.302 | 0,40 | 456 | -5,20 | ||||
| 2025-07-30 | NP | ENDW - Cambria Endowment Style ETF | 151 | 13 | ||||||
| 2025-07-15 | 13F | North Star Investment Management Corp. | 179 | 0,56 | 15 | -6,25 | ||||
| 2025-07-14 | 13F | UMA Financial Services, Inc. | 336 | 0,90 | 29 | -6,67 | ||||
| 2025-08-12 | 13F | Proequities, Inc. | 0 | 0 | ||||||
| 2025-08-18 | 13F | Hollencrest Capital Management | 315 | 0,00 | 27 | -3,57 | ||||
| 2025-07-25 | 13F | Envestnet Portfolio Solutions, Inc. | 2.528 | 11,51 | 218 | 5,34 | ||||
| 2025-08-13 | 13F/A | StoneX Group Inc. | 4.550 | 399 | ||||||
| 2025-07-18 | 13F | Union Bancaire Privee, UBP SA | 1.750 | 0,00 | 150 | -5,70 | ||||
| 2025-08-05 | 13F | Bank Of Montreal /can/ | 94.521 | -15,49 | 8.137 | -20,23 | ||||
| 2025-04-21 | NP | ETHSX - Eaton Vance Worldwide Health Sciences Fund Class A | 20.027 | -56,80 | 1.866 | -56,49 | ||||
| 2025-08-11 | 13F | Cordatus Wealth Management LLC | 3.338 | 0,00 | 0 | |||||
| 2025-07-25 | 13F | Sequoia Financial Advisors, LLC | 11.557 | 8,66 | 995 | 2,47 | ||||
| 2025-05-01 | 13F | Quest 10 Wealth Builders, Inc. | 32 | 0,00 | 3 | 0,00 | ||||
| 2025-07-25 | 13F | Community Bank, N.A. | 105 | -54,35 | 9 | -55,00 | ||||
| 2025-08-14 | 13F/A | Skopos Labs, Inc. | 363 | 31 | ||||||
| 2025-08-06 | 13F | Commonwealth Equity Services, Llc | 85.648 | -9,39 | 7 | -12,50 | ||||
| 2025-07-16 | 13F | Meridian Investment Counsel Inc. | 11.703 | -0,14 | 1.008 | -5,71 | ||||
| 2025-08-05 | 13F | Key FInancial Inc | 20 | -74,36 | 2 | -85,71 | ||||
| 2025-08-04 | 13F | Arkadios Wealth Advisors | 0 | -100,00 | 0 | |||||
| 2025-07-24 | 13F | Us Bancorp \de\ | 1.952 | 14,76 | 168 | 8,39 | ||||
| 2025-08-05 | 13F | GPS Wealth Strategies Group, LLC | 207 | -26,33 | 18 | -32,00 | ||||
| 2025-08-06 | 13F | Maltin Wealth Management, Inc. | 9.059 | 0,87 | 780 | -4,88 | ||||
| 2025-07-22 | 13F | Partners Wealth Management, Llc | 10.547 | 0,00 | 946 | -1,56 | ||||
| 2025-08-07 | 13F | Cahill Financial Advisors Inc | 4.626 | 0,00 | 398 | -5,46 | ||||
| 2025-07-10 | 13F | Wealth Enhancement Advisory Services, Llc | 5.132 | 15,40 | 443 | 9,14 | ||||
| 2025-08-11 | 13F | Y.D. More Investments Ltd | 380 | 9,83 | 33 | 3,23 | ||||
| 2025-07-08 | 13F/A | Salem Investment Counselors Inc | 1.400 | 0,00 | 121 | -5,51 | ||||
| 2025-08-12 | 13F | Aviso Financial Inc. | 122 | 10 | ||||||
| 2025-08-12 | 13F | Atlas Capital Advisors Llc | 351 | 0,00 | 30 | -6,25 | ||||
| 2025-05-13 | 13F | Bokf, Na | 0 | -100,00 | 0 | |||||
| 2025-08-06 | 13F | Paladin Advisory Group, LLC | 420 | 0,00 | 36 | -5,26 | ||||
| 2025-08-14 | 13F | Glenmede Investment Management, LP | 533 | 46 | ||||||
| 2025-05-06 | 13F | Venturi Wealth Management, LLC | 0 | -100,00 | 0 | |||||
| 2025-08-14 | 13F | Goldman Sachs Group Inc | 35.355 | 59,10 | 3.044 | 50,20 | ||||
| 2025-07-28 | 13F | Harbour Investments, Inc. | 1.077 | 216,76 | 93 | 196,77 | ||||
| 2025-08-08 | 13F | Avantax Advisory Services, Inc. | 0 | -100,00 | 0 | |||||
| 2025-08-11 | 13F | Aptus Capital Advisors, LLC | 1.127 | -2,42 | 97 | -7,62 | ||||
| 2025-07-30 | 13F | Whittier Trust Co | 0 | -100,00 | 0 | |||||
| 2025-08-13 | 13F | Transce3nd, LLC | 53 | 5 | ||||||
| 2025-07-17 | 13F | HB Wealth Management, LLC | 0 | -100,00 | 0 | |||||
| 2025-07-14 | 13F | Opal Wealth Advisors, LLC | 863 | -24,89 | 74 | -28,85 | ||||
| 2025-07-11 | 13F | Bond & Devick Financial Network, Inc. | 5.357 | -3,43 | 461 | -8,71 | ||||
| 2025-08-26 | NP | Forethought Variable Insurance Trust - Global Atlantic BlackRock Selects Managed Risk Portfolio (formerly Global Atlantic BlackRock Global Allocation Managed Risk Portfolio) Global Atlantic BlackRock Global Allocation Managed Risk Portfolio | 30.625 | -19,50 | 2.637 | -24,01 | ||||
| 2025-08-14 | 13F | Optiver Holding B.V. | 0 | -100,00 | 0 | |||||
| 2025-07-18 | 13F | Access Financial Services, Inc. | 25.082 | 0,93 | 2.159 | -4,72 | ||||
| 2025-08-06 | 13F | Moors & Cabot, Inc. | 2.324 | 0,00 | 200 | -5,21 | ||||
| 2025-04-30 | 13F | Sofos Investments, Inc. | 320 | -22,71 | 29 | -23,68 | ||||
| 2025-05-14 | 13F | Flow Traders U.s. Llc | 0 | -100,00 | 0 | |||||
| 2025-07-17 | 13F | Janney Montgomery Scott LLC | 35.915 | -1,91 | 3 | 0,00 | ||||
| 2025-07-30 | 13F | White Lighthouse Investment Management Inc. | 19.426 | 0,78 | 1.672 | -4,84 | ||||
| 2025-08-05 | 13F | Wakefield Asset Management LLLP | 0 | -100,00 | 0 | |||||
| 2025-07-28 | 13F | Courier Capital Llc | 5.067 | -18,55 | 436 | -23,10 | ||||
| 2025-05-01 | 13F | Ballentine Partners, LLC | 0 | -100,00 | 0 | |||||
| 2025-08-12 | 13F | O'shaughnessy Asset Management, Llc | 1.458 | -4,64 | 126 | -10,07 | ||||
| 2025-05-15 | 13F | Williams & Novak, LLC | 0 | -100,00 | 0 | |||||
| 2025-07-14 | 13F | Park Avenue Securities Llc | 20.567 | -1,31 | 2 | 0,00 | ||||
| 2025-08-13 | 13F | Beacon Pointe Advisors, LLC | 3.792 | 0,00 | 326 | -5,51 | ||||
| 2025-08-14 | 13F | Stifel Financial Corp | 17.846 | 21,04 | 1.536 | 14,29 | ||||
| 2025-08-05 | 13F | Bridgewater Advisors Inc. | 3.748 | 0,00 | 321 | -3,02 | ||||
| 2025-08-07 | 13F | Kestra Private Wealth Services, Llc | 2.842 | -5,89 | 245 | -11,27 | ||||
| 2025-08-12 | 13F | Franklin Resources Inc | 360 | 80,00 | 31 | 66,67 | ||||
| 2025-07-31 | 13F/A | Interchange Capital Partners, LLC | 6.292 | 11,74 | 542 | 5,46 | ||||
| 2025-07-24 | 13F | Eastern Bank | 128 | -61,21 | 11 | -63,33 | ||||
| 2025-07-08 | 13F | Webster Bank, N. A. | 2.975 | -5,41 | 256 | -10,49 | ||||
| 2025-08-13 | 13F | Smith, Moore & Co. | 0 | -100,00 | 0 | |||||
| 2025-09-04 | 13F/A | Advisor Group Holdings, Inc. | 32.370 | 27,66 | 2.789 | 20,54 | ||||
| 2025-08-13 | 13F | Northern Trust Corp | 3.305 | 285 | ||||||
| 2025-08-07 | 13F | LFA - Lugano Financial Advisors SA | 0 | -100,00 | 0 | |||||
| 2025-08-12 | 13F | SRS Capital Advisors, Inc. | 352 | 0,00 | 30 | -6,25 | ||||
| 2025-08-05 | 13F | Dunhill Financial, LLC | 957 | 82 | ||||||
| 2025-08-12 | 13F | J.w. Cole Advisors, Inc. | 3.634 | 14,24 | 313 | 7,59 | ||||
| 2025-08-11 | 13F | ICICI Prudential Asset Management Co Ltd | 12.675 | 0,00 | 1.091 | -5,63 | ||||
| 2025-08-19 | 13F | Anchor Investment Management, LLC | 7.468 | -2,42 | 643 | -7,89 | ||||
| 2025-07-24 | 13F | Ronald Blue Trust, Inc. | 4.673 | 16,16 | 402 | 9,84 | ||||
| 2025-07-18 | 13F | Founders Capital Management | 76 | 0,00 | 7 | 0,00 | ||||
| 2025-07-31 | 13F | Ground Swell Capital, LLC | 7.867 | 677 | ||||||
| 2025-08-04 | 13F | Atria Investments Llc | 12.853 | 15,91 | 1.107 | 9,40 | ||||
| 2025-08-08 | 13F | Hartland & Co., LLC | 600 | 0,00 | 52 | -5,56 | ||||
| 2025-08-14 | 13F | Mercer Global Advisors Inc /adv | 14.730 | -9,37 | 1.268 | -14,44 | ||||
| 2025-08-14 | 13F | Graney & King, LLC | 10 | 0,00 | 1 | |||||
| 2025-08-13 | 13F | WCG Wealth Advisors LLC | 11.091 | -31,71 | 955 | -35,58 | ||||
| 2025-08-14 | 13F | Bank Of America Corp /de/ | 2.539.651 | 6,31 | 218.639 | 0,35 | ||||
| 2025-08-15 | 13F | Provenance Wealth Advisors, LLC | 1.117 | 0,00 | 96 | -4,95 | ||||
| 2025-07-30 | 13F | Exencial Wealth Advisors, Llc | 0 | -100,00 | 0 | |||||
| 2025-07-24 | 13F | Blair William & Co/il | 2.028 | -1,12 | 175 | -6,95 | ||||
| 2025-08-12 | 13F | CIBC Private Wealth Group, LLC | 0 | -100,00 | 0 | |||||
| 2025-07-30 | 13F | Princeton Global Asset Management LLC | 871 | 0,11 | 75 | -6,33 | ||||
| 2025-08-05 | 13F | Continuum Wealth Advisors, Llc | 3.271 | 0,00 | 282 | -5,70 | ||||
| 2025-08-14 | 13F | IHT Wealth Management, LLC | 12.614 | 1.086 | ||||||
| 2025-08-15 | 13F | Equitable Holdings, Inc. | 85.288 | -7,34 | 7.342 | -12,53 | ||||
| 2025-08-15 | 13F | CI Private Wealth, LLC | 2.736 | -79,27 | 236 | -80,47 | ||||
| 2025-08-04 | 13F | Hantz Financial Services, Inc. | 363 | 0 | ||||||
| 2025-08-07 | 13F | Nwam Llc | 5.203 | -3,74 | 445 | -9,76 | ||||
| 2025-08-06 | 13F | Prospera Financial Services Inc | 3.965 | 6,02 | 341 | 0,00 | ||||
| 2025-07-21 | 13F | Ameriflex Group, Inc. | 408 | 0,00 | 35 | -8,11 | ||||
| 2025-08-14 | 13F | Fmr Llc | 13.759 | -1,08 | 1.184 | -6,62 | ||||
| 2025-08-12 | 13F | MAI Capital Management | 7.907 | -14,65 | 681 | -19,43 | ||||
| 2025-08-04 | 13F | ELCO Management Co., LLC | 6.809 | -1,45 | 586 | -6,98 | ||||
| 2025-07-09 | 13F | Fiduciary Alliance LLC | 3.677 | 0,79 | 317 | -4,82 | ||||
| 2025-08-14 | 13F | Comerica Bank | 4.428 | -20,23 | 381 | -24,70 | ||||
| 2025-07-25 | 13F | Atria Wealth Solutions, Inc. | 7.960 | 6,56 | 686 | 0,59 | ||||
| 2025-05-12 | 13F | Sandy Spring Bank | 450 | 0,00 | 41 | 7,89 | ||||
| 2025-07-21 | 13F | Mirae Asset Global Investments Co., Ltd. | 48.500 | -3,48 | 4.175 | -8,46 | ||||
| 2025-08-14 | 13F | Smartleaf Asset Management LLC | 100 | 0,00 | 9 | -11,11 | ||||
| 2025-07-21 | 13F | J. Safra Sarasin Holding AG | 0 | -100,00 | 0 | |||||
| 2025-07-24 | 13F | Trust Co Of Toledo Na /oh/ | 44 | 4 | ||||||
| 2025-08-14 | 13F | EP Wealth Advisors, Inc. | 4.388 | -2,90 | 378 | -8,50 | ||||
| 2025-07-17 | 13F | Halbert Hargrove Global Advisors, Llc | 124 | 0,00 | 11 | -9,09 | ||||
| 2025-08-01 | 13F | Envestnet Asset Management Inc | 237.238 | 6,07 | 20.424 | 0,13 | ||||
| 2025-08-14 | 13F | Federation des caisses Desjardins du Quebec | 314.949 | 6,91 | 27.114 | 0,92 | ||||
| 2025-08-14 | 13F | Royal Bank Of Canada | 276.073 | 5,89 | 23.767 | -0,04 | ||||
| 2025-07-29 | 13F | Signature Estate & Investment Advisors Llc | 19.525 | -2,00 | 1.681 | -7,49 | ||||
| 2025-08-07 | 13F | Resources Investment Advisors, LLC. | 0 | -100,00 | 0 | |||||
| 2025-08-08 | 13F | Pnc Financial Services Group, Inc. | 9.412 | -0,69 | 810 | -6,25 | ||||
| 2025-08-11 | 13F | Citigroup Inc | 54.469 | -0,50 | 4.689 | -6,07 | ||||
| 2025-08-13 | 13F | Cerity Partners LLC | 5.086 | 3,50 | 438 | -2,46 | ||||
| 2025-07-14 | 13F | U.S. Capital Wealth Advisors, LLC | 0 | -100,00 | 0 | |||||
| 2025-08-07 | 13F | Evoke Wealth, Llc | 3.261 | 281 | ||||||
| 2025-08-12 | 13F | Howe & Rusling Inc | 0 | -100,00 | 0 | |||||
| 2025-08-14 | 13F | Mml Investors Services, Llc | 9.899 | 3,60 | 1 | |||||
| 2025-08-08 | 13F | Cetera Investment Advisers | 37.103 | 1,94 | 3.194 | -3,77 | ||||
| 2025-08-11 | 13F | Principal Securities, Inc. | 346 | -34,22 | 30 | -35,56 | ||||
| 2025-08-14 | 13F | Bnp Paribas Arbitrage, Sa | 87.969 | -8,90 | 7.573 | -14,00 | ||||
| 2025-07-08 | 13F | Nbc Securities, Inc. | 298 | 79,52 | 0 | |||||
| 2025-07-22 | 13F | Apexium Financial, Lp | 42.126 | -0,72 | 3.627 | -6,28 | ||||
| 2025-05-15 | 13F | Millennium Management Llc | 0 | -100,00 | 0 | -100,00 | ||||
| 2025-07-24 | 13F | IFP Advisors, Inc | 1.479 | 37,84 | 127 | 30,93 | ||||
| 2025-08-12 | 13F | Pathstone Holdings, LLC | 15.694 | -9,44 | 1.351 | -14,49 | ||||
| 2025-08-12 | 13F | Tocqueville Asset Management L.p. | 6.289 | -55,59 | 541 | -58,09 | ||||
| 2025-08-12 | 13F | LPL Financial LLC | 130.476 | -9,11 | 11.233 | -14,21 | ||||
| 2025-08-12 | 13F | Fairscale Capital, LLC | 118 | 10 | ||||||
| 2025-08-14 | 13F | Raymond James Financial Inc | 152.995 | -2,40 | 13.171 | -7,87 | ||||
| 2025-07-22 | 13F | SOL Capital Management CO | 3.400 | 0,00 | 0 | |||||
| 2025-08-06 | 13F | Ipsen Advisor Group LLC | 11.942 | 5,20 | 1.028 | -0,68 | ||||
| 2025-08-07 | 13F | Rathbone Brothers plc | 26.024 | 16,05 | 2.240 | 9,54 | ||||
| 2025-07-08 | 13F | Parallel Advisors, LLC | 0 | -100,00 | 0 | |||||
| 2025-07-11 | 13F | Farther Finance Advisors, LLC | 651 | -6,73 | 56 | -9,68 | ||||
| 2025-07-24 | 13F | Wealthstar Advisors, Llc | 2.946 | 0,24 | 254 | -5,24 | ||||
| 2025-05-15 | 13F | Sonoma Private Wealth LLC | 0 | -100,00 | 0 | |||||
| 2025-07-17 | 13F | Oakworth Capital, Inc. | 400 | 0,00 | 34 | -5,56 | ||||
| 2025-05-14 | 13F | Van Hulzen Asset Management, LLC | 0 | -100,00 | 0 | -100,00 | ||||
| 2025-08-13 | 13F | Continuum Advisory, LLC | 0 | -100,00 | 0 | |||||
| 2025-08-14 | 13F | Wells Fargo & Company/mn | 219.254 | -10,47 | 18.876 | -15,49 | ||||
| 2025-07-28 | 13F | BRYN MAWR TRUST Co | 450 | 0,00 | 39 | -7,32 | ||||
| 2025-08-11 | 13F | HighTower Advisors, LLC | 131.116 | 2,10 | 11.288 | -3,63 | ||||
| 2025-08-14 | 13F | Two Sigma Securities, Llc | 3.982 | 343 | ||||||
| 2025-08-13 | 13F | Northwestern Mutual Wealth Management Co | 27.830 | 29,97 | 2.396 | 22,69 | ||||
| 2025-08-08 | 13F | Creative Planning | 42.049 | -0,48 | 3.620 | -6,07 | ||||
| 2025-08-14 | 13F | Hilltop Holdings Inc. | 2.325 | 200 | ||||||
| 2025-08-14 | 13F/A | Barclays Plc | 115.760 | 0,00 | 10 | -10,00 | ||||
| 2025-07-17 | 13F | BFI Infinity Ltd. | 4.150 | 12,16 | 357 | 5,93 | ||||
| 2025-08-14 | 13F | Colony Group, LLC | 2.506 | 216 | ||||||
| 2025-07-31 | 13F | Money Design Co.,Ltd. | 67.069 | 0,97 | 6 | -16,67 | ||||
| 2025-08-13 | 13F | Fisher Asset Management, LLC | 6.903.794 | -5,35 | 594.348 | -10,65 | ||||
| 2025-04-21 | 13F | Nelson, Van Denburg & Campbell Wealth Management Group, LLC | 0 | -100,00 | 0 | |||||
| 2025-08-08 | 13F | WASHINGTON TRUST Co | 0 | -100,00 | 0 | |||||
| 2025-07-24 | 13F | Advanced Asset Management Advisors Inc | 16 | 0,00 | 1 | 0,00 | ||||
| 2025-04-18 | 13F | DHJJ Financial Advisors, Ltd. | 0 | -100,00 | 0 | |||||
| 2025-08-06 | 13F | Savant Capital, LLC | 2.987 | 0,13 | 257 | -5,51 | ||||
| 2025-07-29 | 13F | Harbor Asset Planning, Inc. | 1.283 | 110 | ||||||
| 2025-08-04 | 13F | Creekmur Asset Management LLC | 3 | 0,00 | 0 | |||||
| 2025-08-08 | 13F | Family Firm, Inc. | 22.381 | 4,46 | 1.927 | -1,43 | ||||
| 2025-07-21 | 13F | Pflug Koory, LLC | 58 | 0,00 | 5 | -20,00 | ||||
| 2025-07-16 | 13F | Patron Partners Advisors, Llc | 3.922 | -19,93 | 338 | -24,44 | ||||
| 2025-08-14 | 13F | Integrated Wealth Concepts LLC | 4.350 | -30,21 | 374 | -34,15 | ||||
| 2025-08-19 | 13F | Cape Investment Advisory, Inc. | 58 | 0,00 | 5 | -20,00 | ||||
| 2025-08-08 | 13F | Everett Harris & Co /ca/ | 4.630 | 0,00 | 399 | -5,69 | ||||
| 2025-08-14 | 13F | Snowden Capital Advisors LLC | 15.062 | -3,26 | 1.297 | -8,67 | ||||
| 2025-07-18 | 13F | Lynx Investment Advisory | 3.512 | 14,25 | 302 | 7,86 | ||||
| 2025-08-11 | 13F | Banque Cantonale Vaudoise | 898 | 0,00 | 0 | |||||
| 2025-04-29 | 13F | Lee Danner & Bass Inc | 0 | -100,00 | 0 | -100,00 | ||||
| 2025-08-06 | 13F | First Horizon Advisors, Inc. | 1.200 | 0,00 | 103 | -5,50 | ||||
| 2025-07-25 | 13F | Cwm, Llc | 10.314 | 1,55 | 1 | |||||
| 2025-07-21 | 13F | Ameritas Advisory Services, LLC | 633 | 54 | ||||||
| 2025-08-13 | 13F | Mount Yale Investment Advisors, LLC | 772 | 66 | ||||||
| 2025-08-01 | 13F | Bessemer Group Inc | 2.098 | 0,00 | 0 | |||||
| 2025-08-06 | 13F | Richard Bernstein Advisors LLC | 1.349.163 | 10,87 | 116.152 | 4,66 | ||||
| 2025-08-12 | 13F | Jpmorgan Chase & Co | 526.157 | -0,68 | 45.297 | -6,24 | ||||
| 2025-07-23 | 13F | Valmark Advisers, Inc. | 0 | -100,00 | 0 | |||||
| 2025-08-12 | 13F | Eldridge Investment Advisors, Inc. | 0 | -100,00 | 0 | |||||
| 2025-08-13 | 13F | Scotia Capital Inc. | 19.966 | -19,43 | 1.719 | -23,95 | ||||
| 2025-07-16 | 13F | PFS Partners, LLC | 19 | 0,00 | 2 | 0,00 | ||||
| 2025-07-17 | 13F | Sound Income Strategies, LLC | 208 | 0,00 | 18 | -5,56 | ||||
| 2025-07-17 | 13F | Barry Investment Advisors, LLC | 4.768 | -1,55 | 411 | -7,03 | ||||
| 2025-08-15 | 13F | Kestra Advisory Services, LLC | 2.918 | 2,06 | 251 | -3,46 | ||||
| 2025-08-05 | 13F | Plante Moran Financial Advisors, LLC | 5 | 0 | ||||||
| 2025-05-13 | 13F | Quadrature Capital Ltd | 0 | -100,00 | 0 | -100,00 | ||||
| 2025-07-17 | 13F | Keystone Global Partners, LLC | 2 | 0 | ||||||
| 2025-07-25 | 13F | Hazlett, Burt & Watson, Inc. | 3.329 | 0,00 | 0 | |||||
| 2025-08-08 | 13F | SBI Securities Co., Ltd. | 2.896 | 10,37 | 249 | 4,18 | ||||
| 2025-08-13 | 13F | Lido Advisors, LLC | 2.616 | -3,08 | 225 | -8,54 | ||||
| 2025-05-15 | 13F | Citadel Advisors Llc | Put | 0 | -100,00 | 0 | -100,00 | |||
| 2025-07-18 | 13F | Truist Financial Corp | 24.623 | 95,90 | 2.120 | 84,90 | ||||
| 2025-08-12 | 13F | Country Trust Bank | 350 | 0,00 | 30 | -3,23 | ||||
| 2025-07-25 | 13F | Courage Miller Partners, LLC | 2.510 | 0,00 | 216 | -5,26 | ||||
| 2025-08-11 | 13F | Western Wealth Management, LLC | 2.952 | -3,81 | 254 | -8,96 | ||||
| 2025-07-28 | 13F | Morris Financial Concepts, Inc. | 25 | 0,00 | 2 | 0,00 | ||||
| 2025-07-30 | 13F | Strategic Blueprint, LLC | 3.752 | 0,32 | 323 | -5,57 | ||||
| 2025-04-01 | 13F | Massmutual Trust Co Fsb/adv | 0 | -100,00 | 0 | |||||
| 2025-08-13 | 13F | ASB Consultores, LLC | 2.627 | 226 | ||||||
| 2025-07-18 | 13F | Centricity Wealth Management, LLC | 200 | 0,00 | 17 | -5,56 | ||||
| 2025-08-08 | 13F | Capital Investment Advisory Services, LLC | 104 | 0,00 | 9 | -11,11 | ||||
| 2025-07-23 | 13F | Slow Capital, Inc. | 7.909 | -41,61 | 681 | -44,94 | ||||
| 2025-08-14 | 13F | Vista Capital Partners, Inc. | 0 | -100,00 | 0 | |||||
| 2025-08-12 | 13F | TCTC Holdings, LLC | 567 | 0,00 | 49 | -5,88 | ||||
| 2025-08-12 | 13F | Manchester Capital Management LLC | 2.000 | 0,00 | 172 | -5,49 | ||||
| 2025-08-14 | 13F | Susquehanna International Group, Llp | Call | 5.700 | 491 | |||||
| 2025-08-12 | 13F | Mmbg Investment Advisors Co. | 3.900 | 0,00 | 336 | -5,63 | ||||
| 2025-08-14 | 13F | Susquehanna International Group, Llp | 13.817 | -12,51 | 1.190 | -17,43 | ||||
| 2025-08-12 | 13F | Investor's Fiduciary Advisor Network, LLC | 4.924 | -0,63 | 0 | |||||
| 2025-08-14 | 13F | East Coast Asset Management, LLC. | 4.471 | 0,00 | 385 | -5,65 | ||||
| 2025-08-05 | 13F | Harel Insurance Investments & Financial Services Ltd. | 1.667 | 0,00 | 0 | |||||
| 2025-07-16 | 13F/A | CX Institutional | 5.318 | 1.436,99 | 0 | |||||
| 2025-07-29 | 13F | Angeles Wealth Management, Llc | 48 | 4 | ||||||
| 2025-08-18 | 13F | Geneos Wealth Management Inc. | 150 | 42,86 | 13 | 33,33 | ||||
| 2025-07-14 | 13F | Pacifica Partners Inc. | 250 | 0,00 | 21 | -4,55 | ||||
| 2025-05-15 | 13F | Marshall Wace, Llp | 0 | -100,00 | 0 | |||||
| 2025-08-13 | 13F | Jones Financial Companies Lllp | 10.744 | 23,34 | 920 | 16,33 | ||||
| 2025-07-08 | 13F | Ehrlich Financial Group | 6.162 | 17,24 | 530 | 10,65 | ||||
| 2025-08-11 | 13F | Bradley Foster & Sargent Inc/ct | 3.272 | 0,00 | 282 | -5,70 | ||||
| 2025-07-22 | 13F | Wealthcare Advisory Partners LLC | 2.865 | -25,68 | 247 | -29,91 | ||||
| 2025-07-22 | 13F | Sava Infond d.o.o. | 9.260 | 8,94 | 797 | 2,84 | ||||
| 2025-08-14 | 13F | Murphy & Mullick Capital Management Corp | 23 | 0,00 | 2 | -50,00 | ||||
| 2025-08-11 | 13F | Hopwood Financial Services, Inc. | 130 | 0,00 | 11 | 0,00 | ||||
| 2025-08-13 | 13F | Hsbc Holdings Plc | 3.316 | 285 | ||||||
| 2025-08-04 | 13F | Assetmark, Inc | 0 | -100,00 | 0 | |||||
| 2025-08-04 | 13F | Spire Wealth Management | 17.271 | -2,63 | 1.487 | -8,10 | ||||
| 2025-08-01 | 13F | Banco Santander, S.A. | 66.248 | 0,42 | 5.703 | -5,20 | ||||
| 2025-08-05 | 13F | Bank of New York Mellon Corp | 14.020 | 11,92 | 1.207 | 5,69 | ||||
| 2025-07-30 | 13F | Pacific Sun Financial Corp | 0 | -100,00 | 0 | |||||
| 2025-08-08 | 13F | Gts Securities Llc | 5.246 | -58,84 | 452 | -61,19 | ||||
| 2025-04-22 | 13F | Synergy Financial Management, LLC | 0 | -100,00 | 0 | |||||
| 2025-08-12 | 13F | Steward Partners Investment Advisory, Llc | 5.655 | 5,25 | 487 | -0,82 | ||||
| 2025-08-07 | 13F | Parkside Financial Bank & Trust | 570 | 49 | ||||||
| 2025-08-06 | 13F | Atlantic Union Bankshares Corp | 450 | 39 | ||||||
| 2025-08-18 | 13F/A | National Bank Of Canada /fi/ | 12.568 | -3,68 | 1.081 | -9,08 | ||||
| 2025-08-08 | 13F | Capital Investment Counsel, Inc | 433 | 0,00 | 37 | -5,13 | ||||
| 2025-08-11 | 13F | TD Waterhouse Canada Inc. | 6.583 | -7,24 | 573 | -9,92 | ||||
| 2025-08-05 | 13F | Transatlantique Private Wealth Llc | 31.055 | 6,81 | 2.674 | 0,83 | ||||
| 2025-08-14 | 13F | CIBC World Markets Inc. | 16.516 | 6,59 | 1.422 | 0,57 | ||||
| 2025-05-15 | 13F | Edmond De Rothschild Holding S.a. | 0 | -100,00 | 0 | |||||
| 2025-08-01 | 13F | SYM FINANCIAL Corp | 247 | 0,00 | 21 | -4,55 | ||||
| 2025-07-18 | 13F | Pure Financial Advisors, Inc. | 6.805 | -2,77 | 586 | -8,31 | ||||
| 2025-07-02 | 13F | Marotta Asset Management | 20.771 | -10,92 | 1.788 | -21,85 | ||||
| 2025-07-29 | 13F | Mattson Financial Services, LLC | 0 | -100,00 | 0 | |||||
| 2025-07-14 | 13F | Armstrong Advisory Group, Inc | 30 | 0,00 | 3 | 0,00 | ||||
| 2025-08-11 | 13F | Private Advisor Group, LLC | 15.629 | 91,98 | 1.345 | 81,27 | ||||
| 2025-08-15 | 13F | Morgan Stanley | 523.580 | 6,66 | 45.075 | 0,68 | ||||
| 2025-05-16 | 13F | Arete Wealth Advisors, LLC | 0 | -100,00 | 0 | |||||
| 2025-07-15 | 13F | Fifth Third Bancorp | 1.685 | -2,32 | 145 | -7,64 | ||||
| 2025-08-14 | 13F | LM Advisors LLC | 3.748 | 0,00 | 0 | |||||
| 2025-07-17 | 13F | Youngs Advisory Group, Inc. | 2.885 | -20,19 | 249 | -24,55 | ||||
| 2025-08-19 | 13F | National Asset Management, Inc. | 8.411 | -8,15 | 724 | -8,01 | ||||
| 2025-08-18 | 13F | Front Row Advisors LLC | 2.049 | -10,48 | 176 | -15,38 | ||||
| 2025-08-07 | 13F | Clarity Wealth Advisors, LLC | 36.711 | -5,65 | 3.160 | -10,94 | ||||
| 2025-08-12 | 13F | BlackRock, Inc. | 14.053.063 | -1,25 | 1.209.828 | -6,78 | ||||
| 2025-08-14 | 13F | Glen Eagle Advisors, LLC | 3.362 | 0,00 | 289 | -5,56 | ||||
| 2025-08-07 | 13F | Montag A & Associates Inc | 89 | 0,00 | 8 | -12,50 | ||||
| 2025-04-28 | 13F | Strategic Financial Concepts, LLC | 0 | -100,00 | 0 | -100,00 | ||||
| 2025-08-05 | 13F | Simplex Trading, Llc | 0 | -100,00 | 0 | |||||
| 2025-08-13 | 13F | Cresset Asset Management, LLC | 16.703 | -26,81 | 1.438 | -30,95 | ||||
| 2025-08-01 | 13F | Transcend Wealth Collective, Llc | 0 | -100,00 | 0 | |||||
| 2025-08-14 | 13F | Hrt Financial Lp | 9.720 | 1 | ||||||
| 2025-08-14 | 13F | UBS Group AG | 275.151 | -9,65 | 23.688 | -14,71 | ||||
| 2025-07-30 | 13F | Whittier Trust Co Of Nevada Inc | 251 | 0,00 | 22 | -4,55 | ||||
| 2025-08-14 | 13F | CoreCap Advisors, LLC | 105 | -63,92 | 9 | -65,38 | ||||
| 2025-07-11 | 13F | Grove Bank & Trust | 212 | 0,00 | 18 | -5,26 | ||||
| 2025-08-14 | 13F | LaSalle St. Investment Advisors, LLC | 0 | -100,00 | 0 | |||||
| 2025-07-30 | 13F | Phoenix Holdings Ltd. | 1.199.299 | -0,01 | 103.248 | -5,61 | ||||
| 2025-07-09 | 13F | Breakwater Investment Management | 1.948 | 0,00 | 168 | -5,65 | ||||
| 2025-08-08 | 13F | Sittner & Nelson, Llc | 690 | 0,00 | 59 | -4,84 | ||||
| 2025-08-12 | 13F | Coldstream Capital Management Inc | 0 | -100,00 | 0 | |||||
| 2025-07-15 | 13F | Patriot Investment Management Inc. | 5.108 | -0,55 | 440 | -6,20 | ||||
| 2025-07-17 | 13F | Vermillion Wealth Management, Inc. | 348 | 0,00 | 30 | -6,45 | ||||
| 2025-08-12 | 13F | Nemes Rush Group LLC | 0 | -100,00 | 0 | |||||
| 2025-08-14 | 13F | Citadel Advisors Llc | 43.250 | 3.723 | ||||||
| 2025-07-14 | 13F | Farmers & Merchants Investments Inc | 66 | 0,00 | 6 | -16,67 | ||||
| 2025-07-30 | 13F | D.a. Davidson & Co. | 12.722 | -1,66 | 1.095 | -7,12 | ||||
| 2025-08-14 | 13F | FIL Ltd | 47.123 | 0,14 | 4.057 | -5,48 | ||||
| 2025-07-24 | 13F | Leo Wealth, LLC | 140.172 | 52,40 | 12.079 | 43,99 | ||||
| 2025-07-22 | 13F | Miracle Mile Advisors, LLC | 2.609 | 225 | ||||||
| 2025-08-01 | 13F | Purkiss Capital Advisors LLC | 5.995 | 13,26 | 516 | 7,05 | ||||
| 2025-07-31 | 13F | Cambridge Investment Research Advisors, Inc. | 21.154 | 23,53 | 2 | 0,00 | ||||
| 2025-08-11 | 13F | Brown Brothers Harriman & Co | 8 | -99,33 | 1 | -100,00 | ||||
| 2025-08-06 | 13F | Stonebridge Financial Planning Group, LLC | 6.085 | -3,18 | 524 | -8,73 | ||||
| 2025-08-11 | 13F | Anfield Capital Management, LLC | 120 | 0,00 | 10 | 0,00 | ||||
| 2025-08-15 | 13F | Tower Research Capital LLC (TRC) | 1 | 0 | ||||||
| 2025-08-06 | 13F | Kcm Investment Advisors Llc | 4.629 | 399 | ||||||
| 2025-07-16 | 13F | New Insight Wealth Advisors | 3.484 | -52,13 | 300 | -54,90 | ||||
| 2025-08-05 | 13F | Mathes Company, Inc. | 2.750 | 0,00 | 0 | |||||
| 2025-08-13 | 13F | Royal Fund Management, LLC | 0 | -100,00 | 0 | |||||
| 2025-07-30 | 13F | Brookstone Capital Management | 0 | -100,00 | 0 | |||||
| 2025-08-13 | 13F | Crescent Grove Advisors, LLC | 15.940 | 0,00 | 1.372 | -5,57 | ||||
| 2025-08-19 | 13F | Newbridge Financial Services Group, Inc. | 15.553 | -18,97 | 1.339 | -23,54 | ||||
| 2025-07-30 | 13F | LGT Financial Advisors LLC | 80 | 7 | ||||||
| 2025-08-14 | 13F | Sunbelt Securities, Inc. | 5 | 0,00 | 0 | |||||
| 2025-07-30 | 13F | Avidian Wealth Solutions, LLC | 10.064 | 0,64 | 866 | -4,94 | ||||
| 2025-08-08 | 13F | Financial Gravity Companies, Inc. | 230 | -28,12 | 20 | -29,63 | ||||
| 2025-04-21 | 13F | Ayalon Holdings Ltd. | 0 | -100,00 | 0 | |||||
| 2025-08-13 | 13F | Green Harvest Asset Management LLC | 87.573 | -14,52 | 7.539 | -19,30 | ||||
| 2025-08-14 | 13F | Jane Street Group, Llc | 43.132 | -56,92 | 3.713 | -59,33 | ||||
| 2025-08-14 | 13F | Qube Research & Technologies Ltd | 11.121 | 957 | ||||||
| 2025-08-12 | 13F | Global Retirement Partners, LLC | 2.822 | -48,04 | 243 | -48,07 | ||||
| 2025-07-22 | 13F | DAVENPORT & Co LLC | 5.580 | 0,00 | 480 | -5,51 | ||||
| 2025-07-29 | 13F | Chevy Chase Trust Holdings, Inc. | 3.200 | 0,00 | 275 | -5,50 | ||||
| 2025-08-14 | 13F/A | Rockefeller Capital Management L.P. | 13.361 | 8,05 | 1.150 | 2,04 | ||||
| 2025-08-14 | 13F | GWM Advisors LLC | 6.104 | 140,88 | 525 | 127,27 | ||||
| 2025-08-06 | 13F | AE Wealth Management LLC | 7.331 | 7,24 | 631 | 1,28 |