Grundlæggende statistik
| Institutionelle ejere | 162 total, 162 long only, 0 short only, 0 long/short - change of 0,62% MRQ |
| Gennemsnitlig porteføljeallokering | 0.1564 % - change of 0,86% MRQ |
| Institutionelle aktier (lange) | 5.677.646 (ex 13D/G) - change of 0,19MM shares 3,43% MRQ |
| Institutionel værdi (lang) | $ 570.884 USD ($1000) |
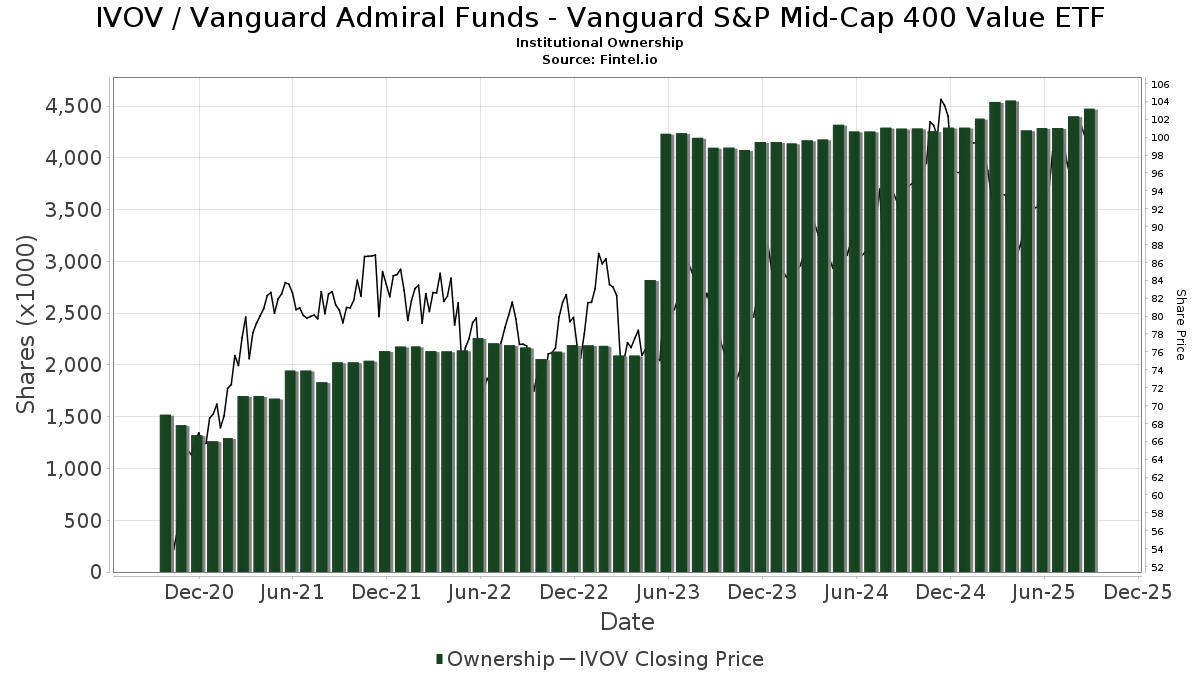
Institutionelt ejerskab og aktionærer
Vanguard Admiral Funds - Vanguard S&P Mid-Cap 400 Value ETF (US:IVOV) har 162 institutionelle ejere og aktionærer, der har indsendt 13D/G- eller 13F-formularer til Securities Exchange Commission (SEC). Disse institutioner har i alt 5,677,646 aktier. Største aktionærer omfatter Vantagepoint Investment Advisers Llc, Mariner, LLC, Rockland Trust Co, Morgan Stanley, Bank Of America Corp /de/, Raymond James Financial Inc, Stordahl Capital Management, Inc., Octavia Wealth Advisors, LLC, Nelson, Van Denburg & Campbell Wealth Management Group, LLC, and Aberdeen Wealth Management LLC .
Vanguard Admiral Funds - Vanguard S&P Mid-Cap 400 Value ETF (ARCA:IVOV) institutionel ejerskabsstruktur viser aktuelle positioner i virksomheden efter institutioner og fonde, samt seneste ændringer i positionsstørrelse. Større aktionærer kan omfatte individuelle investorer, investeringsforeninger, hedgefonde eller institutioner. Skema 13D angiver, at investoren besidder (eller besidder) mere end 5 % af virksomheden og har til hensigt (eller har til hensigt at) aktivt at forfølge en ændring i forretningsstrategi. Skema 13G indikerer en passiv investering på over 5%.
The share price as of April 1, 2026 is 102,52 / share. Previously, on April 2, 2025, the share price was 93,54 / share. This represents an increase of 9,60% over that period.
Fondens stemningsscore
Fund Sentiment Score (fka Ownership Accumulation Score) finder de aktier, der bliver mest købt af fonde. Det er resultatet af en sofistikeret, multi-faktor kvantitativ model, der identificerer virksomheder med de højeste niveauer af institutionel akkumulering. Scoringsmodellen bruger en kombination af den samlede stigning i oplyste ejere, ændringerne i porteføljeallokeringer i disse ejere og andre målinger. Tallet går fra 0 til 100, hvor højere tal indikerer et højere niveau af akkumulering for sine jævnaldrende, og 50 er gennemsnittet.
Opdateringsfrekvens: Dagligt
Se Ownership Explorer, som giver en liste over højest rangerende virksomheder.
AI+ Ask Fintel’s AI assistant about Vanguard Admiral Funds - Vanguard S&P Mid-Cap 400 Value ETF.
Select a question to share a public post with an AI-crafted answer.
Thinking of good questions…
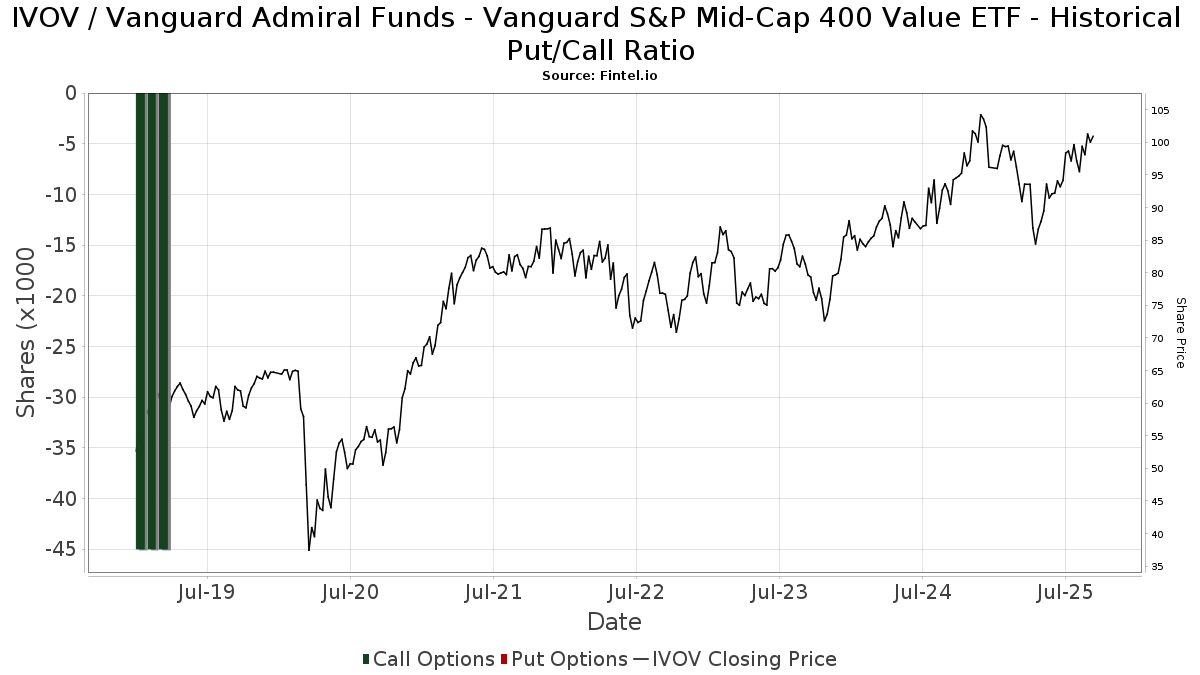
Institutionel Put/Call-forhold
Ud over at indberette standardaktie- og gældsudstedelser skal institutter med mere end 100 mill. aktiver under forvaltning også oplyse deres put- og call-optionsbeholdninger. Da salgsoptioner generelt indikerer negativ stemning, og købsoptioner indikerer positiv stemning, kan vi få en fornemmelse af den overordnede institutionelle stemning ved at plotte forholdet mellem put og kald. Diagrammet til højre viser det historiske put/call-forhold for dette instrument.
Brug af Put/Call Ratio som en indikator for investorernes stemning overvinder en af de vigtigste mangler ved at bruge totalt institutionelt ejerskab, som er, at en betydelig mængde af aktiver under forvaltning investeres passivt for at spore indekser. Passivt forvaltede fonde køber typisk ikke optioner, så indikatoren for put/call-forholdet følger mere nøje følelsen af aktivt forvaltede fonde.
13D/G-arkivering
Vi præsenterer 13D/G ansøgninger separat fra 13F ansøgninger på grund af den forskellige behandling af SEC. 13D/G-ansøgninger kan indgives af grupper af investorer (med én ledende), hvorimod 13F-ansøgninger ikke kan. Dette resulterer i situationer, hvor en investor kan indsende en 13D/G, der rapporterer én værdi for de samlede aktier (der repræsenterer alle de aktier, der ejes af investorgruppen), men derefter indsender en 13F, der rapporterer en anden værdi for de samlede aktier (der udelukkende repræsenterer deres egne) ejendomsret). Det betyder, at aktieejerskab af 13D/G-arkiver og 13F-arkiveringer ofte ikke er direkte sammenlignelige, så vi præsenterer dem separat.
Bemærk: Fra den 16. maj 2021 viser vi ikke længere ejere, der ikke har indsendt en 13D/G inden for det seneste år. Tidligere viste vi den fulde historie af 13D/G-arkiver. Generelt skal enheder, der er forpligtet til at indgive 13D/G-ansøgninger, indgive mindst årligt, før de indsender en afsluttende ansøgning. Dog forlader fonde nogle gange positioner uden at indsende en afsluttende ansøgning (dvs. de afvikler), så visning af den fulde historie resulterede nogle gange i forvirring om det nuværende ejerskab. For at undgå forvirring viser vi nu kun 'aktuelle' ejere - det vil sige - ejere, der har anmeldt inden for det seneste år.
Upgrade to unlock premium data.
| Fil dato | Form | Investor | Forrige Aktier |
Seneste Aktier |
Δ Aktier (Procent) |
Ejendomsret (Procent) |
Δ Ejerskab (Procent) |
|
|---|---|---|---|---|---|---|---|---|
| 2025-09-08 | International City Management Association Retirement Corp | 968,013 | 10.00 |
13F og NPORT arkivering
Detaljer om 13F-arkivering er gratis. Detaljer om NP-ansøgninger kræver et premium-medlemskab. Grønne rækker angiver nye positioner. Røde rækker angiver lukkede positioner. Klik på linket ikon for at se den fulde transaktionshistorik.
Opgrader
for at låse premium-data op og eksportere til Excel ![]() .
.
| Fil dato | Kilde | Investor | Type | Gennemsnitlig pris (Øst) |
Aktier | Δ Aktier (%) |
Rapporteret Værdi ($1000) |
Δ Værdi (%) |
Port Alloc (%) |
|
|---|---|---|---|---|---|---|---|---|---|---|
| 2026-02-11 | 13F | Rise Advisors, LLC | 3.042 | 307 | ||||||
| 2026-02-04 | 13F | Ofc Financial Planning, Llc | 6.310 | 5,94 | 637 | 6,17 | ||||
| 2026-02-12 | 13F | Federation des caisses Desjardins du Quebec | 328 | 0,00 | 33 | 0,00 | ||||
| 2026-01-09 | 13F | Cambridge Financial Group, LLC | 4.013 | 53,34 | 392 | 49,05 | ||||
| 2026-01-26 | 13F | Private Trust Co Na | 450 | 0,00 | 45 | 0,00 | ||||
| 2026-02-17 | 13F | Captrust Financial Advisors | 6.584 | -2,10 | 665 | -1,77 | ||||
| 2026-02-13 | 13F | MAI Capital Management | 1.201 | 0,00 | 121 | 0,00 | ||||
| 2026-02-17 | 13F | Susquehanna International Group, Llp | 0 | -100,00 | 0 | |||||
| 2026-02-18 | 13F | Veratis Advisors, Inc. | 2.561 | 279 | ||||||
| 2026-01-30 | 13F | Keybank National Association/oh | 9.947 | 0,00 | 1.005 | 0,20 | ||||
| 2026-02-18 | 13F | EP Wealth Advisors, Inc. | 29.725 | 0,42 | 3.002 | 6,27 | ||||
| 2026-02-13 | 13F | SYM FINANCIAL Corp | 178 | 0,00 | 18 | 0,00 | ||||
| 2026-01-15 | 13F | Founders Capital Management | 770 | 0,00 | 78 | 0,00 | ||||
| 2026-02-11 | 13F | LPL Financial LLC | 116.347 | -1,62 | 11.752 | -1,38 | ||||
| 2026-02-13 | 13F | Heritage Wealth Advisors | 198 | 0,00 | 20 | 5,26 | ||||
| 2026-02-09 | 13F | Shufro Rose & Co Llc | 10.985 | 19,27 | 1.110 | 30,93 | ||||
| 2026-02-10 | 13F | Texas Yale Capital Corp. | 2.200 | 0,00 | 222 | 0,45 | ||||
| 2026-01-22 | 13F | Pinnacle Bancorp, Inc. | 578 | 0,00 | 58 | 0,00 | ||||
| 2026-01-22 | 13F | Ifrah Financial Services, Inc. | 4.204 | -1,94 | 425 | -1,85 | ||||
| 2026-01-29 | 13F | Comerica Bank | 18.352 | 20,07 | 1.854 | 20,32 | ||||
| 2026-02-24 | 13F | MidFirst Bank | 70.333 | 7.104 | ||||||
| 2026-01-13 | 13F | Mather Group, Llc. | 0 | -100,00 | 0 | |||||
| 2026-02-19 | 13F | CI Private Wealth, LLC | 5.855 | -41,00 | 591 | -40,84 | ||||
| 2026-01-06 | 13F | Nelson, Van Denburg & Campbell Wealth Management Group, LLC | 150.771 | 8,21 | 15.229 | 8,47 | ||||
| 2026-01-14 | 13F | Spire Wealth Management | 3.118 | 0,00 | 315 | 0,00 | ||||
| 2026-01-15 | 13F | Fortitude Family Office, LLC | 13.160 | 0,00 | 1.329 | 0,23 | ||||
| 2026-01-23 | 13F | Fifth Third Securities, Inc. | 2.356 | -8,82 | 238 | -8,85 | ||||
| 2026-01-27 | 13F | Godsey & Gibb Associates | 1 | 0 | ||||||
| 2026-01-29 | 13F | UBS Group AG | 102.864 | 0,03 | 10.390 | 0,27 | ||||
| 2026-02-09 | 13F | Hantz Financial Services, Inc. | 23 | 0 | ||||||
| 2026-02-12 | 13F | Wealthspire Advisors, LLC | 0 | -100,00 | 0 | |||||
| 2026-02-13 | 13F | Horizon Investment Services, LLC | 11.641 | 1,09 | 1.176 | 1,29 | ||||
| 2026-02-02 | 13F | Mutual Advisors, LLC | 4.848 | 0,81 | 490 | 0,82 | ||||
| 2026-02-06 | 13F | Larson Financial Group LLC | 663 | -30,65 | 67 | -30,21 | ||||
| 2026-02-17 | 13F | Blair William & Co/il | 2.515 | 10,65 | 254 | 10,92 | ||||
| 2026-02-11 | 13F | Teachers Insurance & Annuity Association Of America | 831 | 5,06 | 84 | 5,06 | ||||
| 2026-02-17 | 13F | Advisor Group Holdings, Inc. | 10.915 | 18,95 | 1.103 | 19,39 | ||||
| 2026-02-17 | 13F | Pinnacle Financial Partners, Inc. | 2.049 | 207 | ||||||
| 2026-01-21 | 13F | Sound Income Strategies, LLC | 345 | 37 | ||||||
| 2026-02-13 | 13F | Mariner, LLC | 868.738 | 0,88 | 87.751 | 1,12 | ||||
| 2026-02-17 | 13F | Hanover Advisors Inc | 5.186 | 0,00 | 524 | 0,19 | ||||
| 2026-01-20 | 13F | Signaturefd, Llc | 14 | 0,00 | 1 | 0,00 | ||||
| 2026-02-17 | 13F | Fmr Llc | 2.522 | 18,24 | 255 | 18,69 | ||||
| 2026-01-20 | 13F | Tritonpoint Wealth, Llc | 2.592 | 0,00 | 262 | 0,00 | ||||
| 2026-01-28 | 13F | Trail Ridge Investment Advisors, LLC | 4.588 | -0,54 | 463 | -0,22 | ||||
| 2026-02-04 | 13F | Ameritas Advisory Services, LLC | 0 | -100,00 | 0 | |||||
| 2026-01-29 | 13F | Silver Oak Wealth Advisors Services, Llc | 2.255 | 0,00 | 228 | 0,00 | ||||
| 2026-02-05 | 13F | Thrivent Financial For Lutherans | 19.467 | 2 | ||||||
| 2026-02-18 | 13F | GWM Advisors LLC | 2.533 | 0,00 | 256 | 0,00 | ||||
| 2026-01-27 | 13F | Hobart Private Capital, LLC | 3.756 | -0,69 | 379 | -0,52 | ||||
| 2026-02-05 | 13F | Cambridge Investment Research Advisors, Inc. | 4.019 | 4,61 | 0 | |||||
| 2026-02-17 | 13F | Ameriflex Group, Inc. | 789 | -45,74 | 80 | -45,89 | ||||
| 2026-01-29 | 13F | D.a. Davidson & Co. | 7.649 | -0,14 | 773 | 0,13 | ||||
| 2026-02-11 | 13F | Cerity Partners LLC | 2.375 | 1,58 | 240 | 1,70 | ||||
| 2026-02-17 | 13F | Ameriprise Financial Inc | 13.661 | 21,77 | 1.380 | 20,86 | ||||
| 2026-02-03 | 13F | Bokf, Na | 213 | 22 | ||||||
| 2026-02-17 | 13F | Trustmark National Bank Trust Department | 2.000 | -2,91 | 202 | -2,42 | ||||
| 2026-01-22 | 13F | Bartlett & Co. Wealth Management Llc | 168 | 0,00 | 17 | 0,00 | ||||
| 2026-02-17 | 13F | Jones Financial Companies Lllp | 9.462 | 86,66 | 956 | 87,25 | ||||
| 2026-01-28 | 13F | Salomon & Ludwin, LLC | 1.150 | 0,00 | 119 | 1,71 | ||||
| 2025-11-14 | 13F/A | NorthRock Partners, LLC | 0 | -100,00 | 0 | |||||
| 2026-02-13 | 13F | Stifel Financial Corp | 9.210 | 34,45 | 930 | 34,78 | ||||
| 2026-02-12 | 13F | StoneX Group Inc. | 2.718 | -17,59 | 275 | -17,47 | ||||
| 2026-01-30 | 13F | Heritage Investment Group, Inc. | 9.572 | 0,00 | 967 | 0,21 | ||||
| 2026-02-12 | 13F | TopTier Wealth Management, LLC | 4.511 | 456 | ||||||
| 2026-01-20 | 13F | Sovran Advisors, LLC | 5.030 | -10,11 | 538 | -2,89 | ||||
| 2026-02-11 | 13F | Jpmorgan Chase & Co | 27.517 | 12,25 | 2.780 | 12,51 | ||||
| 2026-01-14 | 13F | Eastern Bank | 756 | 0,00 | 76 | 0,00 | ||||
| 2026-02-05 | 13F | Western Wealth Management, LLC | 2.437 | 0,00 | 246 | 0,41 | ||||
| 2025-11-12 | 13F | Accredited Wealth Management, LLC | 1.735 | 17.250,00 | 1 | |||||
| 2026-02-13 | 13F | Level Four Advisory Services, Llc | 4.667 | 0,91 | 471 | 1,07 | ||||
| 2026-01-30 | 13F | AMG National Trust Bank | 3.480 | 0,00 | 352 | 0,29 | ||||
| 2025-11-13 | 13F | Evensky & Katz LLC | 0 | -100,00 | 0 | |||||
| 2026-01-27 | 13F | PFG Advisors | 10.598 | 2,82 | 1.071 | 3,08 | ||||
| 2026-02-02 | 13F | Miracle Mile Advisors, LLC | 25.009 | 16,52 | 2.526 | 16,84 | ||||
| 2026-01-26 | 13F | Valmark Advisers, Inc. | 3.725 | -5,17 | 376 | -4,81 | ||||
| 2026-02-13 | 13F | Smartleaf Asset Management LLC | 335 | 34 | ||||||
| 2026-02-09 | 13F | Huntington National Bank | 1.014 | 0,20 | ||||||
| 2026-01-12 | 13F | Rialto Wealth Management, LLC | 1.060 | 0,00 | 107 | 0,94 | ||||
| 2026-02-12 | 13F | Commonwealth Equity Services, Llc | 50.342 | -4,23 | 5.085 | 101.600,00 | ||||
| 2026-01-26 | 13F | Cwm, Llc | 200 | 0,00 | 0 | |||||
| 2026-02-03 | 13F | Insight 2811, Inc. | 2.953 | 1,90 | 298 | 2,05 | ||||
| 2026-02-06 | 13F | Pnc Financial Services Group, Inc. | 2.136 | 0,00 | 216 | 0,00 | ||||
| 2026-02-06 | 13F | Lutz Financial Services LLC | 116.480 | -1,07 | 11.766 | -0,83 | ||||
| 2026-01-14 | 13F | Wealthcare Advisory Partners LLC | 3.148 | 22,78 | 318 | 22,87 | ||||
| 2026-01-30 | 13F | American Financial & Tax Strategies Inc | 9.419 | -27,82 | 951 | -27,68 | ||||
| 2026-02-10 | 13F | Bnp Paribas Arbitrage, Sa | 0 | -100,00 | 0 | |||||
| 2026-02-13 | 13F | Kestra Advisory Services, LLC | 0 | -100,00 | 0 | |||||
| 2026-02-10 | 13F | CIBC World Markets Inc. | 5.594 | 0,00 | 565 | 0,36 | ||||
| 2026-02-19 | 13F | Atomi Financial Group, Inc. | 2.229 | 0,04 | 225 | 0,45 | ||||
| 2026-02-09 | 13F | Kingsview Wealth Management, LLC | 1.984 | 200 | ||||||
| 2026-02-12 | 13F | Aberdeen Wealth Management LLC | 118.603 | 0,09 | 11.980 | 0,34 | ||||
| 2026-02-17 | 13F | Raymond James Financial Inc | 218.683 | 12,35 | 22.089 | 12,62 | ||||
| 2026-02-06 | 13F | Creative Financial Designs Inc /adv | 208 | 0,00 | 21 | 5,00 | ||||
| 2026-02-13 | 13F | Aptus Capital Advisors, LLC | 593 | 0,00 | 60 | 0,00 | ||||
| 2026-01-27 | 13F | Stordahl Capital Management, Inc. | 172.306 | 0,27 | 17.405 | 0,50 | ||||
| 2026-02-17 | 13F | Creative Planning | 12.474 | -5,37 | 1.260 | -5,12 | ||||
| 2026-01-08 | 13F | Goodman Financial Corp | 5.725 | -0,21 | 578 | 0,00 | ||||
| 2026-02-17 | 13F | Wiley Bros.-aintree Capital, Llc | 35.296 | -1,05 | 3.564 | -0,83 | ||||
| 2026-02-17 | 13F | Royal Bank Of Canada | 6.256 | 6,90 | 632 | 7,12 | ||||
| 2026-01-15 | 13F | Rockland Trust Co | 811.105 | 0,71 | 81.930 | 0,95 | ||||
| 2026-02-13 | 13F | Mosaic Family Wealth Partners, Llc | 0 | -100,00 | 0 | |||||
| 2026-02-12 | 13F | BRYN MAWR TRUST Co | 0 | -100,00 | 0 | -100,00 | ||||
| 2026-01-28 | 13F | WPG Advisers, LLC | 325 | 0,00 | 33 | 0,00 | ||||
| 2026-01-23 | 13F | Summit Financial Consulting LLC | 0 | -100,00 | 0 | |||||
| 2026-02-05 | 13F | Allworth Financial LP | 34.575 | -5,92 | 3.492 | -5,70 | ||||
| 2025-11-07 | 13F | Synovus Financial Corp | 2.047 | 206 | ||||||
| 2026-01-21 | 13F | Naviter Wealth, LLC | 6.851 | 0,00 | 692 | 0,29 | ||||
| 2026-02-13 | 13F | Mml Investors Services, Llc | 7.403 | 9,63 | 748 | 9,85 | ||||
| 2026-02-06 | 13F | Global Retirement Partners, LLC | 899 | 1,24 | 91 | 1,12 | ||||
| 2026-01-16 | 13F | Crowley Wealth Management, Inc. | 0 | -100,00 | 0 | |||||
| 2026-02-11 | 13F | O'shaughnessy Asset Management, Llc | 435 | 0,00 | 44 | 0,00 | ||||
| 2025-11-14 | 13F | Virtu Financial LLC | 0 | -100,00 | 0 | |||||
| 2026-02-11 | 13F | Franklin Resources Inc | 28.700 | 0,00 | 2.899 | 0,21 | ||||
| 2026-02-11 | 13F | J.w. Cole Advisors, Inc. | 0 | -100,00 | 0 | |||||
| 2025-12-29 | 13F | Cape Investment Advisory, Inc. | 0 | -100,00 | 0 | -100,00 | ||||
| 2026-02-17 | 13F | Russell Investments Group, Ltd. | 100 | 0,00 | 10 | 0,00 | ||||
| 2026-02-14 | 13F | Rockefeller Capital Management L.P. | 936 | -17,09 | 95 | -16,81 | ||||
| 2025-11-14 | 13F | Flow Traders U.s. Llc | 0 | -100,00 | 0 | |||||
| 2026-02-17 | 13F | Aqr Capital Management Llc | 9.983 | -8,90 | 1.008 | -8,70 | ||||
| 2026-01-23 | 13F | U.S. Capital Wealth Advisors, LLC | 2.980 | 0,00 | 301 | 0,33 | ||||
| 2026-02-10 | 13F | Factorial Partners, Llc | 5.200 | 0,00 | 525 | 0,19 | ||||
| 2026-01-30 | 13F | Archer Investment Corp | 722 | 0,00 | 73 | 0,00 | ||||
| 2026-02-03 | 13F | Legacy Wealth Managment, LLC/ID | 19 | 2 | ||||||
| 2026-02-10 | 13F/A | Northwestern Mutual Wealth Management Co | 79.893 | 0,43 | 8.070 | 0,66 | ||||
| 2026-02-17 | 13F | Tower Research Capital LLC (TRC) | 0 | -100,00 | 0 | |||||
| 2026-01-13 | 13F | IFG Advisors, LLC | 2.770 | 0,00 | 280 | 0,00 | ||||
| 2026-02-10 | 13F | Savant Capital, LLC | 36.962 | -3,83 | 3.734 | -3,61 | ||||
| 2025-11-14 | 13F | Manchester Capital Management LLC | 1.000 | 0,00 | 101 | 5,26 | ||||
| 2026-01-21 | 13F | Flagship Harbor Advisors, Llc | 1.104 | 112 | ||||||
| 2026-02-10 | 13F | Lido Advisors, LLC | 2.502 | 0,00 | 252 | 0,00 | ||||
| 2026-02-02 | 13F | Fifth Third Bancorp | 1.876 | 67,80 | 189 | 68,75 | ||||
| 2026-02-26 | 13F | Anchor Investment Management, LLC | 138 | 0,00 | 14 | 0,00 | ||||
| 2026-02-12 | 13F | Steward Partners Investment Advisory, Llc | 396 | 0,00 | 40 | 2,56 | ||||
| 2026-01-08 | 13F | Wealth Enhancement Advisory Services, Llc | 38.656 | 14,97 | 4.051 | 19,57 | ||||
| 2026-02-17 | 13F | IHT Wealth Management, LLC | 3.136 | 1,82 | 317 | 1,94 | ||||
| 2026-02-12 | 13F | Moneta Group Investment Advisors Llc | 16.446 | 41,14 | 1.661 | 41,48 | ||||
| 2026-02-17 | 13F | SageView Advisory Group, LLC | 130 | 13 | ||||||
| 2026-01-14 | 13F | Redhawk Wealth Advisors, Inc. | 4.970 | -8,96 | 502 | -8,91 | ||||
| 2026-01-20 | 13F | SOA Wealth Advisors, LLC. | 8 | 0,00 | 1 | |||||
| 2026-01-26 | 13F | Asset Dedication, LLC | 731 | 0,00 | 74 | 0,00 | ||||
| 2026-02-02 | 13F | Truist Financial Corp | 45.932 | 1,19 | 4.640 | 1,42 | ||||
| 2026-01-09 | 13F | Atlas Brown,Inc. | 4.691 | 0,00 | 474 | 0,21 | ||||
| 2026-01-30 | 13F | Citizens Financial Group Inc/ri | 3.076 | 1,79 | 311 | 1,97 | ||||
| 2026-02-13 | 13F | Ubs Asset Management Americas Inc | 1.136 | 115 | ||||||
| 2026-01-20 | 13F | Hanson & Doremus Investment Management | 1.504 | 0,00 | 0 | |||||
| 2026-02-10 | 13F | Bruce G. Allen Investments, LLC | 720 | 1,84 | 73 | 1,41 | ||||
| 2026-02-11 | 13F | Parallel Advisors, LLC | 1.931 | 0,00 | 195 | 0,52 | ||||
| 2026-02-17 | 13F | Argyle Capital Partners, LLC | 2.116 | 3,52 | 214 | 3,90 | ||||
| 2026-01-27 | 13F | Vantagepoint Investment Advisers Llc | 1.089.894 | 4,80 | 110.090 | 5,05 | ||||
| 2026-01-22 | 13F | Glass Jacobson Investment Advisors llc | 394 | 1,81 | 40 | 0,00 | ||||
| 2026-01-27 | 13F | WealthCollab, LLC | 2.808 | 0,00 | 284 | 0,35 | ||||
| 2026-02-12 | 13F | Principal Securities, Inc. | 0 | -100,00 | 0 | |||||
| 2026-02-12 | 13F | BlackRock, Inc. | 878 | 575,38 | 89 | 576,92 | ||||
| 2026-01-26 | 13F | Merit Financial Group, LLC | 5.698 | 0,00 | 576 | 0,17 | ||||
| 2026-01-28 | 13F | Spectrum Investment Advisors, Inc. | 0 | -100,00 | 0 | |||||
| 2026-02-17 | 13F | Bank Of America Corp /de/ | 229.351 | -11,98 | 23.167 | -11,77 | ||||
| 2026-02-05 | 13F | Passive Capital Management, LLC. | 4.026 | 0,00 | 407 | 0,25 | ||||
| 2026-01-21 | 13F | Newbridge Financial Services Group, Inc. | 444 | 0,00 | 45 | 0,00 | ||||
| 2026-02-12 | 13F | Summit Financial, LLC | 5.621 | -0,92 | 568 | -0,70 | ||||
| 2026-02-09 | 13F | Harbour Investments, Inc. | 4.038 | -1,15 | 408 | -0,97 | ||||
| 2026-02-17 | 13F | Cetera Investment Advisers | 15.344 | 1,09 | 1.550 | 1,31 | ||||
| 2026-02-06 | 13F | Keystone Financial Group | 2.498 | 0,32 | 252 | 0,80 | ||||
| 2026-02-13 | 13F | Morgan Stanley | 330.328 | 16,23 | 33.367 | 16,51 | ||||
| 2025-11-14 | 13F | Citadel Advisors Llc | 0 | -100,00 | 0 | |||||
| 2026-02-10 | 13F | JMG Financial Group, Ltd. | 2.086 | 0,00 | 211 | 0,00 | ||||
| 2026-02-04 | 13F | Meridian Wealth Management, LLC | 5.292 | 1,81 | 535 | 2,10 | ||||
| 2026-02-06 | 13F | VSM Wealth Advisory, LLC | 600 | 0,00 | 61 | 0,00 | ||||
| 2026-02-13 | 13F | Cornerstone Financial Management LLC | 14.905 | 1.506 | ||||||
| 2026-01-26 | 13F | Phillips Financial Management, Llc | 2.860 | 0,00 | 289 | 0,00 | ||||
| 2026-01-28 | 13F | Geneos Wealth Management Inc. | 448 | 0,00 | 45 | 0,00 | ||||
| 2026-02-10 | 13F | Envestnet Asset Management Inc | 44.993 | 8,51 | 4.545 | 8,76 | ||||
| 2026-02-17 | 13F | Private Advisor Group, LLC | 13.228 | -11,68 | 1.336 | -11,46 | ||||
| 2025-11-14 | 13F | Jane Street Group, Llc | 0 | -100,00 | 0 | |||||
| 2025-11-05 | 13F | Plante Moran Financial Advisors, LLC | 0 | -100,00 | 0 | |||||
| 2026-03-19 | 13F | Painted Porch Advisors LLC | 0 | -100,00 | 0 | |||||
| 2026-02-03 | 13F | BHK Investment Advisors, LLC | 4.400 | 0,00 | 444 | 0,23 | ||||
| 2026-02-09 | 13F | Wealthquest Corp | 3.530 | 357 | ||||||
| 2026-02-13 | 13F | Wells Fargo & Company/mn | 75.546 | 36,78 | 7.631 | 37,11 | ||||
| 2026-01-22 | 13F | Rodgers & Associates, LTD | 5.933 | -0,08 | 599 | 0,17 | ||||
| 2026-01-23 | 13F | Octavia Wealth Advisors, LLC | 158.928 | -9,50 | 16.053 | -9,28 | ||||
| 2026-01-23 | 13F | Assetmark, Inc | 346 | 65,55 | 35 | 61,90 | ||||
| 2026-02-09 | 13F | Glenview Trust Co | 3.234 | 0,00 | 327 | 0,31 | ||||
| 2026-02-03 | 13F | SBI Securities Co., Ltd. | 16 | 23,08 | 2 | 0,00 | ||||
| 2026-02-06 | 13F | HighTower Advisors, LLC | 55.488 | -0,54 | 5.605 | -0,30 | ||||
| 2026-02-14 | 13F | Howe & Rusling Inc | 0 | -100,00 | 0 |