Grundlæggende statistik
| Institutionelle ejere | 92 total, 89 long only, 0 short only, 3 long/short - change of 2,22% MRQ |
| Gennemsnitlig porteføljeallokering | 0.0414 % - change of -1,10% MRQ |
| Institutionelle aktier (lange) | 1.653.973 (ex 13D/G) - change of -0,04MM shares -2,45% MRQ |
| Institutionel værdi (lang) | $ 106.845 USD ($1000) |
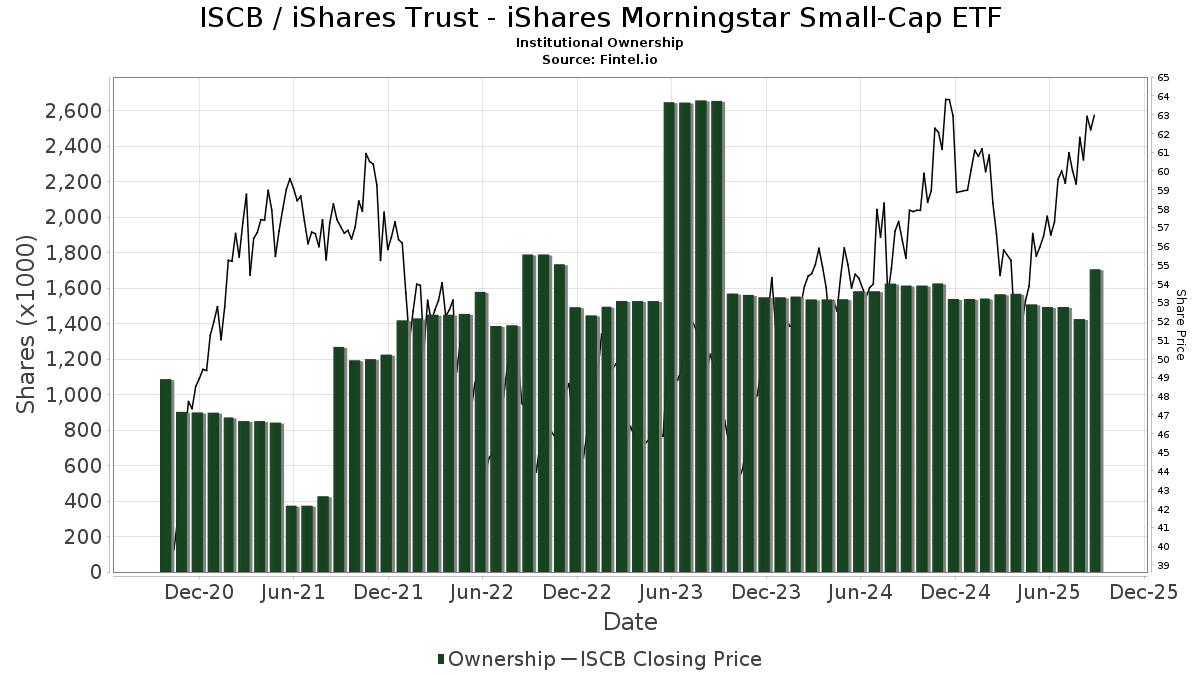
Institutionelt ejerskab og aktionærer
iShares Trust - iShares Morningstar Small-Cap ETF (US:ISCB) har 92 institutionelle ejere og aktionærer, der har indsendt 13D/G- eller 13F-formularer til Securities Exchange Commission (SEC). Disse institutioner har i alt 1,653,973 aktier. Største aktionærer omfatter Simplex Trading, Llc, Simplex Trading, Llc, Morgan Stanley, Cetera Investment Advisers, IMC-Chicago, LLC, LPL Financial LLC, Wells Fargo & Company/mn, Bank Of America Corp /de/, Goldman Sachs Group Inc, and Goldstein Advisors, LLC .
iShares Trust - iShares Morningstar Small-Cap ETF (ARCA:ISCB) institutionel ejerskabsstruktur viser aktuelle positioner i virksomheden efter institutioner og fonde, samt seneste ændringer i positionsstørrelse. Større aktionærer kan omfatte individuelle investorer, investeringsforeninger, hedgefonde eller institutioner. Skema 13D angiver, at investoren besidder (eller besidder) mere end 5 % af virksomheden og har til hensigt (eller har til hensigt at) aktivt at forfølge en ændring i forretningsstrategi. Skema 13G indikerer en passiv investering på over 5%.
The share price as of March 11, 2026 is 66,12 / share. Previously, on March 12, 2025, the share price was 54,43 / share. This represents an increase of 21,48% over that period.
Fondens stemningsscore
Fund Sentiment Score (fka Ownership Accumulation Score) finder de aktier, der bliver mest købt af fonde. Det er resultatet af en sofistikeret, multi-faktor kvantitativ model, der identificerer virksomheder med de højeste niveauer af institutionel akkumulering. Scoringsmodellen bruger en kombination af den samlede stigning i oplyste ejere, ændringerne i porteføljeallokeringer i disse ejere og andre målinger. Tallet går fra 0 til 100, hvor højere tal indikerer et højere niveau af akkumulering for sine jævnaldrende, og 50 er gennemsnittet.
Opdateringsfrekvens: Dagligt
Se Ownership Explorer, som giver en liste over højest rangerende virksomheder.
AI+ Ask Fintel’s AI assistant about iShares Trust - iShares Morningstar Small-Cap ETF.
Select a question to share a public post with an AI-crafted answer.
Thinking of good questions…
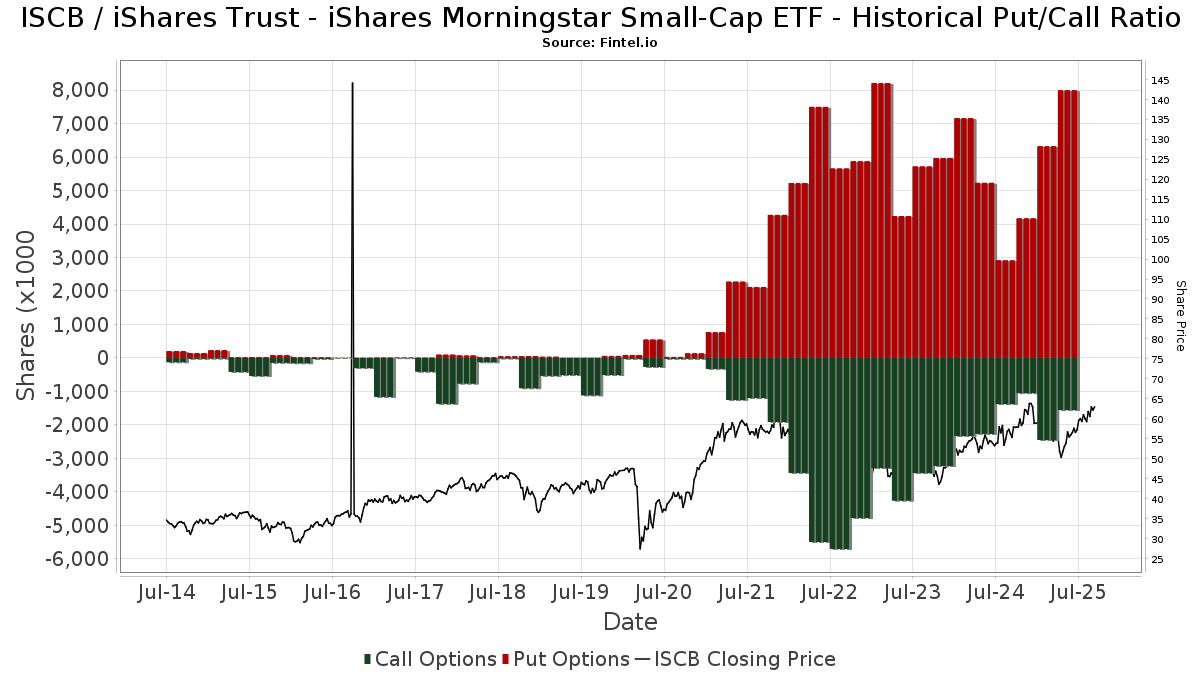
Institutionel Put/Call-forhold
Ud over at indberette standardaktie- og gældsudstedelser skal institutter med mere end 100 mill. aktiver under forvaltning også oplyse deres put- og call-optionsbeholdninger. Da salgsoptioner generelt indikerer negativ stemning, og købsoptioner indikerer positiv stemning, kan vi få en fornemmelse af den overordnede institutionelle stemning ved at plotte forholdet mellem put og kald. Diagrammet til højre viser det historiske put/call-forhold for dette instrument.
Brug af Put/Call Ratio som en indikator for investorernes stemning overvinder en af de vigtigste mangler ved at bruge totalt institutionelt ejerskab, som er, at en betydelig mængde af aktiver under forvaltning investeres passivt for at spore indekser. Passivt forvaltede fonde køber typisk ikke optioner, så indikatoren for put/call-forholdet følger mere nøje følelsen af aktivt forvaltede fonde.
13F og NPORT arkivering
Detaljer om 13F-arkivering er gratis. Detaljer om NP-ansøgninger kræver et premium-medlemskab. Grønne rækker angiver nye positioner. Røde rækker angiver lukkede positioner. Klik på linket ikon for at se den fulde transaktionshistorik.
Opgrader
for at låse premium-data op og eksportere til Excel ![]() .
.
| Fil dato | Kilde | Investor | Type | Gennemsnitlig pris (Øst) |
Aktier | Δ Aktier (%) |
Rapporteret Værdi ($1000) |
Δ Værdi (%) |
Port Alloc (%) |
|
|---|---|---|---|---|---|---|---|---|---|---|
| 2025-11-14 | 13F/A | NorthRock Partners, LLC | 0 | -100,00 | 0 | |||||
| 2026-02-17 | 13F | Legacy Wealth Partners, LLC | 8.618 | 560 | ||||||
| 2026-02-17 | 13F | Bank Of America Corp /de/ | 66.212 | -1,32 | 4.305 | 1,13 | ||||
| 2026-02-17 | 13F | Creative Planning | 3.923 | 0,00 | 255 | 2,82 | ||||
| 2026-02-17 | 13F | Fmr Llc | 7.607 | 2,59 | 495 | 5,11 | ||||
| 2026-02-09 | 13F | Smith Chas P & Associates Pa Cpas | 3.184 | 207 | ||||||
| 2026-01-22 | 13F | Christensen, King & Associates Investment Services, Inc. | 4.775 | -16,14 | 310 | -14,13 | ||||
| 2026-01-28 | 13F | WPG Advisers, LLC | 1.616 | 0,00 | 105 | 2,94 | ||||
| 2025-11-14 | 13F | Beacon Pointe Advisors, LLC | 0 | -100,00 | 0 | |||||
| 2026-02-17 | 13F | Private Advisor Group, LLC | 6.954 | -0,43 | 452 | 2,26 | ||||
| 2025-11-13 | 13F | Franklin Resources Inc | 0 | -100,00 | 0 | |||||
| 2026-02-12 | 13F | Steward Partners Investment Advisory, Llc | 5.742 | -0,31 | 373 | 2,19 | ||||
| 2026-01-07 | 13F | KFA Private Wealth Group, LLC | 10.679 | 0,00 | 694 | 2,51 | ||||
| 2026-01-27 | 13F | CenterStar Asset Management, LLC | Call | 5.400 | 12,50 | 520 | 1,17 | |||
| 2025-11-03 | 13F | Trifecta Capital Advisors, LLC | 0 | -100,00 | 0 | |||||
| 2026-01-26 | 13F | Nations Financial Group Inc, /ia/ /adv | 20.220 | -2,71 | 1.315 | -0,30 | ||||
| 2026-01-29 | 13F | Nbc Securities, Inc. | 2.325 | 7,19 | 151 | 10,22 | ||||
| 2026-01-26 | 13F | Merit Financial Group, LLC | 3.529 | 0,11 | 229 | 2,69 | ||||
| 2026-02-17 | 13F | United Capital Financial Advisers, Llc | 8.312 | 540 | ||||||
| 2026-02-12 | 13F | Colonial Trust Advisors | 247 | 0,00 | 16 | 6,67 | ||||
| 2026-01-29 | 13F | Comerica Bank | 3.791 | 242,77 | 246 | 251,43 | ||||
| 2026-02-11 | 13F | Simplex Trading, Llc | Call | 1.885.000 | -31,25 | 151.703 | 69.170,32 | |||
| 2026-02-17 | 13F | Wealth Watch Advisors, INC | 188 | 0,00 | 12 | 9,09 | ||||
| 2026-02-12 | 13F | Bank Of Montreal /can/ | 143 | 0,00 | 9 | 0,00 | ||||
| 2026-02-10 | 13F | Opulen Financial Group LLC | 6.181 | -8,01 | 402 | -5,87 | ||||
| 2026-02-17 | 13F | Persistent Asset Partners Ltd | Call | 0 | -100,00 | 0 | -100,00 | |||
| 2026-02-17 | 13F | Equitable Holdings, Inc. | 3.850 | 1,48 | 250 | 4,17 | ||||
| 2026-01-29 | 13F | UBS Group AG | 21.640 | -3,79 | 1.407 | -1,40 | ||||
| 2026-02-14 | 13F | New Insight Wealth Advisors | 5.783 | -12,50 | 376 | -10,50 | ||||
| 2026-02-06 | 13F | Pnc Financial Services Group, Inc. | 8.000 | 0,00 | 520 | 2,56 | ||||
| 2025-11-26 | 13F/A | Jpmorgan Chase & Co | Call | 0 | -100,00 | 0 | -100,00 | |||
| 2026-01-13 | 13F | Parsons Capital Management Inc/ri | 6.180 | -4,63 | 402 | -2,43 | ||||
| 2026-02-06 | 13F | HighTower Advisors, LLC | 24.554 | 1,72 | 1.596 | 4,31 | ||||
| 2026-02-17 | 13F | Raymond James Financial Inc | 33.242 | 0,14 | 2.161 | 2,66 | ||||
| 2026-02-10 | 13F/A | Northwestern Mutual Wealth Management Co | 22.349 | 26,41 | 1.453 | 29,53 | ||||
| 2026-02-12 | 13F | Schneider Downs Wealth Management Advisors, LP | 0 | -100,00 | 0 | |||||
| 2025-11-17 | 13F | CacheTech Inc. | 0 | -100,00 | 0 | |||||
| 2026-01-29 | 13F | Jim Saulnier & Associates, Llc | 10.153 | 0,67 | 660 | 3,29 | ||||
| 2026-01-08 | 13F | Wealth Enhancement Advisory Services, Llc | 3.211 | 0,03 | 217 | 5,88 | ||||
| 2026-02-10 | 13F | IAG Wealth Partners, LLC | 115 | 0,00 | 7 | 0,00 | ||||
| 2026-02-11 | 13F | LPL Financial LLC | 178.349 | 5,09 | 11.595 | 7,72 | ||||
| 2026-02-05 | 13F | Cambridge Investment Research Advisors, Inc. | 6.201 | -23,55 | 0 | |||||
| 2026-01-23 | 13F | Assetmark, Inc | 1.148 | -5,44 | 75 | -3,90 | ||||
| 2026-01-29 | 13F | IMC-Chicago, LLC | Put | 30.700 | -70,31 | 3.616 | -22,97 | |||
| 2026-02-06 | 13F | EverSource Wealth Advisors, LLC | 574 | 0,00 | 37 | 2,78 | ||||
| 2026-01-29 | 13F | IMC-Chicago, LLC | Call | 242.200 | 18,20 | 23.324 | 6,13 | |||
| 2025-11-14 | 13F | Adams Wealth Management | 0 | -100,00 | 0 | |||||
| 2026-02-13 | 13F | Level Four Advisory Services, Llc | 8.257 | -5,40 | 537 | -3,07 | ||||
| 2026-02-13 | 13F | Citigroup Inc | 2.117 | -19,29 | 138 | -17,47 | ||||
| 2026-02-04 | 13F | Tsfg, Llc | 420 | 0,00 | 0 | |||||
| 2026-02-06 | 13F | Larson Financial Group LLC | 10 | 0,00 | 1 | |||||
| 2026-02-06 | 13F | Global Retirement Partners, LLC | 287 | 0,00 | 19 | 0,00 | ||||
| 2026-01-23 | 13F | Rsm Us Wealth Management Llc | 24.869 | 0,46 | 1.632 | 3,89 | ||||
| 2026-01-30 | 13F | Archer Investment Corp | 92 | -55,77 | 6 | -61,54 | ||||
| 2026-02-17 | 13F | Ameriprise Financial Inc | 21.722 | -3,97 | 1.412 | -1,47 | ||||
| 2026-02-12 | 13F | Sfam, Llc | 629 | 41 | ||||||
| 2026-02-14 | 13F | Rockefeller Capital Management L.P. | 29.004 | 0,05 | 1.886 | 2,56 | ||||
| 2026-02-17 | 13F | Cape Investment Advisory, Inc. | 300 | 20 | ||||||
| 2026-02-11 | 13F | Group One Trading, L.p. | Put | 300 | 0,00 | 19 | 0,00 | |||
| 2026-02-17 | 13F | Jones Financial Companies Lllp | 3.990 | 38,49 | 259 | 42,31 | ||||
| 2026-01-14 | 13F | ORG Partners LLC | 360 | 0,00 | 23 | 4,55 | ||||
| 2026-01-28 | 13F | Geneos Wealth Management Inc. | 1.278 | 576,19 | 83 | 654,55 | ||||
| 2026-02-09 | 13F | Huntington National Bank | 1 | 0,00 | 0 | |||||
| 2026-02-09 | 13F | Key FInancial Inc | 1.505 | 30,30 | 98 | 32,88 | ||||
| 2026-02-17 | 13F | Fountainhead AM, LLC | 2.302 | 210 | ||||||
| 2026-02-17 | 13F | Matrix Private Capital Group Llc | 792 | 0,00 | 51 | 2,00 | ||||
| 2026-02-12 | 13F | Litman Gregory Asset Management LLC | 2.239 | 146 | ||||||
| 2026-01-26 | 13F | Cwm, Llc | 1.677 | 0,00 | 0 | |||||
| 2026-02-17 | 13F | Susquehanna International Group, Llp | 5.503 | -46,96 | 358 | -45,74 | ||||
| 2026-02-17 | 13F | Gladstone Institutional Advisory LLC | 36.540 | -2,47 | 2.376 | -0,04 | ||||
| 2025-11-14 | 13F | Advisor Group Holdings, Inc. | Put | 0 | -100,00 | 0 | ||||
| 2026-02-02 | 13F | Ashton Thomas Securities, Llc | 0 | -100,00 | 0 | |||||
| 2026-02-10 | 13F | Lido Advisors, LLC | 5.892 | 0,00 | 374 | 0,00 | ||||
| 2026-01-07 | 13F | Pps&v Asset Management Consultants, Inc. | 5.755 | 0,00 | 374 | 2,47 | ||||
| 2026-02-12 | 13F | Principal Securities, Inc. | 0 | -100,00 | 0 | |||||
| 2026-02-13 | 13F | Wells Fargo & Company/mn | 71.397 | 0,35 | 4.642 | 2,86 | ||||
| 2026-02-13 | 13F | Mariner, LLC | 6.507 | 0,46 | 423 | 3,17 | ||||
| 2026-02-10 | 13F | Goldman Sachs Group Inc | 43.648 | 0,00 | 2.838 | 2,49 | ||||
| 2026-01-02 | 13F | Global Wealth Strategies & Associates | 500 | -16,81 | 33 | -15,79 | ||||
| 2026-02-10 | 13F | Goldstein Advisors, LLC | 38.158 | -3,15 | 2.481 | -0,76 | ||||
| 2026-02-11 | 13F | Brand Asset Management Group, Inc. | 22.853 | -5,78 | 1.486 | -3,45 | ||||
| 2026-02-11 | 13F | Janney Montgomery Scott LLC | 3.428 | 0,00 | 0 | |||||
| 2026-02-17 | 13F | Russell Investments Group, Ltd. | 91 | 0,00 | 6 | 0,00 | ||||
| 2026-01-14 | 13F | Pathway Financial Advisors LLC | 4.350 | 0,00 | 294 | 6,55 | ||||
| 2026-02-11 | 13F | Jpmorgan Chase & Co | 17.394 | 6,03 | 1.131 | 8,65 | ||||
| 2026-02-13 | 13F | Kestra Advisory Services, LLC | 2.296 | 149 | ||||||
| 2026-02-12 | 13F | Richwood Investment Advisors, LLC | 9.579 | -4,39 | 668 | 5,04 | ||||
| 2026-02-17 | 13F | Cetera Investment Advisers | 270.042 | 1,73 | 17.556 | 4,28 | ||||
| 2026-01-13 | 13F | Signature Securities Group Corporation | 5.711 | 0,95 | 371 | 3,63 | ||||
| 2026-02-20 | 13F | Sunbelt Securities, Inc. | 80 | 5 | ||||||
| 2026-01-16 | 13F | Perigon Wealth Management, LLC | 7.590 | 0,12 | 493 | 2,71 | ||||
| 2025-11-18 | 13F | Apexium Financial, Lp | 8.312 | 0,00 | 527 | 8,88 | ||||
| 2026-02-17 | 13F | Strategic Financial Planning, Inc. | 3.580 | 0,00 | 233 | 2,20 | ||||
| 2026-02-17 | 13F | Guardian Wealth Advisors, Llc / Nc | 4.021 | 0,40 | 261 | 2,76 | ||||
| 2026-02-17 | 13F | Royal Bank Of Canada | 10.962 | -18,55 | 713 | -16,41 | ||||
| 2026-02-12 | 13F | Commonwealth Equity Services, Llc | 34.485 | -3,33 | 2.242 | 111.950,00 | ||||
| 2026-02-13 | 13F | Aptus Capital Advisors, LLC | 4.089 | 0,39 | 266 | 2,71 | ||||
| 2026-02-18 | 13F | GWM Advisors LLC | 560 | 0,18 | 36 | 2,86 | ||||
| 2026-01-23 | 13F | Farther Finance Advisors, LLC | 1.552 | 0,00 | 101 | 2,04 | ||||
| 2026-02-11 | 13F | Group One Trading, L.p. | Call | 3.100 | -98,71 | 169 | -98,99 | |||
| 2026-02-11 | 13F | Simplex Trading, Llc | Put | 5.327.600 | 11,72 | 433.974 | 109.213,10 | |||
| 2026-02-13 | 13F | Morgan Stanley | 361.019 | -2,76 | 23.471 | -0,34 | ||||
| 2026-01-14 | 13F | Spire Wealth Management | 281 | 208,79 | 18 | 260,00 | ||||
| 2026-02-17 | 13F | Advisor Group Holdings, Inc. | 12.692 | 2,07 | 825 | 5,23 | ||||
| 2026-02-17 | 13F | Mercer Global Advisors Inc /adv | 26.138 | -0,31 | 1.699 | 2,23 | ||||
| 2026-02-17 | 13F | Citadel Advisors Llc | 33.922 | 7,77 | 2.205 | 10,47 | ||||
| 2026-01-22 | 13F | Bartlett & Co. Wealth Management Llc | 3.600 | 0,00 | 234 | 2,63 |