Grundlæggende statistik
| Institutionelle ejere | 87 total, 87 long only, 0 short only, 0 long/short - change of 8,75% MRQ |
| Gennemsnitlig porteføljeallokering | 0.1211 % - change of 11,91% MRQ |
| Institutionelle aktier (lange) | 26.792.684 (ex 13D/G) - change of 1,94MM shares 7,81% MRQ |
| Institutionel værdi (lang) | $ 811.409 USD ($1000) |
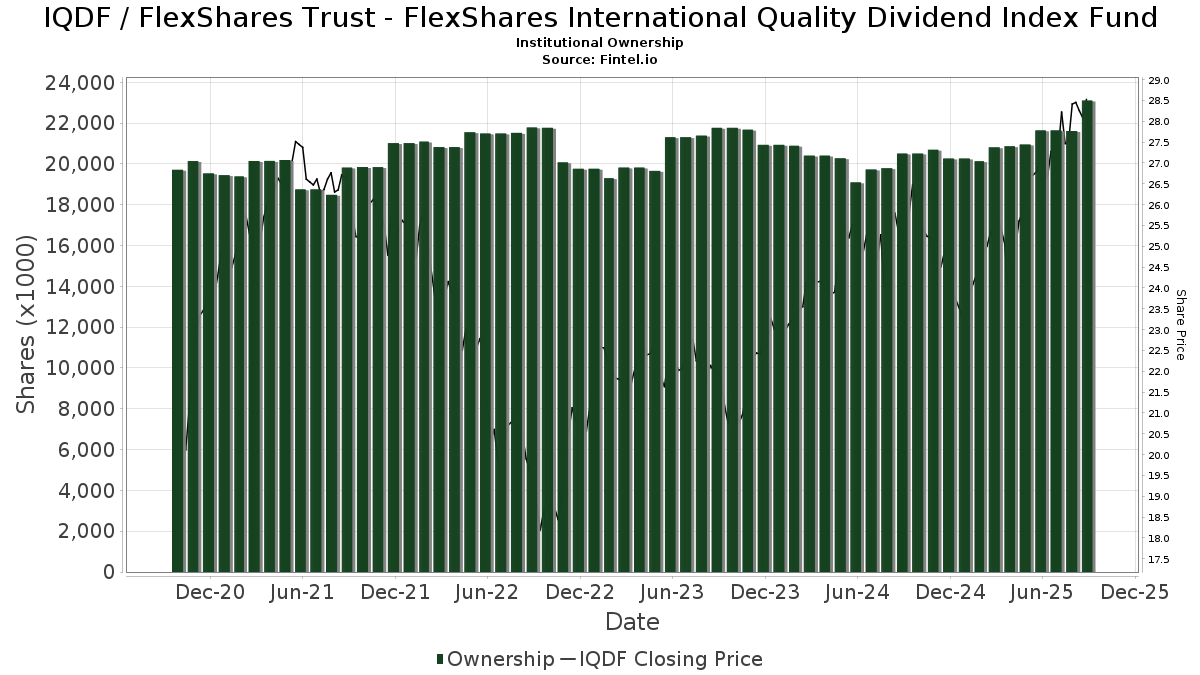
Institutionelt ejerskab og aktionærer
FlexShares Trust - FlexShares International Quality Dividend Index Fund (US:IQDF) har 87 institutionelle ejere og aktionærer, der har indsendt 13D/G- eller 13F-formularer til Securities Exchange Commission (SEC). Disse institutioner har i alt 26,792,684 aktier. Største aktionærer omfatter Northern Trust Corp, Keybank National Association/oh, Royal Bank Of Canada, Morgan Stanley, Bank of New York Mellon Corp, UBS Group AG, Envestnet Asset Management Inc, Wealthspire Advisors, LLC, Wells Fargo & Company/mn, and Creative Planning .
FlexShares Trust - FlexShares International Quality Dividend Index Fund (ARCA:IQDF) institutionel ejerskabsstruktur viser aktuelle positioner i virksomheden efter institutioner og fonde, samt seneste ændringer i positionsstørrelse. Større aktionærer kan omfatte individuelle investorer, investeringsforeninger, hedgefonde eller institutioner. Skema 13D angiver, at investoren besidder (eller besidder) mere end 5 % af virksomheden og har til hensigt (eller har til hensigt at) aktivt at forfølge en ændring i forretningsstrategi. Skema 13G indikerer en passiv investering på over 5%.
The share price as of March 18, 2026 is 31,52 / share. Previously, on March 19, 2025, the share price was 25,74 / share. This represents an increase of 22,44% over that period.
Fondens stemningsscore
Fund Sentiment Score (fka Ownership Accumulation Score) finder de aktier, der bliver mest købt af fonde. Det er resultatet af en sofistikeret, multi-faktor kvantitativ model, der identificerer virksomheder med de højeste niveauer af institutionel akkumulering. Scoringsmodellen bruger en kombination af den samlede stigning i oplyste ejere, ændringerne i porteføljeallokeringer i disse ejere og andre målinger. Tallet går fra 0 til 100, hvor højere tal indikerer et højere niveau af akkumulering for sine jævnaldrende, og 50 er gennemsnittet.
Opdateringsfrekvens: Dagligt
Se Ownership Explorer, som giver en liste over højest rangerende virksomheder.
AI+ Ask Fintel’s AI assistant about FlexShares Trust - FlexShares International Quality Dividend Index Fund.
Select a question to share a public post with an AI-crafted answer.
Thinking of good questions…
Institutionel Put/Call-forhold
Ud over at indberette standardaktie- og gældsudstedelser skal institutter med mere end 100 mill. aktiver under forvaltning også oplyse deres put- og call-optionsbeholdninger. Da salgsoptioner generelt indikerer negativ stemning, og købsoptioner indikerer positiv stemning, kan vi få en fornemmelse af den overordnede institutionelle stemning ved at plotte forholdet mellem put og kald. Diagrammet til højre viser det historiske put/call-forhold for dette instrument.
Brug af Put/Call Ratio som en indikator for investorernes stemning overvinder en af de vigtigste mangler ved at bruge totalt institutionelt ejerskab, som er, at en betydelig mængde af aktiver under forvaltning investeres passivt for at spore indekser. Passivt forvaltede fonde køber typisk ikke optioner, så indikatoren for put/call-forholdet følger mere nøje følelsen af aktivt forvaltede fonde.
13F og NPORT arkivering
Detaljer om 13F-arkivering er gratis. Detaljer om NP-ansøgninger kræver et premium-medlemskab. Grønne rækker angiver nye positioner. Røde rækker angiver lukkede positioner. Klik på linket ikon for at se den fulde transaktionshistorik.
Opgrader
for at låse premium-data op og eksportere til Excel ![]() .
.
| Fil dato | Kilde | Investor | Type | Gennemsnitlig pris (Øst) |
Aktier | Δ Aktier (%) |
Rapporteret Værdi ($1000) |
Δ Værdi (%) |
Port Alloc (%) |
|
|---|---|---|---|---|---|---|---|---|---|---|
| 2025-10-16 | 13F | Fortress Wealth Management, Inc. | 37.456 | 19,07 | 1.069 | 25,35 | ||||
| 2026-02-17 | 13F | Northern Trust Corp | 16.233.663 | 8,11 | 493.503 | 15,18 | ||||
| 2025-11-12 | 13F | Stifel Financial Corp | 0 | -100,00 | 0 | |||||
| 2026-02-13 | 13F | MAI Capital Management | 2.579 | 0,12 | 78 | 6,85 | ||||
| 2026-02-03 | 13F | Winch Advisory Services, LLC | 201 | 0,00 | 6 | 20,00 | ||||
| 2026-01-09 | 13F | First Heartland Consultants, Inc. | 12.323 | 375 | ||||||
| 2026-02-17 | 13F | Creative Planning | 182.633 | 3,27 | 5.552 | 10,03 | ||||
| 2026-02-17 | 13F | Aqr Capital Management Llc | 20.448 | -19,52 | 622 | -14,34 | ||||
| 2025-11-14 | 13F | Goldman Sachs Group Inc | 0 | -100,00 | 0 | |||||
| 2026-01-29 | 13F | UBS Group AG | 603.720 | 1,90 | 18.353 | 8,56 | ||||
| 2026-02-17 | 13F | Mercer Global Advisors Inc /adv | 27.299 | 20,38 | 830 | 28,13 | ||||
| 2026-02-13 | 13F | Morgan Stanley | 784.538 | 3,35 | 23.850 | 10,11 | ||||
| 2026-01-12 | 13F | RVW Wealth, LLC | 15.318 | 0,00 | 466 | 6,41 | ||||
| 2026-01-28 | 13F | APS Management Group, Inc. | 14.929 | 1,00 | 454 | 7,60 | ||||
| 2026-02-12 | 13F | Commonwealth Equity Services, Llc | 61.422 | -3,56 | 1.867 | 186.600,00 | ||||
| 2026-01-27 | 13F | Meritage Portfolio Management | 6.750 | 205 | ||||||
| 2026-02-17 | 13F | Ameriprise Financial Inc | 10.422 | 0,34 | 317 | 6,76 | ||||
| 2026-02-06 | 13F | Larson Financial Group LLC | 528 | 0,57 | 16 | 14,29 | ||||
| 2026-02-13 | 13F | Kestra Advisory Services, LLC | 0 | -100,00 | 0 | |||||
| 2026-01-27 | 13F | Holcombe Financial, Inc. | 168.578 | 66,31 | 5.125 | 77,18 | ||||
| 2026-02-05 | 13F | Bessemer Group Inc | 0 | -100,00 | 0 | |||||
| 2026-02-13 | 13F | Baird Financial Group, Inc. | 48.419 | 2,63 | 1.472 | 9,29 | ||||
| 2026-02-17 | 13F | Regal Investment Advisors LLC | 18.627 | 7,95 | 566 | 15,04 | ||||
| 2026-01-27 | 13F | Clark Asset Management, LLC | 10.708 | 326 | ||||||
| 2026-02-17 | 13F | Bank Of America Corp /de/ | 79.497 | 10,54 | 2.417 | 17,74 | ||||
| 2026-02-02 | 13F | Montag A & Associates Inc | 1.750 | 53 | ||||||
| 2026-02-17 | 13F | Advisor Group Holdings, Inc. | 15.310 | -0,85 | 465 | 6,16 | ||||
| 2026-02-14 | 13F | Rockefeller Capital Management L.P. | 0 | -100,00 | 0 | -100,00 | ||||
| 2025-11-10 | 13F | Siligmueller & Norvid Wealth Advisors LLC | 0 | -100,00 | 0 | |||||
| 2026-02-06 | 13F | HighTower Advisors, LLC | 95.834 | 2,12 | 2.913 | 8,82 | ||||
| 2026-02-05 | 13F | Atria Investments Llc | 15.298 | 465 | ||||||
| 2026-01-23 | 13F | Nbt Bank N A /ny | 12.285 | -0,49 | 373 | 5,97 | ||||
| 2026-02-18 | 13F | EP Wealth Advisors, Inc. | 0 | -100,00 | 0 | |||||
| 2026-02-17 | 13F | Susquehanna International Group, Llp | 98.257 | -18,78 | 2.987 | -13,47 | ||||
| 2026-02-11 | 13F | Atlantic Private Wealth, LLC | 5.229 | 0,00 | 159 | 6,04 | ||||
| 2026-02-17 | 13F | Raymond James Financial Inc | 78.475 | 15,03 | 2.386 | 22,56 | ||||
| 2026-02-17 | 13F | Jones Financial Companies Lllp | 50.933 | 0,73 | 1.548 | 7,87 | ||||
| 2026-01-13 | 13F | Mather Group, Llc. | 62.651 | 3,13 | 1.905 | 9,87 | ||||
| 2026-01-23 | 13F | Aspect Partners, LLC | 0 | -100,00 | 0 | |||||
| 2026-01-29 | 13F | Simon Quick Advisors, Llc | 0 | -100,00 | 0 | |||||
| 2026-02-09 | 13F | Valued Retirements, Inc. | 14.996 | 0,00 | 456 | 12,07 | ||||
| 2026-02-05 | 13F | Allworth Financial LP | 137.341 | -0,55 | 4.175 | 5,96 | ||||
| 2026-02-11 | 13F | Jpmorgan Chase & Co | 16.532 | 0,31 | 503 | 6,81 | ||||
| 2026-02-17 | 13F/A | Sentinus, LLC | 15.909 | 484 | ||||||
| 2026-01-21 | 13F | SJS Investment Consulting Inc. | 1.883 | 0,00 | 57 | 7,55 | ||||
| 2026-01-22 | 13F | Red Tortoise LLC | 47.636 | 0,34 | 1.448 | 6,94 | ||||
| 2026-02-13 | 13F | Umb Bank N A/mo | 96.309 | -24,69 | 2.928 | -19,76 | ||||
| 2026-02-13 | 13F | Wells Fargo & Company/mn | 293.902 | 95,68 | 8.935 | 108,49 | ||||
| 2026-02-05 | 13F | WealthPlan Investment Management, LLC | 8.113 | 247 | ||||||
| 2026-02-17 | 13F | Tower Research Capital LLC (TRC) | 13 | 0 | ||||||
| 2026-02-12 | 13F | Principal Securities, Inc. | 0 | -100,00 | 0 | -100,00 | ||||
| 2026-02-17 | 13F | Cetera Investment Advisers | 11.613 | 6,57 | 353 | 13,87 | ||||
| 2026-01-16 | 13F | Crewe Advisors LLC | 12.722 | 0,00 | 387 | 6,34 | ||||
| 2026-02-13 | 13F | Mml Investors Services, Llc | 113.273 | 11,87 | 3.444 | 19,18 | ||||
| 2026-02-12 | 13F | Wealthspire Advisors, LLC | 367.110 | 0,08 | 11.160 | 6,62 | ||||
| 2025-10-07 | 13F | Thurston, Springer, Miller, Herd & Titak, Inc. | 0 | -100,00 | 0 | |||||
| 2026-02-11 | 13F | LPL Financial LLC | 131.554 | 19,86 | 3.999 | 27,72 | ||||
| 2026-02-04 | 13F | GGM Financials LLC | 2.386 | 73 | ||||||
| 2026-02-12 | 13F | Bank Of Montreal /can/ | 5.229 | 0,00 | 159 | 6,04 | ||||
| 2026-01-22 | 13F | Comprehensive Money Management Services LLC | 7.125 | 0,00 | 217 | 6,40 | ||||
| 2026-02-17 | 13F | Royal Bank Of Canada | 1.871.472 | 5,35 | 56.892 | 12,23 | ||||
| 2026-02-13 | 13F | Quartz Partners, LLC | 15.264 | 0,00 | 464 | 6,67 | ||||
| 2026-01-13 | 13F | First Financial Corp /in/ | 104.470 | 0,00 | 3.176 | 6,51 | ||||
| 2026-02-12 | 13F | Hrt Financial Lp | 16.200 | 0 | ||||||
| 2026-02-10 | 13F | Bank of New York Mellon Corp | 751.777 | 14,88 | 22.854 | 22,39 | ||||
| 2026-02-13 | 13F | Flow Traders U.s. Llc | 42.890 | -44,32 | 1 | -50,00 | ||||
| 2026-02-04 | 13F | Wsfs Capital Management, Llc | 16.618 | 0,00 | 505 | 6,54 | ||||
| 2026-02-17 | 13F | TCG Advisory Services, LLC | 34.186 | 1.039 | ||||||
| 2026-02-10 | 13F/A | Northwestern Mutual Wealth Management Co | 2.681 | -49,45 | 81 | -46,36 | ||||
| 2026-02-12 | 13F | Empire Financial Management Company, LLC | 11.768 | -2,85 | 358 | 3,48 | ||||
| 2026-02-10 | 13F | Natixis Advisors, L.p. | 13.707 | 16,49 | 0 | |||||
| 2026-01-12 | 13F | CVA Family Office, LLC | 165 | 0,00 | 5 | 25,00 | ||||
| 2026-02-18 | 13F | GWM Advisors LLC | 20.075 | 33,27 | 610 | 42,19 | ||||
| 2026-01-30 | 13F | Us Bancorp \de\ | 1.438 | 13,05 | 44 | 19,44 | ||||
| 2026-02-13 | 13F | Smartleaf Asset Management LLC | 0 | -100,00 | 0 | |||||
| 2026-02-04 | 13F | Anson Capital, Inc. | 10.673 | 0,00 | 324 | 6,58 | ||||
| 2026-01-26 | 13F | Cwm, Llc | 163 | 0,00 | 0 | |||||
| 2026-02-03 | 13F | International Assets Investment Management, Llc | 374 | 11 | ||||||
| 2026-02-05 | 13F | Cambridge Investment Research Advisors, Inc. | 25.157 | 1 | ||||||
| 2026-02-03 | 13F | Cabot Wealth Management Inc | 7.098 | 216 | ||||||
| 2026-02-10 | 13F | Envestnet Asset Management Inc | 561.042 | 1,77 | 17.056 | 8,42 | ||||
| 2026-01-26 | 13F | Harbor Asset Planning, Inc. | 573 | 0,70 | 17 | 6,25 | ||||
| 2026-02-12 | 13F | Absolute Capital Management, LLC | 0 | -100,00 | 0 | |||||
| 2025-10-16 | 13F | Ronald Blue Trust, Inc. | 0 | -100,00 | 0 | |||||
| 2026-01-23 | 13F | Live Oak Private Wealth LLC | 8.857 | 0,00 | 269 | 6,75 | ||||
| 2026-01-27 | 13F | PFG Advisors | 6.667 | 203 | ||||||
| 2026-02-06 | 13F | Americana Partners, LLC | 0 | -100,00 | 0 | |||||
| 2026-02-18 | 13F | Hanlon Investment Management, Inc. | 102.664 | 2,87 | 3.121 | 9,59 | ||||
| 2026-01-22 | 13F | Charter Capital Management, LLC\DE | 11.405 | 0,00 | 347 | 6,46 | ||||
| 2026-01-23 | 13F | Farther Finance Advisors, LLC | 43.901 | 21.850,50 | 1.335 | 26.580,00 | ||||
| 2026-02-02 | 13F | Essex Savings Bank | 16.006 | 0,00 | 486 | 6,58 | ||||
| 2026-01-29 | 13F | Comerica Bank | 16.621 | -5,37 | 505 | 0,80 | ||||
| 2026-02-12 | 13F | BlackRock, Inc. | 1.026 | 0,00 | 31 | 6,90 | ||||
| 2026-01-29 | 13F | Nbc Securities, Inc. | 7.600 | 4,57 | 231 | 11,59 | ||||
| 2026-02-19 | 13F | WealthPoint Financial, LLC | 13.430 | 408 | ||||||
| 2026-02-17 | 13F | Fmr Llc | 5.271 | 6.745,45 | 160 | 7.900,00 | ||||
| 2025-11-06 | 13F | MSH Capital Advisors LLC | 0 | -100,00 | 0 | |||||
| 2026-01-30 | 13F | Keybank National Association/oh | 2.860.205 | 7,45 | 86.950 | 14,48 | ||||
| 2026-02-13 | 13F | Fortis Capital Management LLC | 7.133 | 0,00 | 217 | 6,40 | ||||
| 2026-01-30 | 13F | Caldwell Securities, Inc | 271 | -83,63 | 8 | -82,98 | ||||
| 2026-02-05 | 13F | Rossmore Private Capital | 2.250 | 0,00 | 68 | 6,25 | ||||
| 2026-01-30 | 13F | Wealthfront Advisers Llc | 94.182 | -0,02 | 2.863 | 6,55 | ||||
| 2026-02-12 | 13F | Jane Street Group, Llc | 27.678 | 841 | ||||||
| 2025-10-15 | 13F | Brookstone Capital Management | 0 | -100,00 | 0 |