Grundlæggende statistik
| Institutionelle ejere | 186 total, 186 long only, 0 short only, 0 long/short - change of 3,31% MRQ |
| Gennemsnitlig porteføljeallokering | 0.2536 % - change of 38,83% MRQ |
| Institutionelle aktier (lange) | 8.652.066 (ex 13D/G) - change of 1,52MM shares 21,27% MRQ |
| Institutionel værdi (lang) | $ 626.623 USD ($1000) |
Institutionelt ejerskab og aktionærer
iShares Trust - iShares Morningstar Mid-Cap ETF (US:IMCB) har 186 institutionelle ejere og aktionærer, der har indsendt 13D/G- eller 13F-formularer til Securities Exchange Commission (SEC). Disse institutioner har i alt 8,652,066 aktier. Største aktionærer omfatter UBS Group AG, Morgan Stanley, RMG Wealth Management LLC, LPL Financial LLC, Commonwealth Equity Services, Llc, Means Investment Co., Inc., Raymond James Financial Inc, Cetera Investment Advisers, Steele Capital Management, Inc., and Matrix Trust Co .
iShares Trust - iShares Morningstar Mid-Cap ETF (ARCA:IMCB) institutionel ejerskabsstruktur viser aktuelle positioner i virksomheden efter institutioner og fonde, samt seneste ændringer i positionsstørrelse. Større aktionærer kan omfatte individuelle investorer, investeringsforeninger, hedgefonde eller institutioner. Skema 13D angiver, at investoren besidder (eller besidder) mere end 5 % af virksomheden og har til hensigt (eller har til hensigt at) aktivt at forfølge en ændring i forretningsstrategi. Skema 13G indikerer en passiv investering på over 5%.
The share price as of September 11, 2025 is 83,45 / share. Previously, on September 12, 2024, the share price was 73,40 / share. This represents an increase of 13,69% over that period.

Fondens stemningsscore
Fund Sentiment Score (fka Ownership Accumulation Score) finder de aktier, der bliver mest købt af fonde. Det er resultatet af en sofistikeret, multi-faktor kvantitativ model, der identificerer virksomheder med de højeste niveauer af institutionel akkumulering. Scoringsmodellen bruger en kombination af den samlede stigning i oplyste ejere, ændringerne i porteføljeallokeringer i disse ejere og andre målinger. Tallet går fra 0 til 100, hvor højere tal indikerer et højere niveau af akkumulering for sine jævnaldrende, og 50 er gennemsnittet.
Opdateringsfrekvens: Dagligt
Se Ownership Explorer, som giver en liste over højest rangerende virksomheder.
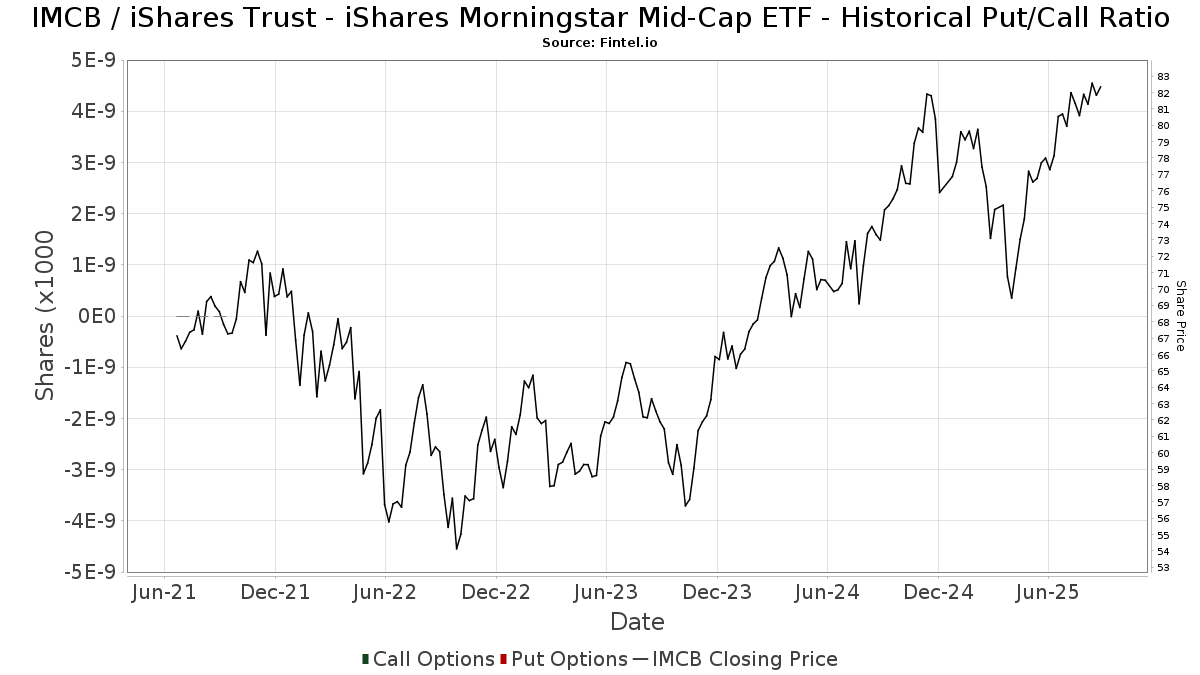
Institutionel Put/Call-forhold
Ud over at indberette standardaktie- og gældsudstedelser skal institutter med mere end 100 mill. aktiver under forvaltning også oplyse deres put- og call-optionsbeholdninger. Da salgsoptioner generelt indikerer negativ stemning, og købsoptioner indikerer positiv stemning, kan vi få en fornemmelse af den overordnede institutionelle stemning ved at plotte forholdet mellem put og kald. Diagrammet til højre viser det historiske put/call-forhold for dette instrument.
Brug af Put/Call Ratio som en indikator for investorernes stemning overvinder en af de vigtigste mangler ved at bruge totalt institutionelt ejerskab, som er, at en betydelig mængde af aktiver under forvaltning investeres passivt for at spore indekser. Passivt forvaltede fonde køber typisk ikke optioner, så indikatoren for put/call-forholdet følger mere nøje følelsen af aktivt forvaltede fonde.
13F og NPORT arkivering
Detaljer om 13F-arkivering er gratis. Detaljer om NP-ansøgninger kræver et premium-medlemskab. Grønne rækker angiver nye positioner. Røde rækker angiver lukkede positioner. Klik på linket ikon for at se den fulde transaktionshistorik.
Opgrader
for at låse premium-data op og eksportere til Excel ![]() .
.
| Fil dato | Kilde | Investor | Type | Gennemsnitlig pris (Øst) |
Aktier | Δ Aktier (%) |
Rapporteret Værdi ($1000) |
Δ Værdi (%) |
Port Alloc (%) |
|
|---|---|---|---|---|---|---|---|---|---|---|
| 2025-08-14 | 13F | Diversify Advisory Services, LLC | 8.729 | -3,06 | 706 | 7,29 | ||||
| 2025-08-06 | 13F | Hoxton Planning & Management, LLC | 5.841 | 465 | ||||||
| 2025-08-11 | 13F | Synergy Investment Management, LLC | 0 | -100,00 | 0 | |||||
| 2025-07-16 | 13F | Signaturefd, Llc | 1.596 | 1,79 | 127 | 9,48 | ||||
| 2025-07-15 | 13F | Pitti Group Wealth Management, LLC | 16.507 | -2,66 | 1.315 | 4,62 | ||||
| 2025-05-12 | 13F | C2P Capital Advisory Group, LLC d.b.a. Prosperity Capital Advisors | 0 | -100,00 | 0 | -100,00 | ||||
| 2025-07-31 | 13F | Cambridge Investment Research Advisors, Inc. | 83.538 | 4,81 | 7 | 20,00 | ||||
| 2025-08-14 | 13F | UBS Group AG | 1.309.271 | 3,80 | 104.297 | 11,61 | ||||
| 2025-08-14 | 13F | Wealth Preservation Advisors, LLC | 705 | 0,43 | 56 | 7,69 | ||||
| 2025-08-08 | 13F | Good Life Advisors, LLC | 5.076 | 0,00 | 404 | 7,45 | ||||
| 2025-08-13 | 13F | Financial Freedom, LLC | 936 | 0,00 | 75 | 7,25 | ||||
| 2025-08-05 | 13F | Sigma Planning Corp | 3.911 | 0,10 | 312 | 7,61 | ||||
| 2025-08-05 | 13F | GPS Wealth Strategies Group, LLC | 6 | 0,00 | 0 | |||||
| 2025-08-08 | 13F | Financial Gravity Companies, Inc. | 328 | 0,00 | 26 | 8,33 | ||||
| 2025-08-14 | 13F | Stifel Financial Corp | 74.517 | -1,10 | 5.936 | 6,36 | ||||
| 2025-08-11 | 13F | United Advisor Group, LLC | 22.837 | 16,99 | 1.819 | 25,80 | ||||
| 2025-08-05 | 13F | Ellevest, Inc. | 2.639 | 210 | ||||||
| 2025-07-21 | 13F | HighMark Wealth Management LLC | 1.297 | 0,00 | 103 | 7,29 | ||||
| 2025-07-21 | 13F | Barrett & Company, Inc. | 3.216 | 0,34 | 256 | 8,02 | ||||
| 2025-07-30 | 13F | Fingerlakes Wealth Management, Inc. | 2.618 | 209 | ||||||
| 2025-08-05 | 13F | Atlas Private Wealth Advisors | 3.882 | -34,82 | 309 | -29,93 | ||||
| 2025-08-11 | 13F | Rothschild Investment Llc | 1.451 | 0,00 | 116 | 7,48 | ||||
| 2025-08-19 | 13F | Advisory Services Network, LLC | 12.085 | -6,91 | 978 | 1,77 | ||||
| 2025-08-13 | 13F | Haverford Trust Co | 6.517 | 0,00 | 519 | 7,68 | ||||
| 2025-07-21 | 13F | Pacific Financial Group Inc | 64.764 | 1,21 | 5.159 | 8,84 | ||||
| 2025-08-06 | 13F | AE Wealth Management LLC | 1.348 | 97,65 | 107 | 114,00 | ||||
| 2025-07-28 | 13F | Private Wealth Asset Management, LLC | 1.245 | -23,85 | 99 | -18,18 | ||||
| 2025-08-14 | 13F | Citadel Advisors Llc | 12.425 | 990 | ||||||
| 2025-04-29 | 13F | Resources Investment Advisors, LLC. | 0 | -100,00 | 0 | -100,00 | ||||
| 2025-08-15 | 13F | Truefg, Llc | 9.332 | -0,70 | 743 | 6,75 | ||||
| 2025-07-23 | 13F | Detalus Advisors, LLC | 3.184 | 6,88 | 254 | 15,00 | ||||
| 2025-08-07 | 13F | Addison Advisors LLC | 2.650 | -33,50 | 211 | -28,47 | ||||
| 2025-07-25 | 13F | Cwm, Llc | 13.933 | 3,84 | 1 | |||||
| 2025-04-10 | 13F | EWG Elevate Inc. | 0 | -100,00 | 0 | |||||
| 2025-07-24 | 13F | Morton Brown Family Wealth, LLC | 482 | 0,21 | 38 | 8,57 | ||||
| 2025-07-23 | 13F | Opulen Financial Group LLC | 8.149 | -3,34 | 649 | 4,01 | ||||
| 2025-08-13 | 13F | Capital Analysts, Inc. | 209 | 0,00 | 0 | |||||
| 2025-08-14 | 13F | Goldman Sachs Group Inc | 43.380 | 0,00 | 3.456 | 7,53 | ||||
| 2025-08-12 | 13F | PSI Advisors, LLC | 0 | -100,00 | 0 | |||||
| 2025-08-08 | 13F | Pnc Financial Services Group, Inc. | 692 | 0,29 | 55 | 7,84 | ||||
| 2025-08-12 | 13F | Ameritas Investment Partners, Inc. | 9.380 | 39,81 | 747 | 50,30 | ||||
| 2025-08-07 | 13F | Vise Technologies, Inc. | 4.978 | 397 | ||||||
| 2025-04-24 | 13F | Loring Wolcott & Coolidge Fiduciary Advisors Llp/ma | 0 | -100,00 | 0 | |||||
| 2025-08-12 | 13F | Franklin Resources Inc | 2.000 | 0,00 | 159 | 7,43 | ||||
| 2025-07-29 | 13F | Financial Futures Ltd Liability Co. | 5.586 | 0,00 | 445 | 7,51 | ||||
| 2025-08-13 | 13F | Flow Traders U.s. Llc | 0 | -100,00 | 0 | |||||
| 2025-08-14 | 13F | Glen Eagle Advisors, LLC | 184 | 0,00 | 15 | 7,69 | ||||
| 2025-08-08 | 13F | Evolution Wealth Advisors, LLC | 4.000 | 0,00 | 319 | 7,43 | ||||
| 2025-08-14 | 13F | Mercer Global Advisors Inc /adv | 81.572 | 6.498 | ||||||
| 2025-08-05 | 13F | Huntington National Bank | 80 | 6,76 | ||||||
| 2025-08-07 | 13F | Summit Asset Management, LLC | 9.855 | 0,00 | 785 | 7,53 | ||||
| 2025-08-06 | 13F | Commonwealth Equity Services, Llc | 382.362 | -4,16 | 30 | 3,45 | ||||
| 2025-08-12 | 13F | Proequities, Inc. | 0 | 0 | ||||||
| 2025-08-26 | 13F/A | Thrivent Financial For Lutherans | 0 | -100,00 | 0 | |||||
| 2025-07-25 | 13F | Means Investment Co., Inc. | 319.053 | 5,32 | 25.416 | 13,25 | ||||
| 2025-08-07 | 13F | Allworth Financial LP | 439 | 0,00 | 35 | 9,68 | ||||
| 2025-08-14 | 13F | CoreCap Advisors, LLC | 1.360 | 0,00 | 108 | 8,00 | ||||
| 2025-08-04 | 13F | Wealth Management Associates, Inc. | 3.822 | 0,00 | 304 | 7,42 | ||||
| 2025-08-13 | 13F | Russell Investments Group, Ltd. | 382 | 5,82 | 30 | 15,38 | ||||
| 2025-07-10 | 13F | Marshall Financial Group LLC | 5.600 | -9,98 | 450 | -2,17 | ||||
| 2025-08-12 | 13F | Archer Investment Corp | 1.099 | 242,37 | 88 | 278,26 | ||||
| 2025-07-17 | 13F | Janney Montgomery Scott LLC | 11.659 | 4,57 | 1 | |||||
| 2025-07-14 | 13F | AdvisorNet Financial, Inc | 977 | 0,21 | 78 | 6,94 | ||||
| 2025-08-05 | 13F | Westside Investment Management, Inc. | 177 | 0,57 | 14 | 7,69 | ||||
| 2025-07-10 | 13F | Wealth Enhancement Advisory Services, Llc | 30.634 | -1,47 | 2.482 | 7,73 | ||||
| 2025-07-31 | 13F | Glass Jacobson Investment Advisors llc | 957 | -2,15 | 76 | 2,70 | ||||
| 2025-08-08 | 13F | Creative Planning | 4.592 | 13,95 | 366 | 22,48 | ||||
| 2025-07-14 | 13F | Matrix Trust Co | 177.216 | 1,39 | 14 | 16,67 | ||||
| 2025-07-28 | 13F | Copia Wealth Management | 10 | 0,00 | 1 | |||||
| 2025-07-25 | 13F | Yarger Wealth Strategies, Llc | 68.964 | 0,25 | 5.494 | 7,79 | ||||
| 2025-07-29 | 13F | Woodard & Co Asset Management Group Inc /adv | 48.553 | -2,79 | 3.868 | 4,51 | ||||
| 2025-08-12 | 13F | MAI Capital Management | 340 | 0,00 | 27 | 8,00 | ||||
| 2025-08-12 | 13F | Bedel Financial Consulting, Inc. | 47.512 | 2,22 | 3.785 | 10,39 | ||||
| 2025-08-11 | 13F | Aptus Capital Advisors, LLC | 108.491 | 2,80 | 8.642 | 10,54 | ||||
| 2025-08-14 | 13F | Hilltop Holdings Inc. | 7.671 | 611 | ||||||
| 2025-08-18 | 13F | Tyler-Stone Wealth Management | 3.526 | 0,00 | 281 | 7,28 | ||||
| 2025-07-24 | 13F | Blair William & Co/il | 19 | 0,00 | 2 | 0,00 | ||||
| 2025-08-13 | 13F | Northwestern Mutual Wealth Management Co | 34.308 | 5,89 | 2.733 | 13,83 | ||||
| 2025-08-19 | 13F | Asset Dedication, LLC | 42 | 0,00 | 3 | 0,00 | ||||
| 2025-08-14 | 13F | Capital Planning Advisors, LLC | 7.963 | 6,27 | 634 | 14,23 | ||||
| 2025-07-07 | 13F | Global Wealth Strategies & Associates | 1.100 | 0,00 | 88 | 7,41 | ||||
| 2025-07-18 | 13F | PFG Investments, LLC | 6.354 | 29,07 | 506 | 39,01 | ||||
| 2025-08-12 | 13F | O'shaughnessy Asset Management, Llc | 2 | 0 | ||||||
| 2025-07-28 | 13F | Harbour Investments, Inc. | 1.930 | -1,43 | 154 | 5,52 | ||||
| 2025-07-21 | 13F | Ameritas Advisory Services, LLC | 370 | 29 | ||||||
| 2025-07-30 | 13F | Financial Perspectives, Inc | 6.138 | 4,12 | 489 | 11,93 | ||||
| 2025-06-11 | 13F | Fortitude Financial, LLC | 70.502 | -85,42 | 5.223 | -85,82 | ||||
| 2025-07-22 | 13F | Olistico Wealth, LLC | 300 | 0,00 | 24 | 4,55 | ||||
| 2025-07-25 | 13F | Apollon Wealth Management, LLC | 10.838 | 0,00 | 863 | 7,61 | ||||
| 2025-08-14 | 13F | Mml Investors Services, Llc | 121.599 | 1,08 | 10 | 12,50 | ||||
| 2025-08-14 | 13F | Ameriprise Financial Inc | 113.909 | -2,91 | 9.074 | 4,46 | ||||
| 2025-08-26 | NP | EQ ADVISORS TRUST - EQ/Mid Cap Value Managed Volatility Portfolio Class IB | 7.464 | 0,00 | 595 | 7,61 | ||||
| 2025-07-25 | 13F | Atria Wealth Solutions, Inc. | 8.727 | -84,34 | 695 | -83,16 | ||||
| 2025-08-14 | 13F | Mariner, LLC | 7.121 | -3,27 | 567 | 4,04 | ||||
| 2025-05-12 | 13F | Independent Advisor Alliance | 0 | -100,00 | 0 | |||||
| 2025-08-04 | 13F | Creative Financial Designs Inc /adv | 153.163 | 2.080,88 | 12.201 | 2.246,15 | ||||
| 2025-08-13 | 13F | M&t Bank Corp | 6.162 | 69,47 | 491 | 82,16 | ||||
| 2025-08-05 | 13F | Plante Moran Financial Advisors, LLC | 1.675 | 0,00 | 133 | 7,26 | ||||
| 2025-08-12 | 13F | Global Retirement Partners, LLC | 11.938 | -16,70 | 951 | -12,92 | ||||
| 2025-08-12 | 13F | J.w. Cole Advisors, Inc. | 13.139 | 1,99 | 1.047 | 9,64 | ||||
| 2025-07-25 | 13F | Lion Street Advisors, LLC | 2.880 | -18,53 | 229 | -12,26 | ||||
| 2025-07-14 | 13F | S.A. Mason LLC | 11.930 | 0,50 | 950 | 8,08 | ||||
| 2025-08-13 | 13F | Cerity Partners LLC | 20.889 | 0,18 | 1.664 | 7,77 | ||||
| 2025-05-09 | 13F | Bouchey Financial Group Ltd | 0 | -100,00 | 0 | |||||
| 2025-08-04 | 13F | Rede Wealth, LLC | 10.445 | 2,99 | 832 | 10,79 | ||||
| 2025-09-04 | 13F/A | Advisor Group Holdings, Inc. | 128.821 | 1,29 | 10.266 | 8,91 | ||||
| 2025-08-14 | 13F | Arete Wealth Advisors, LLC | 2.707 | 0,11 | 0 | |||||
| 2025-07-18 | 13F | Liberty Capital Management, Inc. | 10.200 | 0,00 | 813 | 7,55 | ||||
| 2025-07-24 | 13F | Robertson Stephens Wealth Management, LLC | 3.560 | 0,00 | 284 | 7,60 | ||||
| 2025-07-24 | 13F | IFP Advisors, Inc | 240 | 0,00 | 19 | 11,76 | ||||
| 2025-08-05 | 13F | Tsfg, Llc | 420 | 0,00 | 0 | |||||
| 2025-08-14 | 13F | Glenview Trust Co | 3.887 | 0,00 | 310 | 7,67 | ||||
| 2025-07-14 | 13F | Signature Securities Group Corporation | 23.750 | -1,80 | 1.892 | 5,58 | ||||
| 2025-08-05 | 13F | EPG Wealth Management LLC | 1.423 | -20,86 | 113 | -15,04 | ||||
| 2025-08-14 | 13F | Wells Fargo & Company/mn | 81.593 | -21,23 | 6.500 | -15,30 | ||||
| 2025-08-05 | 13F | Integrity Financial Corp /WA | 220 | 0,00 | 18 | 6,25 | ||||
| 2025-08-05 | 13F | Sunburst Financial Group, LLC | 107.230 | 2,84 | 8.542 | 10,58 | ||||
| 2025-08-01 | 13F | Envestnet Asset Management Inc | 67.204 | 31,88 | 5.353 | 41,80 | ||||
| 2025-07-22 | 13F | Merit Financial Group, LLC | 27.254 | 10,63 | 2.171 | 18,96 | ||||
| 2025-05-08 | 13F | NorthRock Partners, LLC | 0 | -100,00 | 0 | |||||
| 2025-07-18 | 13F | Philip James Wealth Mangement, LLC | 5.694 | 0,33 | 454 | 7,86 | ||||
| 2025-08-12 | 13F | NFP Retirement, Inc. | 4.803 | 0,00 | 383 | 7,61 | ||||
| 2025-07-31 | 13F/A | Avion Wealth | 643 | 0,00 | 0 | |||||
| 2025-08-13 | 13F | Jones Financial Companies Lllp | 4.402 | 29,78 | 348 | 39,76 | ||||
| 2025-07-08 | 13F | Apella Capital, LLC | 11.532 | 0,00 | 928 | 13,60 | ||||
| 2025-08-12 | 13F | Clearwater Capital Advisors, LLC | 3.446 | 0,00 | 275 | 7,45 | ||||
| 2025-08-19 | 13F | Cape Investment Advisory, Inc. | 1.786 | 0,00 | 142 | 7,58 | ||||
| 2025-08-11 | 13F | Western Wealth Management, LLC | 0 | -100,00 | 0 | |||||
| 2025-08-12 | 13F | LPL Financial LLC | 498.843 | 9,97 | 39.738 | 18,25 | ||||
| 2025-07-17 | 13F | Global Trust Asset Management, LLC | 12 | 0,00 | 1 | |||||
| 2025-08-11 | 13F | Citigroup Inc | 4.103 | -2,10 | 327 | 5,16 | ||||
| 2025-04-30 | 13F | Sofos Investments, Inc. | 328 | 0,00 | 24 | 9,09 | ||||
| 2025-08-08 | 13F | Cetera Investment Advisers | 181.928 | 0,89 | 14.492 | 8,49 | ||||
| 2025-08-12 | 13F | CIBC Private Wealth Group, LLC | 7.264 | -23,58 | 579 | -6,92 | ||||
| 2025-08-11 | 13F | Principal Securities, Inc. | 316 | -22,55 | 25 | -19,35 | ||||
| 2025-08-14 | 13F | Matrix Private Capital Group Llc | 2.617 | -3,25 | 208 | 4,00 | ||||
| 2025-07-31 | 13F | Carnegie Capital Asset Management, LLC | 6.935 | 552 | ||||||
| 2025-07-18 | 13F | Benchmark Wealth Management, LLC | 55.403 | 0,04 | 4.413 | 7,58 | ||||
| 2025-08-04 | 13F | Jim Saulnier & Associates, Llc | 17.856 | -7,91 | 1.422 | -0,97 | ||||
| 2025-08-15 | 13F | Morgan Stanley | 1.254.715 | 5,02 | 99.951 | 12,93 | ||||
| 2025-08-12 | 13F | Howe & Rusling Inc | 1.736 | 138 | ||||||
| 2025-07-28 | 13F | RFG Advisory, LLC | 3.051 | -3,91 | 243 | 3,40 | ||||
| 2025-07-17 | 13F | Sound Income Strategies, LLC | 280 | 0,00 | 22 | 10,00 | ||||
| 2025-07-21 | 13F | Patriot Financial Group Insurance Agency, LLC | 38.738 | 8,69 | 3.086 | 16,86 | ||||
| 2025-08-01 | 13F | Boyd Watterson Asset Management Llc/oh | 184 | 0,00 | 15 | 7,69 | ||||
| 2025-08-04 | 13F | Adell Harriman & Carpenter Inc | 4.300 | 0,00 | 343 | 7,55 | ||||
| 2025-07-11 | 13F | Farther Finance Advisors, LLC | 42.691 | 1.347,15 | 3.401 | 1.452,51 | ||||
| 2025-08-11 | 13F | HighTower Advisors, LLC | 43.592 | 0,00 | 3.473 | 7,53 | ||||
| 2025-04-10 | 13F | Portside Wealth Group, LLC | 0 | -100,00 | 0 | -100,00 | ||||
| 2025-07-18 | 13F | Centricity Wealth Management, LLC | 308 | 0,00 | 25 | 9,09 | ||||
| 2025-08-14 | 13F | Integrated Wealth Concepts LLC | 6.860 | 0,18 | 546 | 7,69 | ||||
| 2025-08-14 | 13F | Fmr Llc | 14.672 | -12,54 | 1.169 | -5,96 | ||||
| 2025-08-15 | 13F | CI Private Wealth, LLC | 9.450 | 20,41 | 753 | 29,43 | ||||
| 2025-07-09 | 13F | Procyon Private Wealth Partners, LLC | 4.594 | 0,15 | 366 | 7,67 | ||||
| 2025-07-17 | 13F | XML Financial, LLC | 3.740 | -1,24 | 298 | 6,07 | ||||
| 2025-08-04 | 13F | Pensionmark Financial Group, Llc | 19.056 | -7,99 | 1.518 | -1,04 | ||||
| 2025-08-08 | 13F | Avantax Advisory Services, Inc. | 83.245 | 1,08 | 6.631 | 8,69 | ||||
| 2025-08-15 | 13F | Tower Research Capital LLC (TRC) | 0 | -100,00 | 0 | |||||
| 2025-08-07 | 13F | 49 Wealth Management, Llc | 4.790 | 0,34 | 382 | 7,93 | ||||
| 2025-08-08 | 13F | Gts Securities Llc | 0 | -100,00 | 0 | |||||
| 2025-08-14 | 13F | Raymond James Financial Inc | 317.974 | -1,15 | 25.330 | 6,29 | ||||
| 2025-08-14 | 13F | IHT Wealth Management, LLC | 4.711 | -0,32 | 375 | 7,14 | ||||
| 2025-08-06 | 13F | Decker Retirement Planning Inc. | 17 | 0,00 | 1 | 0,00 | ||||
| 2025-07-29 | 13F | Goldstein Advisors, LLC | 39.303 | 4,60 | 3.131 | 12,47 | ||||
| 2025-07-09 | 13F | Brand Asset Management Group, Inc. | 36.400 | 1,20 | 2.900 | 8,82 | ||||
| 2025-08-13 | 13F | Summit Wealth Group Llc / Co | 3.825 | 305 | ||||||
| 2025-05-14 | 13F | Jane Street Group, Llc | 0 | -100,00 | 0 | |||||
| 2025-08-14 | 13F | Bank Of America Corp /de/ | 92.496 | 3,33 | 7.368 | 11,11 | ||||
| 2025-08-12 | 13F | Jpmorgan Chase & Co | 25.892 | 3,99 | 2.063 | 11,82 | ||||
| 2025-08-14 | 13F | Comerica Bank | 6.077 | 6,15 | 484 | 14,15 | ||||
| 2025-08-08 | 13F | Foundations Investment Advisors, LLC | 3.161 | 0,00 | 252 | 7,26 | ||||
| 2025-08-06 | 13F | Savant Capital, LLC | 5.284 | 0,00 | 421 | 7,42 | ||||
| 2025-08-15 | 13F | Equitable Holdings, Inc. | 34.725 | 7,43 | 2.766 | 15,54 | ||||
| 2025-05-14 | 13F | Van Hulzen Asset Management, LLC | 0 | -100,00 | 0 | |||||
| 2025-07-18 | 13F | Truist Financial Corp | 23.209 | -1,44 | 1.849 | 5,96 | ||||
| 2025-08-14 | 13F | Royal Bank Of Canada | 53.929 | 16,56 | 4.296 | 25,32 | ||||
| 2025-07-23 | 13F | Kingswood Wealth Advisors, Llc | 0 | -100,00 | 0 | |||||
| 2025-04-21 | 13F | Nelson, Van Denburg & Campbell Wealth Management Group, LLC | 0 | -100,00 | 0 | |||||
| 2025-07-18 | 13F | Parsons Capital Management Inc/ri | 17.498 | -1,80 | 1.394 | 5,53 | ||||
| 2025-07-28 | 13F | Mutual Advisors, LLC | 4.520 | 0,00 | 372 | 13,46 | ||||
| 2025-07-30 | 13F | Whittier Trust Co Of Nevada Inc | 68 | 0,00 | 5 | 0,00 | ||||
| 2025-07-09 | 13F | Pps&v Asset Management Consultants, Inc. | 3.851 | 0,00 | 307 | 7,37 | ||||
| 2025-08-14 | 13F | Silvercrest Asset Management Group Llc | 3.089 | 0,00 | 246 | 7,89 | ||||
| 2025-07-10 | 13F | Three Seasons Wealth, LLC | 4.686 | -0,66 | 373 | 6,88 | ||||
| 2025-08-14 | 13F | Susquehanna International Group, Llp | 0 | -100,00 | 0 | |||||
| 2025-09-11 | 13F | Silicon Valley Capital Partners | 958 | 0,42 | 76 | 8,57 | ||||
| 2025-08-14 | 13F | GWM Advisors LLC | 2.001 | 0,25 | 159 | 8,16 | ||||
| 2025-08-08 | 13F | WASHINGTON TRUST Co | 0 | -100,00 | 0 | |||||
| 2025-07-22 | 13F | Steele Capital Management, Inc. | 177.217 | 1,39 | 14.117 | 9,03 | ||||
| 2025-08-15 | 13F | Kestra Advisory Services, LLC | 47.602 | 11,28 | 3.792 | 19,63 | ||||
| 2025-08-08 | 13F | Capital Investment Advisory Services, LLC | 96 | 8 | ||||||
| 2025-08-13 | 13F | Proactive Wealth Strategies LLC | 4.256 | 0,33 | 0 | |||||
| 2025-07-31 | 13F | Briaud Financial Planning, Inc | 60 | 0,00 | 0 | |||||
| 2025-05-08 | 13F | Empirical Financial Services, LLC d.b.a. Empirical Wealth Management | 0 | -100,00 | 0 | |||||
| 2025-07-21 | 13F | Triad Wealth Partners, LLC | 7.632 | 608 | ||||||
| 2025-07-22 | 13F | Miracle Mile Advisors, LLC | 8.522 | -18,80 | 679 | -12,74 | ||||
| 2025-04-30 | 13F | Stratos Wealth Partners, LTD. | 0 | -100,00 | 0 | |||||
| 2025-08-04 | 13F | Assetmark, Inc | 2.383 | -76,52 | 190 | -74,83 | ||||
| 2025-07-23 | 13F | RMG Wealth Management LLC | 1.083.709 | 87.672 | ||||||
| 2025-07-29 | 13F | Salomon & Ludwin, LLC | 241 | 0,00 | 19 | 11,76 | ||||
| 2025-08-12 | 13F | Steward Partners Investment Advisory, Llc | 2.163 | 0,84 | 172 | 8,86 | ||||
| 2025-08-12 | 13F | Gladstone Institutional Advisory LLC | 67.124 | -0,44 | 5.347 | 7,07 | ||||
| 2025-07-14 | 13F | Farmers & Merchants Investments Inc | 3.012 | 0,00 | 240 | 7,17 | ||||
| 2025-07-31 | 13F | Schneider Downs Wealth Management Advisors, LP | 4.053 | 323 | ||||||
| 2025-07-11 | 13F | Kaydan Wealth Management, Inc. | 5.392 | 0,00 | 430 | 7,52 | ||||
| 2025-08-18 | 13F | Geneos Wealth Management Inc. | 4.480 | 100,00 | 357 | 115,76 | ||||
| 2025-05-14 | 13F | Mission Creek Capital Partners, Inc. | 0 | -100,00 | 0 | |||||
| 2025-08-05 | 13F | Bank Of Montreal /can/ | 0 | -100,00 | 0 | |||||
| 2025-07-24 | 13F | Edge Financial Advisors LLC | 3.114 | 250 | ||||||
| 2025-07-10 | 13F | Security National Bank | 100 | 0,00 | 8 | 0,00 | ||||
| 2025-08-01 | 13F | SYM FINANCIAL Corp | 228 | 18 | ||||||
| 2025-07-14 | 13F | Sowell Financial Services LLC | 38.539 | 3.070 | ||||||
| 2025-08-11 | 13F | Private Advisor Group, LLC | 2.893 | 4,82 | 230 | 12,75 |